Petersburg National Battlefield and Richmond National Battlefield Park - Weather of 2007 Natural Resource Data Series NPS/MIDN/NRDS-2010/051
←
→
Page content transcription
If your browser does not render page correctly, please read the page content below
National Park Service
U.S. Department of the Interior

Natural Resource Program Center

Petersburg National Battlefield and
Richmond National Battlefield Park
Weather of 2007
Natural Resource Data Series NPS/MIDN/NRDS—2010/051
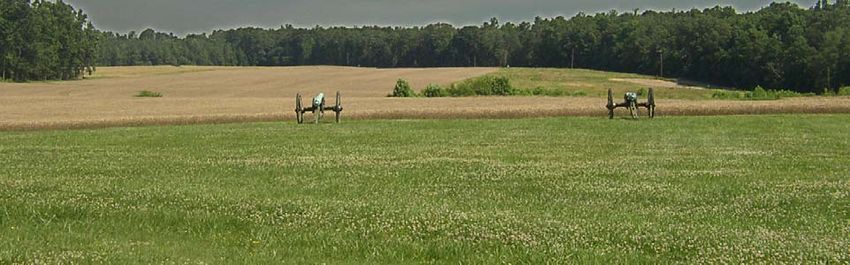
ON THE COVER
Malvern Hill, Richmond National Battlefield Park, VA
Photo by: James Comiskey, NPS
Petersburg National Battlefield and
Richmond National Battlefield Park
Weather of 2007
Natural Resource Data Series NPS/MIDN/NRDS—2010/051

Paul Knight, Tiffany Wisniewski, Chad Bahrmann, and Sonya Miller

Pennsylvania State Climate Office
503 Walker Building
Pennsylvania State University
University Park, Pennsylvania 16802

May 2010

U.S. Department of the Interior
National Park Service
Natural Resource Program Center
Fort Collins, Colorado
The National Park Service, Natural Resource Program Center publishes a range of reports that
address natural resource topics of interest and applicability to a broad audience in the National
Park Service and others in natural resource management, including scientists, conservation and
environmental constituencies, and the public.

The Natural Resource Data Series is intended for timely release of basic data sets and data
summaries. Care has been taken to assure accuracy of raw data values, but a thorough analysis
and interpretation of the data has not been completed. Consequently, the initial analyses of data
in this report are provisional and subject to change.

All manuscripts in the series receive the appropriate level of peer review to ensure that the
information is scientifically credible, technically accurate, appropriately written for the intended
audience, and designed and published in a professional manner. This report received informal
peer review by subject-matter experts who were not directly involved in the collection, analysis,
or reporting of the data. Data in this report were collected and analyzed using methods based on
established, peer-reviewed protocols and were analyzed and interpreted within the guidelines of
the protocols.

Views, statements, findings, conclusions, recommendations, and data in this report are those of
the author(s) and do not necessarily reflect views and policies of the National Park Service, U.S.
Department of the Interior. Mention of trade names or commercial products does not constitute
endorsement or recommendation for use by the National Park Service.

This report is available from the Mid-Atlantic Network
(http://science.nature.nps.gov/im/units/MIDN) and the Natural Resource Publications
Management website (http://www.nature.nps.gov/publications/NRPM).

Please cite this publication as:

Knight, P., T. Wisniewski, C. Bahrmann, and S. Miller. 2010. Petersburg National Battlefield
and Richmond National Battlefield Park: weather of 2007. Natural Resource Data Series
NPS/MIDN/NRDS—2010/051. National Park Service, Fort Collins, Colorado.

NPS 325/102304, 367/102304, May 2010

                                                 ii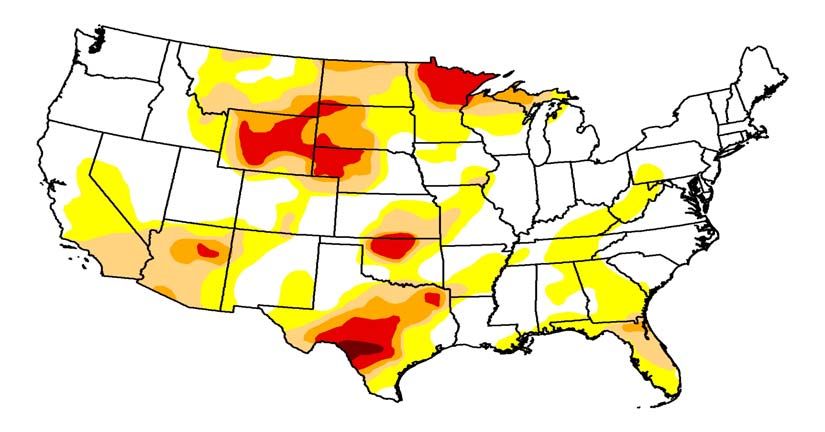
Contents
                                                                                                                                              Page

Figures............................................................................................................................................ iv
Tables............................................................................................................................................. vi
List of Key Acronyms................................................................................................................... vii
Purpose of the Report...................................................................................................................... 1
Weather Summary .......................................................................................................................... 2
      Long-term Trends .................................................................................................................... 2
The Climate of the Greater Richmond Area ................................................................................... 3
Observing Stations .......................................................................................................................... 4
Temperature Summary.................................................................................................................... 7
Precipitation Summary.................................................................................................................. 14
Stream Flow .................................................................................................................................. 18
Drought Status .............................................................................................................................. 19
Global and National Summary...................................................................................................... 22
Selected References ...................................................................................................................... 27
Appendix....................................................................................................................................... 29

                                                                         iii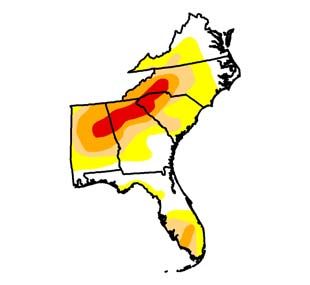
Figures
                                                                                                                                           Page

Figure 1. A snapshot of the Web interface that is available at
http://climate.met.psu.edu/gmaps/NPS_DEVELOPMENT/interface.php/. ................................... 4
Figure 2. Location of weather observing stations around Petersburg NB and
Richmond NBP. .............................................................................................................................. 5
Figure 3. Maps showing departures from average maximum daily temperatures
for each month in the calendar year 2007 as compared with the normal based on
the period 1971–2000. .................................................................................................................. 10
Figure 4. Maps showing departures from average minimum temperatures for each
month in the calendar year 2007 as compared with the normal based on the period
1971–2000..................................................................................................................................... 11
Figure 5. Annual temperature trends for Petersburg NB and Richmond NBP from
1979–2007..................................................................................................................................... 12
Figure 6. Representation of the lowest annual temperature trend for Petersburg
NB and Richmond NBP from 1972–2007. ................................................................................... 12
Figure 7. The growing season trend for Petersburg NB and Richmond NBP from
1990–2007..................................................................................................................................... 13
Figure 8. Maps showing percent of average precipitation for each month in the
calendar year 2007 as compared with the normal based on the period 1971–2000. .................... 15
Figure 9. Annual precipitation trends for Petersburg NB and Richmond NBP
from 1979–2007............................................................................................................................ 17
Figure 10. Discharge data for gage at James River near Richmond, VA. ................................... 18
Figure 11. Discharge data for gage at James River near Cartersville, VA. ................................. 18
Figure 12. A comparison of the Palmer Drought Severity Index (PDSI) for the
Virginia Climate Division 2 encompassing most of Petersburg NB and Richmond
NBP from 2005–2007. .................................................................................................................. 19
Figure 13. The mid-month values of the Palmer Drought Severity Index for
Virginia in 2007 showing that dry conditions encroached on Petersburg NB and
Richmond NBP. ............................................................................................................................ 20
Figure 14. The mid-month values of the Palmer Drought Severity Index for the
Southeast during the 2007 warm season....................................................................................... 21
Figure 15. Global temperature anomalies for 2007 with respect to a 1961–1990
base period. ................................................................................................................................... 22

                                                                        iv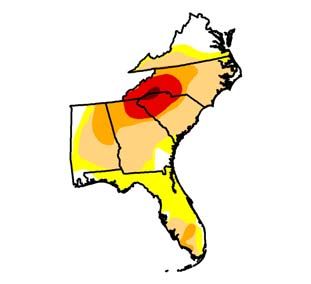
Figure 16. North American snow cover anomalies for 1967–2007 winters (Dec.–
Feb.). ............................................................................................................................................. 23
Figure 17. Northern Hemisphere snow cover anomalies for 1967–2007 spring
(March–May). ............................................................................................................................... 24
Figure 18. The long-term annual temperature trend for the United States based on
the Historical Climate Network (HCN) which is a subset of the Cooperative
Network of Weather Observers. ................................................................................................... 25
Figure 19. Palmer Drought Severity Index for January 2, 2007. ................................................. 26
Figure 20. Palmer Drought Severity Index for December 25, 2007. ........................................... 26

                                                                          v
Tables
Page
Table 1. Summary of 2007 significant weather indicators for Petersburg NB and
Richmond NBP. .............................................................................................................................. 2
Table 2. Listing of the five data networks around Petersburg NB and Richmond
NBP................................................................................................................................................. 6
Table 3. List of weather observing stations around Petersburg NB and Richmond
NBP................................................................................................................................................. 6
Table 4. Seasonal temperature and precipitation rankings over 114 years for VA
Climate Division 2 for 2007. .......................................................................................................... 7
Table 5. Summary of monthly average temperatures for 2007 from reporting sites
that represent Petersburg NB and Richmond NBP. ........................................................................ 8
Table 6. Summary of departure from normal temperature based on 30-year
normal (1971–2000) for 2007 from reporting sites that represent Petersburg NB
and Richmond NBP. ....................................................................................................................... 9
Table 7. Status of 2007 temperature indicators compared to the 30-year normal
(1971–2000) at Richmond, VA, weather observing station. .......................................................... 9
Table 8. A comparison of wettest single calendar days during 2007 with the
longest periods with a trace or less of rainfall during the same year in both parks. ..................... 14
Table 9. Summary of precipitation in 2007 for reporting sites that represent
Petersburg NB and Richmond NBP.............................................................................................. 16
Table 10. Summary of 2007 percent of normal precipitation based on 30-year
normal (1971–2000) for reporting sites that represent Petersburg NB and
Richmond NBP. ............................................................................................................................ 16
Table 11. Status of 2007 precipitation indicators compared to the 30-year normal
(1971–2000) at the Richmond station. The values in 2007 showed below normal
annual rainfall and snowfall. Several long dry spells were also noted. ........................................ 17
viList of Key Acronyms
COOP National Weather Service Cooperative Observer Program
CWOP Citizen Weather Observer Program
FAA Federal Aviation Administration
IFLOWS Integrated Flood Observing and Warning System
NADP National Atmospheric Deposition Program
NARR North American Regional Reanalysis
NB National Battlefield
NBP National Battlefield Park
NCDC National Climatic Data Center
NWS National Weather Service
PDSI Palmer Drought Severity Index
PETE Petersburg National Battlefield
PRISM Parameter-elevation Regressions on Independent Slopes Model
RAWS Remote Automated Weather Stations
RICH Richmond National Battlefield Park
USGS United States Geological Survey
viiPurpose of the Report
Weather and climate are widely recognized as key drivers of terrestrial and aquatic ecosystems,
affecting biotic as well as abiotic ecosystem characteristics and processes. Global and regional
scale climatic patterns, trends, and variations are critical to the cycling of elements, nutrients, and
minerals through the ecosystems and can deliver pollutants from regional and even global
sources. These variations and trends influence the fundamental properties of ecologic systems
such as soil-water relationships and plant-soil processes and their disturbance rates and intensity.
Information obtained from meteorological monitoring will be useful to interpreting and
understanding changes in species composition, community structure, water and soil chemistry,
and related landscape processes.
The purpose of this report is to provide a concise climate summary for January 1 to December
31, 2007, and to place current patterns and trends in an appropriate historical, regional, and
global context (Knight et all, in preparation). It is our intention that this report will satisfy an
inherent interest in meteorological phenomena, meet the Mid-Atlantic Network (MIDN) Weather
and Climate Monitoring objectives:
• Document long-term trends in weather and climate through seasonal and annual
summaries of selected parameters (e.g., multiple forms of precipitation, temperature).
• Identify and document extremes and averages of climatic conditions for common
parameters (e.g., precipitation, air temperature), and other parameters where sufficient
data are available (e.g., wind speed and direction, solar radiation).
• Provide information on near real-time weather parameters, historical climate patterns, and
climate station metadata from a single, easy to use Internet portal.
To accomplish these objectives, a variety of atmospheric data streams were evaluated for their
quality, longevity, and applicability to the MIDN parks. Since no single weather observing
network contains all the pertinent measures of atmospheric phenomena to assess ecosystem
health, an objective analysis of the data networks was developed. Through this analysis, a select
number of stations were chosen as representative of each park and these are the primary data
sources used in the profile of last year’s climate summary and trends.
1Weather Summary
Overall, 2007 was warmer and drier than the long-term average. While the calendar year began
quite mild, the period from mid-January until late-February was consistently cold with a couple
snow and ice events. March turned milder with near average rainfall. Another bout of rather cold
air was noted in April that lasted until mid-month with a departure of 1–3°F (0.6–1.8°C) from
normal maximum temperature for April. A widespread rainstorm occurred on April 15th with
some sections receiving more than 2.3 in (58 mm) in one day. Rain became lighter and
infrequent during May, but June saw regular showers and warmer than average temperatures.
July was cooler and drier than normal. The hottest weather of the summer came in early August.
Very warm weather in September continued into much of October with departures of 5–7°F (3–
4°C) for maximum temperature in October. November was cool and quite dry and the year
concluded with mild air. Both snowfall and rainfall for 2007 were noticeably below average
(Table 1).
Long-term Trends
The rise in winter minimum temperatures continued in 2007. However, the lengthening of the
growing season showed little change in 2007. The occurrence of the ‘last’ frost (mid-April) and a
late first freeze (late October) made this year near normal in length. The trend toward milder
winter nights continued in 2007 despite a late January to mid-February cold snap which
produced single readings on a couple of (-14°C) mornings (Table 1). While summer (Jul–Aug–
Sep) was the wettest period in 2007 it was not as wet as previous summers and only a bit above
normal.
The factors that influence seasonal trends are ocean temperature anomalies. The longer-term
effects of a change in water temperatures to lower (cool) values around the rim of the North
Pacific adjacent to North America are impacting autumn temperatures (warmer than usual Sept–
Oct) as well as the frequency of cold air outbreaks during the winter in Virginia (more often). A
minimum in solar activity (very few sunspots), which often correlates to slowly dropping mean
annual temperatures, was also noted in 2007.
Table 1. Summary of 2007 significant weather indicators for Petersburg NB and Richmond NBP.
2007
Weather Indicators Statistics Comments on Trends
Hot Days (days with Tmax ≥ 90°F/32°C) 49–53 Above the 30-year mean of 41
Cold Days(days with Tmax ≤ 32°F/0°C) 0–2 Below the 30-year mean of 7
Winter Minimums (lowest temperature) ~7°F Below the long term average of -3°F (-18°C)
-14°C
Growing Season Length (days between last 191–212 Near the 30-year mean of 200–210
32°F/0°C in spring and first 32°F/0°C in fall)
Annual Precipitation 25–41 in Below the average of 44 in (1118 mm)
635–1041 mm
Annual Snowfall 1–5 in Below the 30-year mean of 12 in (305 mm)
3–13 cm
2The Climate of the Greater Richmond Area
The Southeast section of Virginia is generally considered to have a humid continental type of
climate with relatively flat terrain keeping conditions homogeneous (Davey et al. 2006). The
prevailing westerly winds carry most of the weather disturbances that affect the region from the
interior of the continent, so that the Atlantic Ocean has occasional influence on the climate of the
area. Coastal storms do, at times, affect the day-to-day weather, especially in the winter. Also,
storms of tropical origin can have significant effect within this part of Virginia, causing severe
floods in some instances.
Temperatures are moderately continental with the tempering effects due to the nearby ocean that
contributes to cloud production in the summer and onshore winds modifying the chill at times
during the winter. The lowest readings in the winter occur with polar air masses of Canadian
origin settling over the Northeast after a fresh snowfall. The highest readings of the summer
happen when the sub-tropical fair weather system, the Bermuda high, pushes westward into the
Carolinas. Its clockwise circulation will direct hot, humid air from the Gulf region into the area.
The southwest winds gain additional warmth when descending the Appalachians. The last freeze
typically occurs in early April and the first frosts appear in November.
Precipitation is fairly evenly distributed throughout the year. Annual amounts generally range
between 40 to 48 in (1016–1219 mm), while the majority of the area receives about 44 in (1118
mm). Greatest amounts usually occur in the late spring and summer months, while February is
the driest month, having about 2 in (50.8mm) less than the wettest months. Precipitation tends to
be somewhat greater at the coast, due primarily to coastal storms which occasionally frequent the
area. During the warm season these storms can bring heavy rain, while in winter, heavy snow or
a mixture of rain and snow may be produced.
Surface winds blow from the west and northwest in the cold season and from the southwest
during the warm half of the year. Thunderstorms follow a frequency that matches the solar cycle,
occurring between the equinoxes and reaching a peak near the solstice. Hail is relatively
infrequent, occurring about once every other year, but flash floods and damaging thunderstorm
winds affect parts of the parks each summer. On average, tornadoes pass through the area about
once every three years. The direct effects of an Atlantic hurricane are infrequent, though remnant
rains from tropical storms have contributed to the region’s worst floods.
3Observing Stations
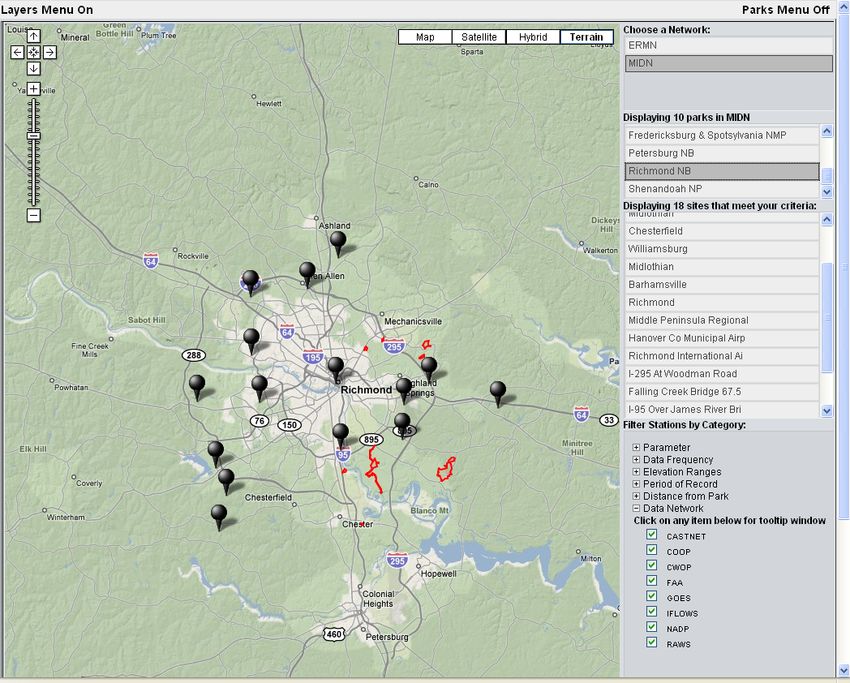
In addition to the summary information available in this report, a Web interface is available that
has a variety of data sources in near real-time (Figure 1). Select NPS Inventory and Monitoring
Network in upper right corner and then directly below this, choose a network. You can also filter
weather monitoring stations by various categories. We encourage you to take a few minutes to go
through the tutorial that describes the attributes of this site:
http://climate.met.psu.edu/gmaps/NPS_DEVELOPMENT/NPStutorial.2.26.08.pdf.
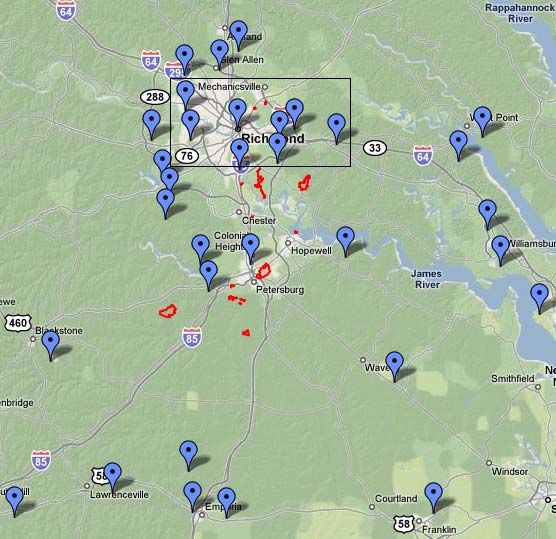
A total of 32 weather observing stations comprising five weather observing networks were
selected around Petersburg NB and Richmond NBP (Table 2). The station identifiers in blue text
(Figure 2) indicate those from which data has been used within this report. Stations that are not
in the blue or bold text contain incomplete data for 2007 (Table 3).
Figure 1. A snapshot of the Web interface that is available at
http://climate.met.psu.edu/gmaps/NPS_DEVELOPMENT/interface.php/.
4KOFP
CW4237
VA003 Richmond National
Battlefield Park
CW4722 VA037
KFYJ VA022 VA023
CW5612
CW6154
KRIC
CW0609 WB4PGT
CW5207 K4RCB
CW1481
CW4862 VA019
Petersburg PRGV2
National KPTB
KJGG
Battlefield
KFAF
5
CAPV2
KAKQ
CW4206
W4WGT
KFKN
KAVC EPRV2 KEMV
Figure 2. Location of weather observing stations around Petersburg NB and Richmond NBP.Table 2. Listing of the five data networks around Petersburg NB and Richmond NBP.
Data Network Number of Stations
CWOP 13
FAA 10
VADOT 6
COOP 2
RAWS 1
Table 3. List of weather observing stations around Petersburg NB and Richmond NBP. Those that are in bold have been selected as
representative of the park in large part due to the percent time of reporting during 2007. Not all data networks are shown here – missing are:
CWOP, VADOT and RAWS because their data are either incomplete or not quality assured.
Percentage of Percentage of Percentage of Percentage of
Time Reporting Time Reporting Time Reporting Time Reporting
Observing Temperature Precipitation Temperature Precipitation
Station Network Station Name Period of Record (POR) for 2007 for 2007 for entire POR for entire POR
KFYJ FAA Middle Peninsula 2004-01-01 Present 97.8 0.0 91.3 11.1
6
KOFP FAA Hanover 1996-01-01 Present 97.3 97.3 93.3 93.6
KRIC FAA Richmond 1949-02-01 Present 100.0 100.0 95.8 95.8
KAKQ FAA Wakefield 1997-01-01 Present 100.0 100.0 96.5 95.9
KAVC FAA Mecklenburg 1997-01-01 Present 99.2 99.2 95.1 85.1
KEMV FAA Emporia 2002-02-28 Present 40.5 40.5 30.0 8.2
KFAF FAA Felker Army Airfield 1996-01-02 Present 88.8 0.0 71.4 8.3
KFKN FAA Franklin 1996-01-01 Present 97.8 0.0 94.6 9.6
KJGG FAA Williamsburg 2003-01-01 Present 99.2 99.2 94.0 89.9
KPTB FAA Petersburg 1996-01-01 Present 95.6 95.6 75.9 75.9
CAPV2 COOP Camp Pickett 1972-08-01 Present 100.0 99.5 98.0 98.0
EPRV2 COOP Emporia 1920-01-01 Present 100.0 100.0 29.4 84.6Temperature Summary
The year began quite mild, but it turned much colder in mid-January. The period from January
17–February 20 featured numerous sub-freezing nights and a couple of sub-freezing days. It was
during this time that a bit of snow fell. The winter’s most widespread snow and ice came around
Valentine’s Day when between 0.5–2 in (1–5 cm) of snow fell across the region. The snow was
mixed with sleet and freezing rain in many sections. March turned milder and was a bit wetter
(Table 4). A ten-day period of unseasonably cold weather was accompanied by late hard freezes
in the first half of April. The cold snap ended with a powerful nor’easter bringing widespread
heavy rainfall on April 15. The month of May turned warmer and the regular rains ended as it
turned quite dry (Tables 5, 6, and 7).
The summer of 2007 had several episodes of hot weather with warm season daily departures
>+5°F (+2.8°C) from May 25–June 3, August 1–10 (the hottest spell), and September 4–11.
Oddly, the most anomalously warm weather did not occur until October 4–10 when readings
averaged more than +10°F (5.6°C) above the long-term mean for this week-long period. Several
places noted their highest readings ever so late in the season (exceeding 90°F/32°C). A couple of
heavy rain storms dropped readings back to seasonal levels in late-October. The first frosts
occurred by November 7. November and December were marked by alternating cool and warm
spells, though the warm spells lasted longer, and the result was both months averaged near to
above normal (Figures 3 and 4). The season’s first light snow came in the higher elevations to
the west on December 6th. The year concluded with two weeks of quite mild weather.
Maps showing departures from average maximum daily temperatures (Figure 3) and average
minimum temperatures (Figure 4) for each month in the calendar year 2007, as compared with
the normal, based on the period 1971–2000 are illustrated. Departure values are reported in
degrees Fahrenheit. Maps were created using estimates from the Parameter-elevation
Regressions on Independent Slopes Model (PRISM). PRISM uses an interpolation scheme for
temperature between actual observations and corrects these estimates for changes in topography
across the region. More information can be found at: http://www.prism.oregonstate.edu/.
An upward temperature trend (Figure 5) and increase in the lowest annual temperature (Figure 6)
can be observed for the parks over the past 30 years. There is no distinct trend in the growing
season over a forty-year record for stations near the parks (Figure 7).
Table 4. Seasonal temperature and precipitation rankings over 114 years for VA Climate Division 2 for
2007. The values show the mildest and driest weather occurred in the autumn.
Climate Division Rankings – Jan–Feb–Mar Apr–May–Jun Jul–Aug–Sep Oct–Nov–Dec
Virginia Climate Division 2 WINTER SPRING SUMMER AUTUMN
Temperature-2007 33 42 18 8
Precipitation-2007 83 65 102 50
1 = Warmest or Wettest 114 = Coldest or Driest
7Table 5. Summary of monthly average temperatures for 2007 from reporting sites that represent Petersburg NB and Richmond NBP.
Station Location ID Jan Feb Mar Apr May Jun Jul Aug Sep Oct Nov Dec Annual
d b
Middle Peninsula, 5.31°C 1.73°C 11.18°C 13.46°C 19.38°C 23.88°C 25.13°C 25.78 °C 21.78°C 21.02°C 9.04 °C 6.65°C 11.98°C
KFYJ
VA d b
41.56°F 35.12°F 52.13°F 56.23°F 66.89°F 74.98°F 77.23°F 78.41 °F 71.21°F 69.84°F 48.27 °F 43.97°F 53.56°F
d
6.03°C 1.42°C 10.91°C 13.36°C 19.26°C 23.66°C 24.82°C 26.10 °C 21.65°C 18.41°C 9.85°C 6.08°C 15.13°C
Hanover, VA KOFP
d
42.85°F 34.55°F 51.63°F 56.04°F 66.66°F 74.58°F 76.68°F 78.99 °F 70.98°F 65.13°F 49.73°F 42.95°F 59.23°F
6.67°C 2.01°C 11.11°C 14.15°C 19.58°C 24.32°C 25.40°C 26.44°C 22.34°C 19.12°C 9.85°C 6.60°C 15.63°C
Richmond, VA KRIC
44.01°F 35.62°F 52.01°F 57.47°F 67.25°F 75.78°F 77.73°F 79.60°F 72.21°F 66.42°F 49.73°F 43.88°F 60.14°F
6.51°C 2.13°C 10.49°C 13.65°C 18.67°C 23.34°C 24.65°C 25.78°C 21.44°C 18.30°C 8.91°C 7.59°C 15.12°C
Wakefield, VA KAKQ
43.72°F 35.83°F 50.87°F 56.56°F 65.61°F 74.02°F 76.37°F 78.40°F 70.60°F 64.93°F 48.03°F 45.67°F 59.22°F
d
8.76°C 4.79°C 12.87°C 14.39°C 19.20°C 24.50°C 25.79°C 28.20 °C 23.56°C 20.25°C 11.55°C 9.49°C 16.94°C
Mecklenburg, VA KAVC
d
47.76°F 40.62°F 55.16°F 57.89°F 66.56°F 76.09°F 78.42°F 82.77 °F 74.42°F 68.46°F 52.78°F 49.08°F 62.50°F
d
4.46°C 3.43°C 11.58°C 14.75°C 19.53°C 24.60°C 26.60°C 27.22 °C 22.74°C 19.61°C 9.96°C 8.29°C 16.32°C
Franklin, VA KFKN
d
45.44°F 38.18°F 52.85°F 58.56°F 67.15°F 76.29°F 79.87°F 81.00 °F 72.94°F 67.30°F 49.92°F 46.93°F 61.37°F
d
8.03°C 3.19°C 11.77°C 14.86°C 20.30°C 25.46°C 26.43°C 27.52 °C 23.68°C 22.26°C 12.55°C 8.48°C 17.04°C
Williamsburg, VA KJGG
d
46.45°F 37.75°F 53.19°F 58.74°F 68.54°F 77.82°F 79.58°F 81.55 °F 74.62°F 72.08°F 54.60°F 47.26°F 62.68°F
8
d d
7.53 °C 2.29 °C 11.73°C 13.82°C 19.57°C 24.03°C 25.44°C 26.74°C 21.81°C 17.83°C 9.17°C 6.59°C 15.55°C
Petersburg, VA KPTB
d d
45.55 °F 36.12 °F 53.12°F 56.88°F 67.22°F 75.26°F 77.79°F 80.13°F 71.26°F 64.10°F 48.50°F 43.87°F 59.98°F
5.32°C 0.88°C 10.53°C 12.76°C 18.66°C 23.23°C 24.54°C 26.42°C 21.97°C 17.74°C 8.73°C 6.03°C 14.74°C
Camp Pickett, VA CAPV2
41.58°F 33.59°F 50.95°F 54.97°F 65.58°F 73.82°F 76.18°F 79.56°F 71.55°F 63.94°F 47.72°F 42.85°F 58.52°F
6.72°C 2.13°C 10.56°C 13.88°C 18.84°C 23.81°C 25.44°C 27.37°C 22.91°C 19.20°C 9.90°C 7.47°C 15.69°C
Emporia, VA EPRV2
44.10°F 35.84°F 51.02°F 56.98°F 65.90°F 74.87°F 77.79°F 81.27°F 73.23°F 66.56°F 49.82°F 45.45°F 60.24°F
a
1 day is missing, b2 days missing, c3 days missing, d4 days missing
Monthly statistics not reported if more than 4 days are missing.Table 6. Summary of departure from normal temperature based on 30-year normal (1971–2000) for 2007 from reporting sites that represent
Petersburg NB and Richmond NBP.
Station Location ID Jan Feb Mar Apr May Jun Jul Aug Sep Oct Nov Dec
2.24°C -2.97°C 2.21°C -0.66°C 0.87°C 0.82°C -0.09°C 1.54°C 1.1°C 3.91°C 0.27°C 1.19°C
Hanover, VA KOFP
4.04°F -5.34°F 3.98°F -1.19°F 1.56°F 1.48°F -0.16°F 2.76°F 1.98°F 7.03°F 0.50°F 2.14°F
3.12°C -2.79°C 2.15°C -1.30°C -0.06°C 0.05°C -0.48°C 1.34°C 0.42°C 2.55°C -0.98°C 1.36°C
Petersburg, VA KPTB
5.61°F -5.02°F 3.86°F -2.35°F -0.10°F 0.09°F -0.86°F 2.42°F 0.76°F 4.58°F -1.77°F 2.45°F
4.23°C -2.16°C 2.39°C 0.21°C 1.03°C 1.27°C -0.07°C 1.84°C 1.34°C 4.52°C 0.41°C 1.94°C
Richmond, VA KRIC
7.62°F -3.88°F 4.30°F 0.37°F 1.86°F 2.28°F -0.14°F 3.31°F 2.41°F 8.13°F 0.73°F 3.49°F
4.43°C -1.92°C 2.44°C 0.52°C 1.30°C 2.23°C 0.82°C 2.80°C 2.12°C 6.82°C 2.06°C 2.65°C
Williamsburg, VA KJGG
7.97°F -3.46°F 4.38°F 0.94°F 2.35°F 4.02°F 1.48°F 5.03°F 3.82°F 12.27°F 3.70°F 4.77°F
3.32°C -2.61°C 2.53°C -0.23°C 0.82°C 0.90°C -0.40°C 2.32°C 1.47°C 3.91°C 0.07°C 2.09°C
Camp Pickett, VA CAPV2
5.97°F -4.70°F 4.56°F -0.43°F 1.48°F 1.62°F -0.72°F 4.17°F 2.65°F 7.04°F 0.12°F 3.75°F
3.55°C -2.53°C 1.57°C -0.12°C 0.16°C 0.82°C -0.06°C 2.82°C 1.79°C 4.42°C 0.23°C 2.36°C
Emporia, VA EPRV2
6.39°F -4.55°F 2.83°F -0.22°F 0.29°F 1.47°F -0.11°F 5.08°F 3.23°F 7.95°F 0.42°F 4.26°F
9
Table 7. Status of 2007 temperature indicators compared to the 30-year normal (1971–2000) at Richmond, VA, weather observing station. The
winter months brought seasonal chill with below average number of cold days. However, the summer of 2007 was above normal with the number
of hot days (about 15% more hot days).
Richmond, VA Richmond, VA
(KRIC) (KRIC)
Temperature Indicators 2007 1971–2000
Cold Days (days with Tmax ≤ 32°F/0°C) 2 7.2
Sub-Freezing Nights (days with Tmin ≤ 32°F/0°C) 64 80.9
Cold Winter Nights (days with Tmin ≤ 0°F/17°C) 0 0.3
Hot Days (days with Tmax ≥ 90°F/32°C) 49 40.7
Growing Season Length (days between last 32°F/0°C in Spring and first 32°F/0°C in Fall) 212 200–210Petersburg NB and Richmond NBP
Departure from Average Monthly Maximum Temperature
2007 vs. 1971–2000
January February March April
May June July August
September October November December
Figure 3. Maps showing departures from average maximum daily temperatures for each month in the
calendar year 2007 as compared with the normal based on the period 1971–2000.
10Petersburg NB and Richmond NBP
Departure from Average Monthly Minimum Temperature
2007 vs. 1971–2000
January February March April
May June July August
September October November December
Figure 4. Maps showing departures from average minimum temperatures for each month in the calendar
year 2007 as compared with the normal based on the period 1971–2000.
1162
60
58
Temperature (F)
56
54
52
50
1979 1983 1987 1991 1995 1999 2003 2007
NARR Data Camp Pickett Data Clim Div 2 Linear (Camp Pickett Data)
Figure 5. Annual temperature trends for Petersburg NB and Richmond NBP from 1979–2007. The red
line shows VA Climate Division 2 data which are composed of more than 10 climate stations in the
Virginia counties adjacent to the parks. The dark blue line is the temperature trend for a 32 km square
box around PETE/RICH as derived from the North American Regional Reanalysis data set (NARR). This
gridded database was the initial conditions for the numerical weather prediction models. The light blue
shows the trend from a single Cooperative (COOP) weather station at Camp Pickett, VA. The agreement
between all three data sources indicates the reliability of the NARR data as a good proxy for actual in-
park observations. The temperature trend is upward at a rate of about 0.6°F (0.35°C) per decade.
20
15
10
5
0
1970 1975 1980 1985 1990 1995 2000 2005 2010
-5
-10
-15
Lowest Annual Temp. (F) 4 per. Mov. Avg. (Lowest Annual Temp. (F))
Figure 6. Representation of the lowest annual temperature trend for Petersburg NB and Richmond NBP
from 1972–2007. The COOP site, Camp Pickett, VA, was used to determine this trend due to its long
period of record and percent time of reporting. The last sub-zero reading occurred in 2000.
12260
240
Length of the Growing Season (Days)
220
200
180
160
140
120
100
90
91
92
93
94
95
96
97
98
99
00
01
02
03
04
05
06
07
19
19
19
19
19
19
19
19
19
19
20
20
20
20
20
20
20
20
Richmond Camp Pickett
Figure 7. The growing season trend for Petersburg NB and Richmond NBP from 1990–2007. The
number of days between the last freeze in the spring and the first freeze in the autumn does not show a
distinct trend during the last decade as noted by two climate stations in proximity to the two parks.
13Precipitation Summary
Both January and February were drier than average across the region (Figure 8). March also
brought below average rainfall, but April featured a widespread rainstorm at mid-month caused
by a powerful nor’easter (Table 8). Oddly, there was a significant precipitation event in the
middle of the three months (Feb–Apr) of 2007. Most of these dropped more than an inch
(25.4 mm) on the region.
The warm season of 2007 brought progressively drier conditions (Figure 8) due to greater
evaporation rates. After a damp April, May saw significant rainfall on only a handful of days
(Tables 9 and 10). More routine showers and thunderstorms returned in June, but the scattered
nature of this rain left some sections with a deficit (Figure 8). July was quite dry as
thunderstorms were widely separated. A bout of heavy thunderstorms in mid-August brought
several reports of severe weather (Appendix) and also raised rainfall above the long-term mean
for that month. Then from late August until mid October, rainfall was sparse with no
contribution of moisture from the Tropics. Three long dry spells occurred during this period
(Table 8). In fact, measurable rain occurred on less than 10 days from August 24–October 23.
Rain returned in earnest starting on October 24 and the following three days produced more than
3.0 in (>75 mm) across the region. November saw a return to exceptionally dry weather (in fact,
it was the driest on record in some locations of southern Virginia), but December had near
normal rainfall.
Maps showing percent of average precipitation for each month in the calendar year 2007, as
compared with the normal based on the period 1971–2000, are shown in Figure 8. Departure
values are reported in percent of normal. Maps were created using estimates from the Parameter-
elevation Regressions on Independent Slopes Model (PRISM). PRISM uses an interpolation
scheme for precipitation between actual observations and corrects these estimates for changes in
topography across the region. More information can be found at:
http://www.prism.oregonstate.edu/.
Figure 9 provides the annual precipitation trends and Table 11 summarizes precipitation
indicators for Petersburg NB and Richmond NBP.
Table 8. A comparison of wettest single calendar days during 2007 with the longest periods with a trace
or less of rainfall during the same year in both parks.
Wettest Days in 2007 Dry Spells in 2007
Jan-01: 1.60 in (41 mm) Oct. 6–23
Feb-14: 1.15 in (29 mm) Sept. 16–Oct. 4
Mar-16: 1.61 in (41 mm) Aug. 27–Sep. 10
Apr-15: 2.23 in (57 mm) Feb. 15–24
Jun-30: 1.67 in (43 mm) Mar. 17–28
Aug-16: 3.10 in (79 mm) Mar. 3–14
Oct 24&26: 1.44 in (37 mm) Feb. 2–11
14Petersburg NB and Richmond NBP
Percent of Average Monthly Precipitation
2007 vs. 1971–2000
January February March April
May June July August
September October November December
Figure 8. Maps showing percent of average precipitation for each month in the calendar year 2007 as
compared with the normal based on the period 1971–2000.
15Table 9. Summary of precipitation in 2007 for reporting sites that represent Petersburg NB and Richmond NBP.
Station
Location ID Jan Feb Mar Apr May Jun Jul Aug Sep Oct Nov Dec Annual
b d
76.71 mm 68.07 mm 71.88 mm 80.01 mm 73.41 mm 91.19 mm 28.45 mm 50.29 mm 20.83 mm 89.92 mm 6.60 mm 73.91 mm 832.87 mm
Hanover, VA KOFP
b d
3.02 in 2.68 in 2.83 in 3.15 in 2.89 in 3.59 in 1.12 in 1.98 in 0.82 in 3.54 in 0.26 in 2.91 in 32.79 in
Richmond, 87.12 mm 52.32 mm 63.50 mm 96.01 mm 94.23 mm 131.83 mm 42.93 mm 172.97 mm 28.19 mm 83.06 mm 15.75 mm 71.63 mm 939.55 mm
KRIC
VA 3.43 in 2.06 in 2.50 in 3.78 in 3.71 in 5.19 in 1.69 in 6.81 in 1.11 in 3.27 in 0.62 in 2.82 in 36.99 in
Wakefield, 52.07 mm 46.48 mm 53.34 mm 150.88 mm 82.04 mm 116.33 mm 66.80 mm 180.85 mm 37.85 mm 101.35 mm 16.51 mm 102.11 mm 1006.60 mm
KAKQ
VA 2.05 in 1.83 in 2.10 in 5.94 in 3.23 in 4.58 in 2.63 in 7.12 in 1.49 in 3.99 in 0.65 in 4.02 in 39.63 in
d
Mecklenburg, 48.01 mm 33.02 mm 61.21 mm 79.50 mm 48.01 mm 59.94 mm 30.73 mm 9.14 mm 18.03 mm 72.64 mm 2.29 mm 75.18 mm 537.72 mm
KAVC
VA 1.89 in 1.30 in 2.41 in 3.13 in 1.89 in 2.36 in 1.21 in
d
0.36 in 0.71 in 2.86 in 0.09 in 2.96 in 21.17 in
d
Williamsburg, 37.09 mm 37.85 mm 34.29 mm 78.99 mm 39.88 mm 38.10 mm 86.36 mm 51.31 mm 43.69 mm 72.90 mm 8.89 mm 64.77 mm 568.71 mm
KJGG
VA 1.46 in 1.49 in 1.35 in 3.11 in 1.57 in 1.50 in 3.40 in
d
2.02 in 1.72 in 2.87 in 0.35 in 2.55 in 22.39 in
Petersburg, 25.91 mm 37.85 mm 56.13 mm 76.45 mm 62.99 mm 58.17 mm 41.66 mm 78.99 mm 28.45 mm 88.39 mm 10.41 mm 75.18 mm 640.59 mm
KPTB
VA d
1.32 in
d
1.49 in 2.21 in 3.01c in 2.48 in 2.29 in 1.64 in 3.11 in 1.12 in 3.48 in 0.41 in 2.96 in 25.22 in
Camp 71.88 mm 61.47 mm 79.50 mm 127.00 mm 96.01 mm 66.29 mm 103.63 mm 97.03 mm 25.40 mm 83.31 mm 25.91 mm 119.89 mm 1033.53 mm
CAPV2
Pickett, VA 2.83 in 2.42 in 3.13 in 5.00 in 3.78 in 2.61 in 4.08 in 3.82 in 1.00 in 3.28 in 1.02 in 4.72 in 40.69 in
16
61.72 mm 46.48 mm 66.55 mm 77.22 mm 75.44 mm 76.20 mm 60.76 mm 74.68 mm 23.62 mm 84.58 mm 10.74 mm 124.74 mm 808.13 mm
Emporia, VA EPRV2
2.43 in 1.83 in 2.62 in 3.04 in 2.97 in 3.00 in 2.39 in 2.94 in 0.93 in 3.33 in 0.42 in 4.91 in 31.82 in
a b c d
1 day is missing; 2 days missing; 3 days missing; 4 days missing
Monthly statistics not reported if more than 4 days are missing
Table 10. Summary of 2007 percent of normal precipitation based on 30-year normal (1971–2000) for reporting sites that represent Petersburg
NB and Richmond NBP.
Station Location ID Jan Feb Mar Apr May Jun Jul Aug Sep Oct Nov Dec Annual
Hanover, VA KOFP 85 90 69 99 73 101 24 47 21 98 8 93 74
Petersburg, VA KPTB 37 50 54 95 63 65 35 74 28 97 13 95 57
Richmond, VA KRIC 97 69 61 119 94 147 36 162 28 91 20 90 84
Williamsburg, VA KJGG 35 43 29 95 35 44 64 40 35 80 10 76 46
Camp Pickett, VA CAPV2 66 75 73 137 92 68 93 91 24 83 31 148 87
Emporia, VA EPRV2 61 58 63 91 77 91 53 68 22 96 14 161 7280
70
60
Precipitation (in)
50
40
30
20
10
0
1979 1983 1987 1991 1995 1999 2003 2007
NARR Data Camp Pickett Data Clim Div 2 Linear (Clim Div 2)
Figure 9. Annual precipitation trends for Petersburg NB and Richmond NBP from 1979–2007. The red
line tracks the Climate Division data (Div #2 in Virginia) which represents an aggregate of more than 10
sites near the parks. The dark blue line marks the trend of a grid box around PETE/RICH from a North
American Reanalysis data set. The light blue line shows the annual precipitation for a nearby single
weather station, at Camp Pickett, VA. The 30-year trend shows an increase of nearly 7% (about ~3 in or
70 mm) since 1979.
Table 11. Status of 2007 precipitation indicators compared to the 30-year normal (1971–2000) at the
Richmond station. The values in 2007 showed below normal annual rainfall and snowfall. Several long
dry spells were also noted.
Richmond, VA
Richmond, VA (KRIC)
(KRIC) 30-year normal
Precipitation Indicators 2007 1971–2000
Annual Precipitation 37.9 43.91
Annual Snowfall 1.3 12.4
Micro-drought (strings of 7+ days without rain) 9 -
Heavy Rain (days with ≥ 1.0 in / 25 mm rain) 10 11.5
Extreme Rain (days with ≥ 2.0 in / 51 mm rain) 3 -
Snow (days with ≥ 0.1 in / 0.3 cm snow) 2 -
Number of days with thunderstorms 27 -
17Stream Flow
The USGS maintains river level and flow monitoring gauges along the James River. Of course,
there is a response time between rainfall, snow-melt, and changes in the river conditions. There
is also seasonality to the river flow with peak flows typically occurring in the spring and
minimum flow being measured in the autumn. However, increases in precipitation amount and
intensity during the past several decades have overridden some of this seasonality. Two gauges
were selected to profile the river level and flow during the calendar year 2007 (Figures 10 and
11). Mid-month rainy spells show as regular spikes during the first half of 2007. The very dry
November is noted by the very low flow rates
Figure 10. Discharge data for gage at James River near Richmond, VA.
Figure 11. Discharge data for gage at James River near Cartersville, VA.
18Drought Status
The U.S. Drought Monitor (USDM; http://www.drought.unl.edu/dm/monitor.html) tracks
drought conditions across the nation on a weekly basis, and it incorporates data and expert input
from a wide variety of state and federal agencies. The USDM is designed to represent a “broad
brush,” regional perspective on drought, and therefore provides an ideal tool for tracking
generalized drought conditions across Southeastern Virginia parks and surrounding areas.
According to the USDM, by the middle of April 2007, the Palmer Drought Severity Index
(PDSI) began a steady drop from abnormally dry (~-1) to drought conditions (~-3) by late
summer (Figure 12). These conditions persisted into the autumn. When compared with the past
few years, 2007 was drier than either of those years and seems to have come under the influence
of an extension of the longer-term Southeast U.S. drought. Since the PDSI responds to long-term
effects, including evaporation, there is usually a lag between both long dry spells and episodes of
heavy rain and changes in the index value. Comparative data is illustrated for Virginia (Figure
13) and the Southeast (Figure 14).
P alme r Drought S eve rity Inde x f or VA Clima te Division 2
5
4
Palmer Drought Sever ity Index
3
2
1
0
-1
-2
-3
-4
ry
r
il
r
e
y
y
st
r
ch
er
ay
be
be
be
ar
pr
n
l
ua
Ju
ob
u
Ju
ar
M
nu
m
em
em
A
ug
br
ct
M
te
Ja
A
ov
ec
O
Fe
ep
N
D
S
2005 2006 2007
Figure 12. A comparison of the Palmer Drought Severity Index (PDSI) for the Virginia Climate Division 2
encompassing most of Petersburg NB and Richmond NBP from 2005–2007. The PDSI during 2007 was
similar in dryness to 2005.
19Drought Severity in Virginia during 2007
May June July
August September October
D0 Abnormally Dry D1 Drought - Moderate D2 Drought - Severe D3 Drought - Extreme D4 Drought - Exceptional
Figure 13. The mid-month values of the Palmer Drought Severity Index for Virginia in 2007 showing that
dry conditions encroached on Petersburg NB and Richmond NBP.
20Drought Severity for the Southeast during 2007
May June July
August September October
D0 Abnormally Dry D1 Drought - Moderate D2 Drought - Severe D3 Drought - Extreme D4 Drought - Exceptional
Figure 14. The mid-month values of the Palmer Drought Severity Index for the Southeast during the 2007
warm season.
21Global and National Summary
Warmer-than-average temperatures occurred throughout 2007 in most land areas of the world,
with the exception of cooler-than-average anomalies in the southern parts of South America
(Figure 15). The largest warmer-than-average anomalies were present throughout high latitude
regions of the Northern Hemisphere including much of North America, Europe, and Asia.
Annual temperature anomalies in these regions ranged from 3.6–7.2°F (2–4°C) above the 1961–
1990 average.
Notable temperature extremes in 2007 included a heat wave that affected a large portion of the
United States throughout the month of August. The Central and Southeastern U.S. were
particularly affected, with over 50 deaths attributed to soaring high temperatures. The anomalous
warmth exacerbated drought conditions in the Southeastern region and also contributed for 29
all-time record high maximum temperatures and 35 all-time record high minimum temperatures.
In April, a devastating cold wave affected much of the central Plains, Midwest, and the Southeast
region of the contiguous U.S. Temperatures dipped well below freezing in many areas prompting
nearly 1,240 broken daily minimum temperature records and producing significant crop
damages.
Annual Land Temperature Anomalies in degrees C Annual Blended Land and Sea Temperature Anomalies in
degrees C
Figure 15. Global temperature anomalies for 2007 with respect to a 1961–1990 base period. The map on
left is created using data from the Global Historical Climatology Network (GHCN), a network of more than
7,000 land surface observing stations. The map on right is a product of a merged land surface and sea
surface temperature anomaly analysis developed by Smith and Reynolds (2005). Temperature anomalies
with respect to the 1961–1990 mean for land and ocean are analyzed separately and then merged to
form the global analysis.
22Snow cover for the boreal winter 2007 across North America was above average and was the
13th largest extent over the 41-year historical record (Figure 16). This was in part due to a series
of snow and ice storms that struck the U.S. during the month of February. Average North
America boreal winter snow cover extent is 17.0 million square kilometers for the 1967–2007
period of record.
Mean Northern Hemisphere snow cover extent during boreal spring (March–May) 2007 was
below average (Figure 17). Much of this was due to anomalously warm conditions across Asia,
Europe, and most of the contiguous U.S. Spring 2007 snow cover extent on the Northern
Hemisphere was the third lowest extent on record. Mean Northern Hemisphere spring snow
cover extent for the 1997–2007 period of record is 92.6 million square kilometers.
Figure 16. North American snow cover anomalies for 1967–2007 winters (Dec.–Feb.).
23Figure 17. Northern Hemisphere snow cover anomalies for 1967–2007 spring (March–May).
Based on data through the end of the year, 2007 was the tenth warmest year on record for the
U.S., with a nationally averaged temperature of 54.2°F (12.4°C). This value is 1.4°F (0.8°C)
above the 20th century (1901–2000) mean.
Much warmer-than-average temperatures affected much of the mountain west and parts of the
east during 2007. This was the tenth warmest January–December in the 113-year record. Both
Kentucky and Tennessee had the fourth warmest years on record. Forty-three of the lower 48
states were either warmer or much warmer than average in 2007. Maine alone ranked below
average during the 2007 year-to-date period. The anomalous warmth affecting the U.S. in 2007
is also reflected in temperatures in the lower troposphere. Data collected by NOAA's TIROS-N
polar-orbiting satellites and adjusted for time-dependent biases by NASA and the Global
Hydrology and Climate Center at the University of Alabama in Huntsville indicate that
temperatures in the lower half of the atmosphere (lowest 8 km of the atmosphere) over the U.S.
were warmer than the 20-year (1979–1998) average for the tenth consecutive year.
Precipitation in the United States during 2007 was variable throughout much of the country with
periods of excessive rainfall, especially across the central third of the U.S., and persistent and
developing drought in the southeastern quarter of the country and the far western states. Winter
was relatively wet in the South and North Central regions and relatively dry in the West and
Southeast (Figures 19 and 20). In the spring, it was the driest March–May on record in the
Southeast.
24The West was ranked sixth driest and the West North Central region had its third wettest spring
on record. In summer, the remnants of Tropical Storm Erin brought excessive rain to Texas,
Oklahoma, and Kansas, giving the South its wettest summer on record. Meanwhile, much of the
Southeast continued to suffer in drought with its eleventh driest summer on record, following the
driest spring.
Precipitation across the U.S. during the fall ranked 37th driest, although no regions ranked much
above or much below normal. For the contiguous U.S. as a whole, seven months in 2007 were
drier than average. The annual temperature trend for the nation based on the historical climate
network (USHCN) shows that 2007 was down slightly from 2006, but still ranked as tied for the
sixth warmest year in the past century.
Figure 18. The long-term annual temperature trend for the United States based on the Historical Climate
Network (HCN) which is a subset of the Cooperative Network of Weather Observers.
25Figure 19. Palmer Drought Severity Index for January 2, 2007. The majority of the Plains were
experiencing abnormally dry to moderate drought conditions.
D0-Abnormally Dry D1 Drought -Moderate D2 Drought -Severe D3 Drought -Extreme D4 Drought -Exceptional
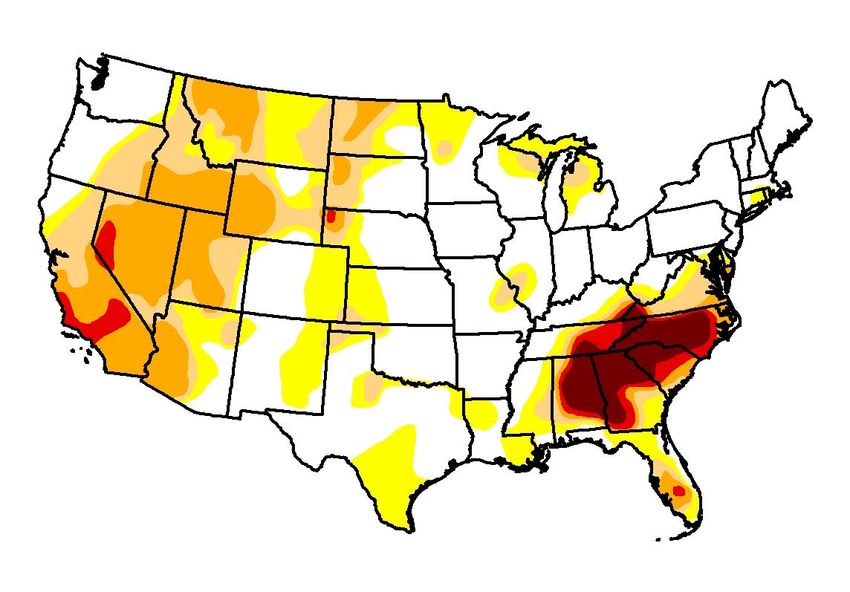
Figure 20. Palmer Drought Severity Index for December 25, 2007. The center of intensely dry weather
had settled into the Southeast United States.
26Selected References
Davey, C. A., K. T. Redmond, and D. B. Simeral. 2006. Weather and Climate Inventory,
National Park Service, Mid-Atlantic Network. Natural Resource Technical Report
NPS/MIDN/NRTR—2006/013. National Park Service, Fort Collins, Colorado.
Knight, P., T. Wisniewski, C. Bahrmann, and S. Miller. In preparation. Weather and Climate
Monitoring Protocol for the Eastern Rivers and Mountains and Mid-Atlantic Networks.
Natural Resource Technical Report NPS/MIDN/NRTR—2010/XXX. National Park Service,
Fort Collins, CO.
National Oceanic and Atmospheric Administration (NOAA). 2007. National Climatic Data
Center. Climate of 2007 – Annual Review, Global and U.S. Summary,
http://lwf.ncdc.noaa.gov/oa/climate/research/2007/ann/us-summary.html.
Smith, T. M. and Reynolds, R. W. 2005 A Global Merged Land—Air—Sea Surface
Temperature Reconstruction Based on Historical Observations (1880-1997). Journal of
Climate, 18, 2021-2036.
27Appendix
The following tables are a tally of all reports of severe weather during 2007 in the counties that
encompass Petersburg National Battlefield and Richmond National Battlefield Park. These storm
events were provided by the National Climatic Data Center (NCDC). NCDC receives this storm
data from the National Weather Service, who acquires their information from a variety of
sources. These sources include but are not limited to: county, state and federal emergency
management officials, local law enforcement officials, skywarn spotters, NWS damage surveys,
newspaper clipping services, the insurance industry and the general public. This Storm Data is an
official publication of the National Oceanic and Atmospheric Administration (NOAA 2007)
which documents the occurrence of storms and other significant weather phenomena having
sufficient intensity to cause loss of life, injuries, significant property damage, and/or disruption
to commerce. Each table contains the location, date, time, and description of the severe event, its
magnitude, and number of deaths and injuries, and property/crop damage associated with the
event. The property and crop damage should be considered as a broad estimate.
29Petersburg City County
Location or County Date Time Type Mag Dth Inj PrD CrD
1 Petersburg 06/28/2007 19:10 PM Thunderstorm Wind 50 kts. 0 0 2K 0K
2 Petersburg 07/19/2007 15:00 PM Thunderstorm Wind 50 kts. 0 0 1K 0K
3 Petersburg 10/24/2007 12:00 PM Heavy Rain N/A 0 0 0K 0K
TOTALS: 0 0 3K 0
Mag: Magnitude; Dth: Deaths; Inj: Injuries; PrD: Property Damage; CrD: Crop Damage.
Nottoway County
Location or County Date Time Type Mag Dth Inj PrD CrD
1 Burkeville 06/11/2007 15:50 PM Thunderstorm Wind 50 kts. 0 0 1K 0K
2 Jennings Ordinary 08/21/2007 16:10 PM Thunderstorm Wind 50 kts. 0 0 1K 0K
3 Crewe 10/24/2007 12:00 PM Heavy Rain N/A 0 0 0K 0K
TOTALS: 0 0 2K 0
Mag: Magnitude; Dth: Deaths; Inj: Injuries; PrD: Property Damage; CrD: Crop Damage.
31
Meclenburg County
Location or County Date Time Type Mag Dth Inj PrD CrD
1 Clarksville 06/04/2007 21:00 PM Thunderstorm Wind 50 kts. 0 0 2K 0K
2 South Hill 10/24/2007 12:00 PM Heavy Rain N/A 0 0 0K 0K
TOTALS: 0 0 2K 0
Mag: Magnitude; Dth: Deaths; Inj: Injuries; PrD: Property Damage; CrD: Crop Damage.James City County
Location or County Date Time Type Mag Dth Inj PrD CrD
1 VAZ049 - 064 - 072 - 076>078 - 084>085 - 090 - 099 04/07/2007 03:00 AM Heavy Snow N/A 0 0 0K 0K
2 VAZ049 - 064 - 072 - 076>078 - 084>085 - 090 - 099 04/07/2007 03:00 AM Winter Weather N/A 0 0 0K 0K
3 Five Forks 06/29/2007 19:02 PM Hail 1.00 in. 0 0 0K 0K
4 Grove 06/29/2007 19:05 PM Thunderstorm Wind 50 kts. 0 0 10K 0K
5 Grove 06/29/2007 19:15 PM Hail 1.00 in. 0 0 0K 250K
6 Five Forks 06/29/2007 19:30 PM Thunderstorm Wind 60 kts. 0 0 1.0M 0K
7 Toano 07/11/2007 17:45 PM Thunderstorm Wind 50 kts. 0 0 1K 0K
8 Jamestown 07/19/2007 15:35 PM Thunderstorm Wind 50 kts. 0 0 5K 0K
9 Toano 07/19/2007 15:40 PM Thunderstorm Wind 50 kts. 0 0 1K 0K
10 Norge 08/05/2007 16:50 PM Thunderstorm Wind 50 kts. 0 0 2K 0K
11 Jamestown 10/24/2007 12:00 PM Heavy Rain N/A 0 0 0K 0K
TOTALS: 0 0 1.019M 250K
Mag: Magnitude; Dth: Deaths; Inj: Injuries; PrD: Property Damage; CrD: Crop Damage.
Greensville County
32
Location or County Date Time Type Mag Dth Inj PrD CrD
1 Purdy 10/24/2007 12:00 PM Heavy Rain N/A 0 0 0K 0K
TOTALS: 0 0 0 0
Mag: Magnitude; Dth: Deaths; Inj: Injuries; PrD: Property Damage; CrD: Crop Damage.You can also read


