Discrete shedding of secondary vortices along a modified Kaden spiral
←
→
Page content transcription
If your browser does not render page correctly, please read the page content below
This draft was prepared using the LaTeX style file belonging to the Journal of Fluid Mechanics   1

                                                         Discrete shedding of secondary vortices
arXiv:2010.01389v2 [physics.flu-dyn] 29 Jan 2021

                                                             along a modified Kaden spiral
                                                                        Diego Francescangeli, Karen Mulleners∗
                                                    Institute of Mechanical Engineering, École polytechnique fédérale de Lausanne, Switzerland
                                                                         ∗
                                                                           Corresponding author: karen.mulleners@epfl.ch

                                                                                 (Received xx; revised xx; accepted xx)

                                                   Abstract
                                                   When an object is accelerated in a fluid, a primary vortex is formed through the roll-
                                                   up of a shear layer. This primary vortex does not grow indefinitely and will reach a
                                                   limiting size and strength. Additional vorticity beyond the critical limit will end up in
                                                   a trailing shear layer and accumulate into secondary vortices. The secondary vortices
                                                   are typically considerably smaller than the primary vortex. In this paper, we focus on
                                                   the formation, shedding, and trajectory of secondary vortices generated by a rotating
                                                   rectangular plate in a quiescent fluid using time-resolved particle image velocimetry. The
                                                   Reynolds number Re based on the maximum rotational velocity of the plate and the
                                                   distance between the centre of rotation and the tip of the plate is varied from 840 to
                                                   11 150. At low Re, the shear layer is a continuous uninterrupted layer of vorticity that
                                                   rolls up into a single coherent primary vortex. At Re = 1955, the shear layer becomes
                                                   unstable and secondary vortices emerge and subsequently move away from the tip of the
                                                   plate. For Re > 4000, secondary vortices are discretely released from the plate tip and
                                                   are not generated from the stretching of an unstable shear layer. First, we demonstrate
                                                   that the roll-up of the shear layer, the trajectory of the primary vortex, and the path of
                                                   secondary vortices can be predicted by a modified Kaden spiral for the entire Re range
                                                   considered. Second, the timing of the secondary vortex shedding is analysed using the
                                                   swirling strength criterion. The separation time of each secondary vortex is identified
                                                   as a local maximum in the temporal evolution of the average swirling strength close to
                                                   the plate tip. The time interval between the release of successive secondary vortices is
                                                   not constant during the rotation but increases the more vortices have been shed. The
                                                   shedding time interval also increases with decreasing Reynolds number. The increased
                                                   time interval under both conditions is due to a reduced circulation feeding rate.

                                                   1. Introduction
                                                   The life of vortices around bluff bodies often begins with a shear layer (Fernando et al.
                                                   2017; Jeon & Gharib 2004; Rosi & Rival 2017; Fernando & Rival 2016; Corkery et al.
                                                   2019). When a bluff body moves relative to a fluid flow, a thin layer of fluid emerges at
                                                   the edge of the body where non-zero shear flow gradients are present. This shear layer
                                                   is characterised by increased values of the flow vorticity. In the wake of the body, the
                                                   shear layer rolls-up and the shear layer vorticity accumulates into a coherent vortex.
                                                   The interplay between the free stream or body’s velocity and the induced velocity of the
                                                   growing coherent vortex cause the shear layer to become curved. This curvature changes
                                                   continuously in time. The roll-up of a semi-infinite shear layer or vortex sheet was first
                                                   described by Kaden (1931), who derived the following self-similar equation to describe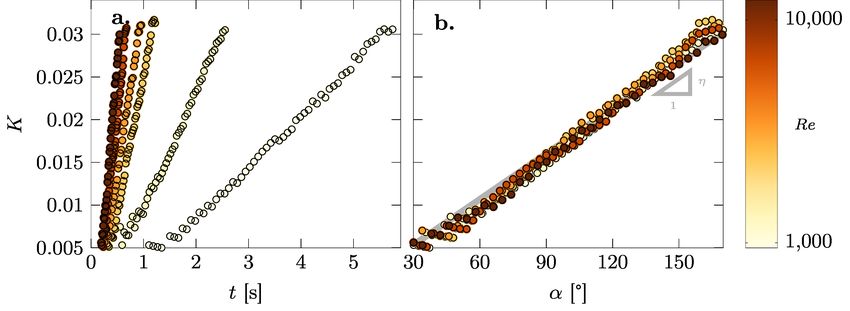
2
the shear layer shape at any point in time t:
                                       r = K(t/θ)2/3                                    (1.1)
where K is a dimensional constant, and r and θ are the radial and angular coordinates
along the spiral with r = 0, θ → ∞ at the spiral centre, r → ∞, θ → 0 at the opposite end
of the semi-sheet at infinity. The exponent 2/3 is retrieved from dimensional analysis and
the obtained curve is a spiral with tight inner turns. The initial strength of the flat sheet
increases monotonically with increasing distance away from the tip of the body. For t > 0,
the spiral has an infinite number of turns leading to a singularity of the velocity and the
sheet strength decreases to zero for θ → ∞ in the spiral centre. The maximum value of
the sheet strength is now located somewhere along the sheet (Saffman 1995). In reality,
viscosity will remove any singularity at the spiral centre and yield the development of a
viscous core (Moore et al. 1973).
At the early stages of the roll-up, Kaden’s spiral is tight with a low local radius of
curvature. It accurately represents the initial evolution of the shear layer. At later stages,
the radius of curvature increases due to the viscous interactions within the shear layer
and between the shear layer and the coherent primary vortex that grows due to the
continuous accumulation of vorticity at the centre of the spiral. The distortions can be
investigated by modelling the inner portion of the spiral as a single point vortex located
at the centre (Moore 1974). The entire shear layer roll-up can also be predicted by a
point-vortex representation of an initially straight vortex sheet (Krasny 1987; DeVoria
& Mohseni 2018). The degree of the elliptical distortions depends on the shape of the
object. They are almost negligible for flat plates and become more pronounced when the
edge has a non-zero wedge angle (Pullin 1978).
The accumulation of the vorticity in the coherent vortex in the spiral centre does not
continue indefinitely. There is a physical limit to the size and the amount of circulation
the primary vortex can collect (Gharib et al. 1998; Mohseni & Gharib 1998; Gao &
Yu 2010; de Guyon & Mulleners 2021). When the primary vortex is about to pinch-
off, a trailing pressure maximum is observed along the shear layer (Lawson & Dawson
2013). The shear layer region between the tip and the trailing pressure maximum has
an adverse pressure gradient. The remaining portion of the shear layer is characterised
by a positive pressure gradient. The two regions of the shear layer are now separated
and the vorticity associated with the adverse pressure gradient can not be entrained into
the vortex core. The trailing pressure maximum travels downstream together with the
primary vortex, causing the subsequent pinch-off of the primary vortex (Schlueter-Kuck
& Dabiri 2016). Additional vorticity will not be entrained by the primary vortex after
pinch-off and instead can accumulate into smaller secondary vortices within the trailing
shear layer similar to a Kelvin-Helmholtz instability (Dabiri 2009). The increases in shear
layer curvature during the initial stages of the vortex formation momentarily stops when
the end of the primary vortex growth is reached (Sattari et al. 2012). Secondary vortices
occur first between the primary vortex and the tip at locations where the sheet strength
according to Kaden is maximal (Moore 1974; Koumoutsakos & Shiels 1996).
The emergence of secondary vortices seem to occur only if the Reynolds number is above
a critical threshold. The value of this critical Reynolds number varies for different object
geometries and boundary conditions. Critical values in a range from Re =1000 to 3000
were observed in a cylinder wake by Wu et al. (1996). The lower limit was slightly higher
for Bloor (1964), who did not detect any instabilities for Re < 1300. The span-wise and
end configurations strongly affect the shear layer breaking behind a cylinder. Parallel and
oblique vortex shedding are obtained by changing the inclination of end plates (Prasad
& Williamson 1997). The shear layer manifests instabilities at Re = 1200 for parallel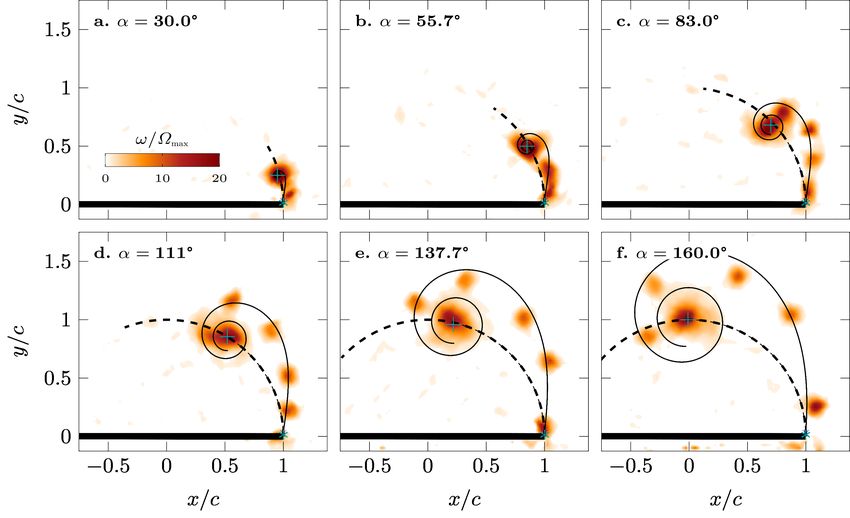
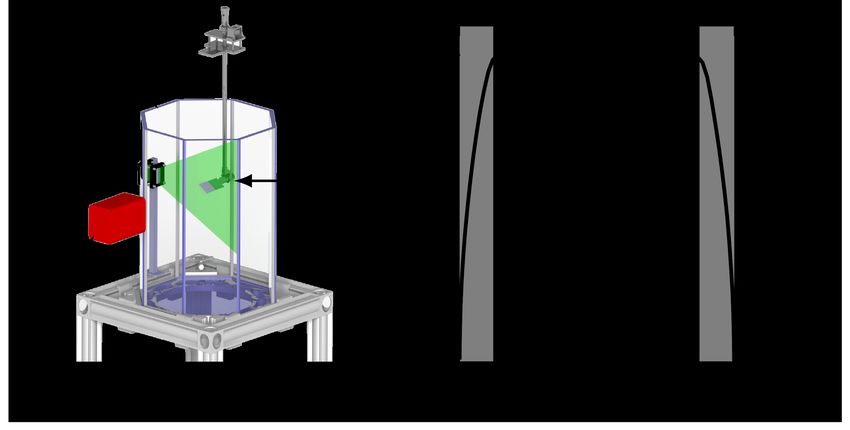
3
shedding and at Re = 2600 for oblique shedding. The critical Reynolds number for an
accelerated sharp edged plate lies in a higher range. Pullin & Perry (1980); Williamson
(1996) started to visually observed secondary vortices along the shear layer for Re = 4268.
This value was later confirmed by Luchini & Tognaccini (2002), who numerically observed
the occurrence of secondary vortices in a range from Re = 4500 to 5000.
For Reynolds numbers above the critical value, series of secondary vortices appear in
the trailing shear layer with a seemingly constant distance between them. The typical
shear layer frequency in the wakes of cylinders is much higher than the frequency of
the von Karman vortex street. A consensus about the exact relationship between the
frequency of the primary vortex shedding fK and the secondary of shear layer vortices fSL
has not yet been found. Bloor (1964) observed that the ratio between the characteristic
frequencies varies with Reynolds number according to fK /fSL = Re 1/2 . However, there is
no consensus about the exponent value of the proposed relationship. Prasad & Williamson
(1997) indicated that an exponent value of 0.67 works for Re up to 105 and Wei & Smith
(1986) found 0.87 in the range from Re = 1200 to 11 000. No clear relationships are
established in the situation of an isolated primary vortex. Based on the flow visualisation
around a submerged flat plate, Grift et al. (2019) determined the shedding frequency
of secondary vortices to lie in the range from 13 Hz to 20 Hz, for different values of
acceleration, velocity, and immersion depth. This range corresponds to a Strouhal number
around 0.2, according to the plate geometry and kinematics used by the authors. The
secondary vortex shedding frequency behind a vertical flat plate increases with increasing
acceleration of the flat plate according to Rosi & Rival (2017). It is crucial to define a
scaling parameter, such as the Strouhal frequency for the cylinder case, that allows for a
more universal relationship between the shedding frequency or formation time of primary
and secondary vortices as a function of the Reynolds number.
Here, we present an experimental study of secondary vortices generated by a rotating flat
plate in a quiescent fluid. The experimental setup is discussed in details in the following
section and is similar to the configurations used by David et al. (2018); Corkery et al.
(2019); Carr et al. (2015). The plate is rotated with a constant rotational velocity which
is varied across different experiments. The rotation of the plate generates a start up or
a primary vortex. As the plate keeps rotating, the primary vortex separates and smaller
secondary vortices are observed. First, we determine the critical Reynolds number above
which secondary vortices are observed in the shear layer behind the tip of the rotating
plate. Second, we describe the path of secondary vortices and model their path using a
modified Kaden spiral. Finally, we estimate the timing of the secondary vortex shedding
process and analyse the effect of the Reynolds number on the timing.

2. Experimental methods
The first series of measurements is conducted with a rectangular flat glass plate, with
length l = 8 cm, width or span s = 16 cm and thickness t = 2 mm that is rotated about
180° in a water tank around its centre span-wise axis. The distance between the centre of
rotation and the tip of the plate is referred to as the chord length c here. The length of
the plate is reduced to l = 4 cm and the rotation point is shifted to the edge of the plate
for the second set of measurements. The chord length or distance between the rotational
point and the tip of the plate is preserved for both sets of experiments. For the first set
of experiments, vortices are formed symmetrically behind both ends of the plate. For the
second set of experiments, vortices are formed only on one end of the plate. This allows us
to study the influence of the rotation point and detect potential interferences caused by
symmetric vortex release on both tips when the rotation point is at mid-length. A third
4

Figure 1. (a) Schematic of the experimental set-up and the rotation mechanism. (b)
Trapezoidal velocity profile as a function of the angular position. The grey shaded regions
indicate the portion of the motion during which the plate is accelerated.

set of measurements with a longer plate with length l = 12 cm and the rotation point at
mid-length, yielding a chord length of c = 6 cm, was conducted to provide insight into the
influence of the chord length on the vortex formation. The glass plate is stiff enough to
not bend due to the interaction with water and its transparency prevents shadow regions
when performing particle image velocimetry (PIV). The experiments are conducted in
an octagonal tank with an outer diameter of 0.75 m filled with water (Figure 1a).
The rotation mechanism is fastened to an outer aluminium frame such that the mid span
of the plate is in the centre of the tank to limit wall interference effects. The kinematic
input is given by a servo motor (Maxon RE 35) connected to a stainless steel shaft and
transferred to the flat plate through a 1 : 1 conical coupling. A 1 : 19 gearbox is mounted
on the motor to ensure high torque, speed, and acceleration. The rotational angle, speed,
and acceleration are controlled via a Galil DMC-40 motion controller, which allows for
accurate control of arbitrary motion profiles. The rotation programme is a trapezoidal
rotational velocity profile with a fixed rotational amplitude of 180° (Figure 1b).
To ensure a continuous acceleration profile, the corners of the velocity trapezoid are
smoothed. The maximum rotational speed Ωmax is varied from 30 °/s to 400 °/s. This
leads to a Reynolds number Re = (Ωmax c2 )/ν based on the chord, which is defined as the
distance between the rotation point and the tip of the plate, ranging from 840 to 11 150.
The rotational acceleration Ω̇ is fixed at 6000 °/s2 .
The PIV images are recorded in the cross-sectional plane at the model mid span. A
high-power pulsed light-emitting diode (LED Pulsed System, ILA 5150 GmbH) is used
to create a light sheet in the measurement plane. The applicability of high-power LED
for PIV has been demonstrated previously by Willert et al. (2010); Krishna et al. (2018).
Time-resolved PIV images are recorded with a Photron FASTCAM SA-X2 high speed
camera. The camera is equipped with a 35 mm Canon lens and the camera is aligned
carefully such that the optical axis of the lens is aligned with the rotational axis of the
plate and is perpendicular to the light sheet (Figure 1a). The frame rate and the exposure
time are varied, depending on the dynamics of the motion. A frame rate and exposure
time of 250 Hz and 1 ms are selected for a rotational speed of 30 °/s. These values are
2000 Hz and 0.5 ms for the highest tested speeds. The frame rate is high enough to
capture the dynamics of the motion and the LED is set to continuous mode. The camera
resolution is 1024 px × 1024 px, which corresponds to a field of view of 20 cm × 20 cm.
The raw data are processed by the commercial software PIVview (PIVTEC GmbH, ILA
5150 GmbH) using a correlation model based on minimum squared differences and a
5
multi-pass interrogation algorithm with three iterations. The final interrogation window
size is 32 px × 32 px with an overlap of 68 %. A third order B-spline interpolation method
for sub-pixel image shifting is performed on all passes. The resulting physical resolution
is 1 mm or 0.025c.
3. Results
3.1. Modelling the shear layer roll-up
At Re = 840, the plate rotation gives rise to the formation of a primary vortex (Figure 2).
The vorticity fields at different angular positions are shown in the plate’s frame of
reference. The primary vortex is the only coherent structure that can be observed and it
is connected to the plate tip through a continuous shear layer. No sign of instabilities are
observed in the shear layer as the plate continues the rotation. The shear layer remains
connected to the primary vortex and rolls-up around its core. As a consequence, the shear
layer roll-ups into a spiral that continuously grows in time.
To trace the spiralling topology of the shear layer in the individual snapshots, we start
by fitting the Kaden spiral (Equation (1.1)) to the experimental data. At every time
instant, the Kaden parameter K is determined such that the spiral passes through the
plate’s edge when the spiral centre is shifted to the instantaneous location of the primary
vortex core. The location of the primary vortex core was retrieved using the Γ2 criterion by
Graftieaux et al. (2001). The resulting Kaden spirals are presented in Figure 3 atop three
instantaneous vorticity snapshots after a rotation of α = 105° for increasing values of the
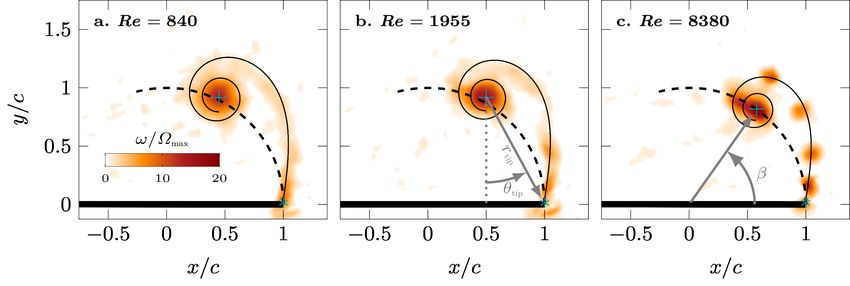
Reynolds number: Re = 840, 1955, 8380. The dashed lines in Figure 3 indicate the plate
tip trajectory since the start of the motion, the markers indicate the centre location of the
primary vortex, and the solid lines are the fitted Kaden spirals. For all three Reynolds
numbers, the centre of the primary vortex is located on the plate tip trajectory and
the fitted spirals match the rolling up shear layer well based on visual inspection. The
vorticity concentration along the shear layer evolves with increasing Reynolds number
from a continuous band of vorticity at Re = 840 (Figure 3a) to an alignment of vorticity
lumped into discrete vortices at Re = 8380 (Figure 3c). At the intermediate Reynolds
number Re = 1955, the shear layer is undulating and some localised concentrations of
high vorticity can be identified along it (Figure 3b). These are signs of an unstable shear
layer. When we further increase the Reynolds number to 8380, the shear layer instability
becomes more prominent. The primary vortex is no longer connected to the plate tip and
the shear layer is broken into a series of distinct individual structures that we refer to as
secondary vortices (Figure 3c). The fit of Kaden’s spiral still describes well the unstable
shear layer evolution and goes through the secondary vortices for the entire range of
Reynolds numbers considered here.
So far, we have merely fitted Equation (1.1) to our experimental data at every time
instant, treating Kaden’s constant K as a fitting parameter. We observe that the main
topology of the roll up is well captured by the Kaden spiral, but we have not yet gained
any insight into the temporal evolution of the roll up or the motion of the primary
vortex. If our shear layer would follow the time evolution predicted by Kaden’s spiral,
the obtained values for K should be constant for all time instants. Based on the results
presented in Figure 4, we conclude that K is not a constant value for our data but
increases linearly in time for all Reynolds numbers. The rate of increase of K with
dimensional time decreases with increasing Re (Figure 4a), but all curves collapse when
presented in terms of the angular position of the plate (Figure 4b). The angular position
of the plate serves as the dimensionless time variable. It corresponds to the ratio between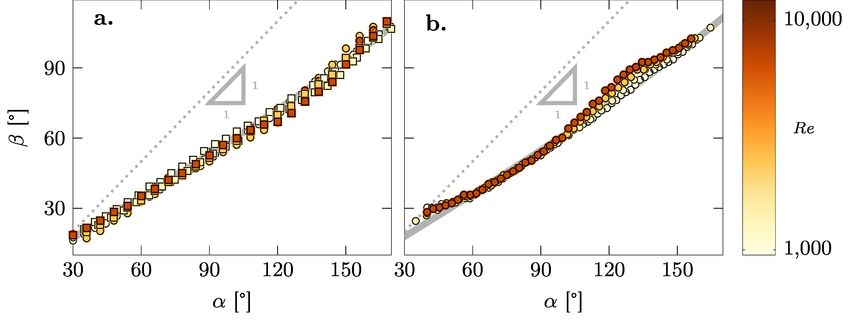
6

    Figure 2. Vorticity fields for different angular positions (a) α = 50°, (b) α = 86°, and
       (c) α = 122° for Re = 840. The dashed line represents the plate tip trajectory.

Figure 3. Fit of the Kaden’s spiral (black solid curve) atop of instantaneous vorticity fields
at α = 105° for (a) Re = 840, (b) Re = 1955, and (c) Re = 8380. The marker ∗ indicates the
top right edge of the plate and the point where the spiral ends, + indicates the centre of the
primary vortex and the point where the spiral begins. The spiral is only plotted for θ ranging
from θtip to 4π. The dashed line represents the plate tip trajectory.

the travelled arc length l = Ωtc and the chord length and represents a convective time
scale. The chord length refers to the length between the centre of rotation and the tip of
the plate.
Based on these results, we propose here a modified version of the Kaden spiral to describe
and predict the temporal evolution of the shear layer roll up:
                                             2/3
                                              α
                                     r = ηα         ,                                (3.1)
                                              θ
where r and θ are again the radial and angular coordinates of the spiral with respect
to the spiral centre or primary vortex centre, α is the angular position of the plate and
ηα replaces the dimensional constant K in Kaden’s formulation (Equation (1.1)). The
value of η is constant for all Re and is empirically determined based on the ensemble
of experimental data to η = 1.02 × 10⁻² . The original solution of the Kaden spiral was
derived for an unbound semi-infinite vortex sheet that starts out as a straight vortex
sheet Kaden (1931). The open end of the sheet rolls up into a vortex with the centre
at (r, θ) = (0, ∞) and the other side of the vortex sheet is at infinity (r, θ) = (∞, 0).
For our experimental conditions, the vortex sheet length is finite and its length increases
in time. The open end rolls up into a primary vortex. The bound end of the vortex
sheet is attached to the tip of the rotating plate and only the portion of the modified
Kaden spiral for θ ∈ [θtip , ∞] corresponds to our finite shear layer. Here, θtip decreases in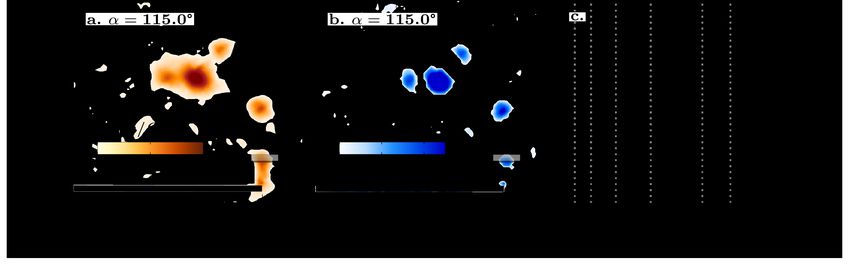
7

Figure 4. K parameter of Kaden’s equation as a function of (a) time and (b) angular position
                    of the plate for all the tested Reynolds numbers.

time and indicates the bound end that is connected to the plate tip. The value of θtip is
determined at every time step based solely on the observation that the primary vortex
moves along a path that matches the plate tip trajectory as indicated in Figure 2 by the
dashed line. Based on this purely geometric constraint, we also directly obtain the radial
spiral coordinate where the modified Kaden spiral meets the plate tip, indicated by rtip ,
and the angular location of the primary vortex with respect to the plate, denoted by β.
The detailed derivation of θtip , rtip , and β is provided in appendix A. With this additional
information, we can now write the spatial coordinates of the spiral in the plate’s frame
of reference as:
                                 xspiral = r sin θ + c cos β                            (3.2)
                                 yspiral = −r cos θ + c cos β,                          (3.3)
with θ and β defined as indicated in Figure 3. This modified version of the Kaden spiral
is now a fully predictive model of the shear layer roll-up and the position of the primary
vortex core with a single empirical constant η.

                                3.2. Validation of the model
The ability of our modified Kaden spiral to describe the roll-up of the shear layer
is visually compared to the negative finite time Lyapunov exponent (nFTLE) fields
corresponding to the vorticity fields presented in Figure 3a-c. The FTLE is a local
measure of Lagrangian stretching of evolving fluid particle trajectories Haller (2001,
2015). The maximising ridges of the negative FTLE field indicate regions along which
nearby fluid particles are attracted such as the boundaries of coherent structures. The
FTLE ridges provide insight into the location and growth of vortices and the flow topology
Green et al. (2007); Rockwood et al. (2018).
At Re = 840 the shear layer is continuous and the attracting nFTLE ridges appears
as a continuous spiral. The shape and the roll-up of the spiral is well described by our
predictive model (Figure 5a). At Re = 1955, we are in a transitional regime where the
shear layer is wavy and unstable (Figure 3b). This observation is confirmed by the FTLE
ridges, where the attracting nFTLE ridge oscillates around our predicted spiral. The
deviations become larger where the spiral rolls-up (Figure 5b). Finally, at Re = 8380
the shear layer is no longer visible in the vorticity field snapshot and we observe discrete
secondary vortices instead (Figure 3c). The wavelength of the nFTLE ridge fluctuations
has decrease with the increase of the Reynolds number towards the discrete shedding
regime. The spiral computed with Equation (3.1) represents the middle line along which
8 Figure 5. Model of the shear layer roll-up (solid curve) atop of nFTLE fields at α = 105° for (a) Re = 840, (b) Re = 1955, and (c) Re = 8380. The spiral is only plotted for θ ranging from θtip to 4π. Figure 6. Variation of the angular location of the primary vortex (β) with convective time indicate by the plate’s rotation angle (α) for (a) rotations around the mid-length and edge of the plate with c = 4 cm ; and (b) rotation around the mid-length with c = 6 cm. the FTLE ridge oscillates (Figure 5b). We can distinguish four lobes on the outside of the predicted spiral that surround four secondary vortices in Figure 3c. With increasing value of the Reynolds number, we can distinguish three regimes: a first regime (Re < 1500) which is characterised by a stable shear layer, a transitional regime (1500 < Re < 4000) which is characterised by first signs of instability, and a discrete vortex shedding regime (Re > 4000) where vorticity is only observed in isolated patches. For the three Re regimes observed, the modified Kaden spiral is able to predict the roll-up of the shear layer and the path of the secondary vortices for the entire rotation of the plate. To further quantitatively validate our modified Kaden spiral model, we compare the measured angular locations of the primary vortex as a function of the convective time α with the predicted model results in Figure 6 for different Re. The angular position β of the primary vortex increases with α. The relationship between β and α is close to, but not entirely linear. The trajectory of the primary vortex is completely independent of the Reynolds number and is accurately predicted by the modified Kaden spiral. The trajectory is also not influenced by the total length of the plate. The measured data presented in Figure 6a include results from the plates with the rotational location and the mid-length and from the plates with the rotational location location at one end of the plate. The distance between the rotational point and the tip is the same in both cases. From the perspective of vortex formation and shear layer roll-up, a plate with a length of 4 cm that rotates around one end is equivalent to a 8 cm long plate rotating around
9
Figure 7. Temporal evolution of secondary vortices at different angular positions (a) α = 30.0°,
(b) α = 55.7°, (c) α = 83.0°, (d) α = 110.5°, (e) α = 137.7°, and (f) α = 160.0° for Re = 8380.
The black curve is the modified Kaden’s spiral, whose centre and end are the primary vortex
centre (+) and the right top plate edge (∗). The spiral is only plotted for θ ranging from θtip to
4π. The dashed line represents the plate tip trajectory.
its centre location. The presence of a flipped and mirrored vortex system and shear layer
topology on the other side of the longer plate has no influence on the roll-up nor on the
trajectory of the primary vortex for the plate geometries and Reynolds numbers tested
here.
The influence of the distance between the rotational point and the plate tip, referred
to as the chord length here, is analysed by considering a plate with length 12 cm and
chord length 6 cm. For rotational motions with the longer plate, we observe the same
shear layer topology for the same Re-regimes described before. The modified Kaden
spiral predictions still provide an excellent prediction of the shear layer roll-up and the
trajectory of the primary vortex in Figure 6b. The angular velocity in terms of dβ/dα is
slightly increased for the higher chord length plates and a higher value of η = 1.59 × 10⁻²
was used for the modified Kaden spiral predictions of the larger chord length wing. For
the two different chord lengths, the ratio η/c = 0.260 ± 0.005. To take into account the
influence of the chord length in our modified Kaden spiral model, we replace the empirical
constant η in Equation (3.1) with η 0 c to obtain:
2/3
0 α
r = η cα , (3.4)
θ
where η 0 = 0.260 for all data presented in this paper.
3.3. Timing of the secondary vortex shedding
In the next part, we focus our attention on the successive shedding of secondary vortices.
The first step is to determine if these secondary vortices are generated from the stretching
of an initially unstable shear layer or if they are discretely released after the separation of
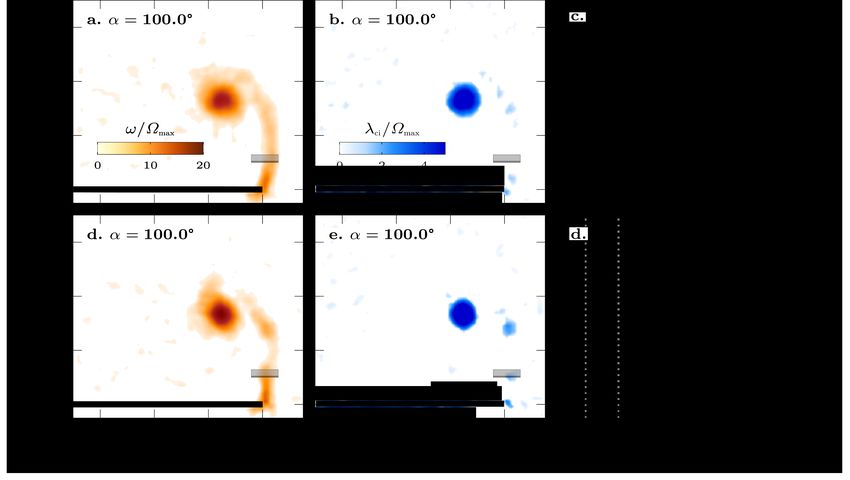
the primary vortex. Figure 7 shows the flow topology at different plate angular positions10 for Re = 8380. Between α = 0° and α = 30° the primary vortex centre is close to the plate tip and no secondary vortices are observed. At α = 30°, the primary vortex has moved away from the tip along the circular tip trajectory and a first secondary vortex forms (Figure 7a). The first secondary vortex drifts towards the primary vortex core and they merge as a consequence of their mutual interaction (Figure 7b). The formation and shedding of successive secondary vortices is repeated along the entire motion. Each vortex is independently formed and subsequently released from the plate tip. In this situation, the shear layer appears as a cloud of vorticity close to the plate tip from which vortices are discretely detached. Once the secondary vortices shed, they move away and are located along the modified time-varying Kaden spiral (Figure 7c-e). Vortices closer to the primary vortex deviate slightly from the predicted spiralling curve only when the plate rotation is about to finish (Figure 7f). The second step is to compute the timing of secondary vortices. If we consider the vorticity field, the constant presence of the cloud of vorticity close to the tip hampers the identification of the separation time. To estimate the timing of shedding of the individual vortices we use the swirling strength criterion by Zhou et al. (1999). A vortex is considered a connected region where the value of the swirling strength λci is positive. The swirling strength criteria allows us to distinguish more reliably whether a region of high vorticity concentration indicates the presence of a secondary vortex or whether it is due to a strong shear flow (see Figure 8a,b). To determine the timing of release of subsequent secondary vortices, we calculate and analysed the evolution of the local average swirling strength, denoted by λtip , in a small rectangular region close to the tip of the plate. As we are purely interested in the counterclockwise rotating structure here, we only count the positive swirling strength in regions where the vorticity is positive. The location of the probing region is indicated in Figure 8a,b and an example of the resulting temporal evolution of the local average tip swirling strength for Re = 8380 is presented in Figure 8c. The temporal evolution of λtip has a global maximum and first peak at α = 32.6° which is followed by six clearly distinguishable smaller peaks. The initial peak corresponds to the shedding of the primary vortex, and the subsequent smaller peaks mark the shedding of individual secondary vortices. The average swirling strength systematically drops to zero in between the individual peaks, further supporting the conclusion that the secondary vortices are discretely released from the tip of the plate. The timing of the local maxima of λtip is used to further analyse the shedding timing of the secondary vortices. This strategy to determine the timing of secondary vortex shedding is simple yet robust and allows for a systematic and automated extraction of the timings for all measurements. The results depend slightly on the location and size of the probing region which were carefully selected based on a sensitivity analysis (appendix B). Results of the timing extraction strategy for Re = 840 and Re = 1955 are summarised in Figure 9. For the lowest Reynolds number Re = 840, we have a continuous stable shear layer and the associated snapshot of the swirling strength at α = 100° in Figure 9a shows a single isolated coherent structure and no sign of secondary vortices. This is confirmed by the time evolution of λtip (Figure 9a) that exhibits a single peak at α = 31.9°. No other peaks are observed afterwards confirming that the shear layer is a continuous layer of fluid without the presence of any instabilities for this Reynolds number. For the intermediate Reynolds number Re = 1955, the shear layer topology appeared to be undulating with some localised concentrations of high vorticity along it (Figure 3b). The temporal evolution of the average tip swirling strength reveals the shedding of two secondary coherent structures formed after the primary vortex (Figure 9b). These two structures are formed and released from the tip and they are not formed afterwards due
11

Figure 8. Snapshot of the (a) vorticity field and (b) the swirling strength at α = 115° for
Re = 8380. The black rectangle corresponds to the region in which λtip is computed. (c) Evolution
of λtip as a function of the angular position of the plate. The markers indicate the local maxima
in the average tip swirling strength. The timing of the local maxima are related to the separation
angle of subsequent secondary vortices. The vertical dotted line marks the timing of the snapshot
presented in (a).

Figure 9. (a-c) Snapshots of the swirling strength λ field at α = 100° and (b-d) evolution of
λtip as a function of the angular position of the plate. The first row corresponds to Re = 840 at
which the shear layer appears continuous. The second row is for Re = 1955 at which the shear
layer shows signs of instability.

to the stretching of the shear layer which does not become clear based solely on the
vorticity flow topology.
The experiments are repeated five times at each Reynolds number. The separation time
and angle of successive secondary vortices are computed and analysed for all experiments
with Re > 4000 corresponding to the discrete shedding regime. The timing of the
secondary vortex shedding versus the number corresponding to the order of successive
shedding is presented in Figure 10. In general, the time interval between successive
vortices increases the more secondary vortices have been released and the time interval
decreases with increasing Reynolds number, yielding a larger total number of secondary
12

Figure 10. Delay between the successive shedding of secondary vortices in terms of (a)
dimensional time and (b) convective time or angular distance between secondary vortices as
of the shedding order n. The solid lines are the fit of the angular distance between vortices and
n. (c) Coefficient ∆α as a function of the maximum rotational speed of the plate.

vortices at the end of the 180° plate rotation. If we hypothesise that the strength
of the secondary vortices remains approximately constant, which is confirmed by the
experimental data, then the increase in time interval should be due to a decrease in the
circulation feeding rate by the shear layer. This feeding rate is related to the shear rate
of at the tip of the plate and can be estimated by:

                             dΓ  v 2 − vin2   (Ωc/2)2 − vin2 (t)
                                ∝ out       ≈                                              (3.5)
                             dt       2             2
where vout refers to the velocity at the outer side of the shear layer, which equals the
tip velocity Ωc/2 and vin refers to the velocity at the inner side of the shear layer. The
velocity at the inner side vin is close to zero during the initial part of the rotation as
the plate rotates in a quiescent fluid and increases due to the accumulation of vortex
induced velocity components along the direction of the plate’s motion. The feeding rate
thus decreases when the rotational velocity and the Reynolds number decrease and when
the induced velocity due to an increased number of released vortices. This explains the
general trends observed in Figure 10a,b.
To quantify the evolution of the shedding timing of the secondary vortices, we fit the
measured values in Figure 10b with a power law in the form:

                                     α(n) = α0 (1 + ∆α)n                                   (3.6)

where α0 and ∆α are fitting constants and n counts the number of secondary vortices.
This power law is suitable to represent the timing dynamics for all Reynolds numbers
as all fits have a R2 -value above 99 %. The fitting parameter ∆α indicates the relative
increase in α between the convective timing of successive secondary vortices, i.e. αn+1 /αn =
1 + ∆α. A higher value of ∆α indicates a larger delay between successive vortices and a
lower total number of vortices shed at the end of the motion. The evolution of ∆α as a
function of the maximum rotational speed is presented in Figure 10c. The results confirm
the general decrease in the time delay between the release of subsequent vortices for
increased rotational velocity of the plate which yields an increased feeding rate according
to Equation (3.6).
13 4. Conclusion The roll-up of a shear layer behind a rotating plate in a quiescent fluid is experimentally studied for different rotational velocities or Reynolds numbers. Particular focus was directed towards the formation, trajectory, and timing of secondary vortices. Based on the time-resolved PIV, we identified three Reynolds number regimes based on the stability of the shear layer. For Re < 1500, a stable shear layer in the form of a continuous band of vorticity is observed that rolls up into a single coherent primary vortex. For Re > 4000, the shear layer is unstable and secondary vortices are discretely released from the plate’s tip during the rotation. In the intermediate regime for 1500 < Re < 4000, first signs of instability appear. The shear layer is still a continuous band of vorticity but it shape is wavier and localised concentrations of higher vorticity emerge. In all three regimes, the centre of the primary vortex is located on the plate tip trajectory and the shear layer topology matches a spiral shape similar to the roll up of a free shear layer. A modified version of the Kaden spiral is proposed to describe and predict the temporal evolution of the shear layer roll up. The key modification is the replacement of the constant dimensional Kaden constant K by a factor η 0 cα that increases linearly with the rotational angle of the plate and takes into the effect of the chord length. A single value of η 0 has been empirically determined for all experimental conditions presented in this paper. The proposed modified Kaden spiral model describes the spatiotemporal evolution of the shear layer and accurately predicts the trajectory of the centre of the primary vortex for all Reynolds numbers and different plate dimensions. The timing of secondary vortices shedding for Reynolds numbers in the discrete shedding regimes is determined using the swirling strength criterion. The swirling strength fields confirm that secondary vortices form directly at the tip of the plate and not further downstream due to the stretching of the shear layer. The separation time of each secondary vortex is identified as a local maximum in the temporal evolution of the average swirling strength close to the plate tip. The time interval between the release of successive vortices is not constant during the rotation but increases the more secondary vortices have been released. The shedding time interval also increases with decreasing Reynolds number, yielding a lower total number of secondary vortices at the end of the 180° plate rotation for lower Re. The increased time interval under both conditions is due to a reduced circulation feeding rate. Appendix A. Derivation of the modified Kaden spiral The modified version of the Kaden spiral we propose takes into account the temporal increase in the distance between the primary vortex and the tip of the plate where the bound end of the vortex sheet is fixed. The angular coordinate along the spiral that marks the bound end of the vortex sheet is denoted by θtip . The value of θtip is determined at every time step based solely on the observation that the primary vortex moves along a path that matches the plate tip trajectory. Based on this purely geometric constraint, we also directly obtain the radial spiral coordinate where the modified Kaden spiral meets the plate tip, indicated by rtip , and the angular location of the primary vortex with respect to the plate, denoted by β. Their detailed derivation is given here. We consider the flow situation after the plate has rotated for a given α in the plates frame of reference in Figure 11. The plate tips trajectory is indicated by the dashed line. The primary vortex is located on that circular trajectory. Its angular position with respect to the plate’s centre of rotation and tip is indicated by β. Consider that we have shifted the modified spiral defined by Equation (3.4) such that
14

Figure 11. Definition of the radial and angular spiral coordinates and its orientation with
respect to the plate’s frame of reference. The trigonometric relationships Equation (A 1) and
Equation (A 2) are obtained in the shaded triangles.

the spiral centre (r = 0, θ → ∞) is located in the centre of the primary vortex. The
radial and angular location of the plate tip in the spiral coordinates are given by (rtip ,
θtip ) as indicated in Figure 11. For a given spiral form, there is only one solution for β
that allows the spiral to go through the plate tip. This solution can be found by ensuring
that the trigonometric relationships for the two triangles outlined in Figure 11b are met:
                                β = 2 arcsin(rtip cos θtip /2c)                        (A 1)
                                β = arcsin(rtip cos θtip /c) .                         (A 2)
The distance between the primary vortex centre and the tip of the plate, rtip , is determined
through the modified Kaden spiral (Equation (3.4)), for θ = θtip . In this way, Equa-
tion (A 1) and Equation (A 2) are only functions of θtip , which is computed by equalising
the two relationships. For β > π/2, we need to use
                                β = π − arcsin(rtip cos θtip /c)                       (A 3)
instead of Equation (A 2). Once θtip is retrieved, we substitute it into Equation (A 1) to
obtain the angular position β of the primary vortex. From the value of β, we compute
the cartesian coordinates of the primary vortex centre, which corresponds to the centre
of our predicted spiral model. The full spiral is finally obtained for every plate angular
position α, using Equation (3.2) with θ ∈ [θtip , ∞].

Appendix B. Sensitivity analysis of the location and size of the
            average tip swirling strength probing region
The local average swirling strength λtip reaches a local maximum value when most of
the vortex fills the selected rectangular region. If the position and dimension of the
rectangular region is not properly set, the identification of the separation time through
local peaks loses accuracy. We perform a sensitivity analysis of the best position and
dimension of the rectangular region. The first thing to set is the centre of the rectangle.
We observed that when the core centre of a secondary vortex is approximately 1 cm
above the plate tip, the following secondary vortex starts growing. Since the trajectory
of each secondary vortex is predicted by the modified Kaden’s spiral (Equation (3.4)),
15
we decide to place the centre of the rectangle along the spiral, 1 cm above the tip. The
area of the rectangle has to be big enough to fully include the vortex but it does not
have to include the swirling strength associated to the plate and to the other secondary
vortices. For the plate chord c = 4 cm, a rectangle base of 0.25c is sufficiently large to
include the radial dimension of the secondary vortex, excluding the swirling strength of
the plate. A height of 0.15c allows to have one secondary vortex at a time in the selected
rectangle.
Declaration of interest
The authors report no conflict of interest.
REFERENCES
Bloor, M. S. 1964 The transition to turbulence in the wake of a circular cylinder. Journal of
Fluid Mechanics 19 (02), 290.
Carr, Zakery R., DeVoria, Adam C. & Ringuette, Matthew J. 2015 Aspect-ratio effects
on rotating wings: Circulation and forces. Journal of Fluid Mechanics 767, 497–525.
Corkery, S. J., Babinsky, H. & Graham, W. R. 2019 Quantification of added-mass effects
using particle image velocimetry data for a translating and rotating flat plate. Journal of
Fluid Mechanics 870, 492–518.
Dabiri, J. O. 2009 Optimal Vortex Formation as a Unifying Principle in Biological Propulsion.
Annual Review of Fluid Mechanics 41 (1), 17–33.
David, M. Jimreeves, Mathur, Manikandan, Govardhan, R. N. & Arakeri, J. H. 2018
The kinematic genesis of vortex formation due to finite rotation of a plate in still fluid.
Journal of Fluid Mechanics 839, 489–524.
DeVoria, A. C. & Mohseni, K. 2018 Vortex sheet roll-up revisited. Journal of Fluid Mechanics
855, 299–321.
Fernando, J. N., Marzanek, M., Bond, C. & Rival, D. E. 2017 On the separation
mechanics of accelerating spheres. Physics of Fluids 29 (3), 037102.
Fernando, J. N. & Rival, D. E. 2016 On vortex evolution in the wake of axisymmetric and
non-axisymmetric low-aspect-ratio accelerating plates. Physics of Fluids 28 (1), 017102.
Gao, L. & Yu, S. C. M. 2010 A model for the pinch-off process of the leading vortex ring in
a starting jet. Journal of Fluid Mechanics 656, 205–222.
Gharib, M., Rambod, E. & Shariff, K. 1998 A universal time scale for vortex ring formation.
Journal of Fluid Mechanics 360, 121–140.
Graftieaux, L., Michard, M. & Grosjean, N. 2001 Combining PIV, POD and vortex
identification algorithms for the study of unsteady turbulent swirling flows. Measurement
Science and Technology 12 (9), 1422–1429.
Green, Melissa A, Rowley, Clarence W & Haller, George 2007 Detection of Lagrangian
coherent structures in three-dimensional turbulence. Journal of Fluid Mechanics 572,
111–120.
Grift, E. J., Vijayaragavan, N. B., Tummers, M. J. & Westerweel, J. 2019 Drag force
on an accelerating submerged plate. Journal of Fluid Mechanics 866, 369–398.
de Guyon, G. & Mulleners, K. 2021 Scaling of the translational velocity of vortex rings
behind conical objects. Physical Review Fluids accepted for publication.
Haller, George 2001 Distinguished material surfaces and coherent structures in three-
dimensional fluid flows. Physica D: Nonlinear Phenomena 149 (4), 248–277.
Haller, George 2015 Lagrangian coherent structures. Annual review of fluid mechanics 47,
137–162.
Jeon, D. & Gharib, M. 2004 On the relationship between the vortex formation process and
cylinder wake vortex patterns. Journal of Fluid Mechanics 519, 161–181.
Kaden, H. 1931 Aufwicklung einer unstabilen Unstetigkeitsfläche. Ing. Arch 2 (2), 140–168.
Koumoutsakos, P. & Shiels, D. 1996 Simulations of the viscous flow normal to an impulsively
started and uniformly accelerated flat plate. Journal of Fluid Mechanics 328, 177–227.16
Krasny, R. 1987 Computation of vortex sheet roll-up in the Trefftz plane. J. Fluid Mech. 184,
123–155.
Krishna, S., Green, M. A. & Mulleners, K. 2018 Flowfield and Force Evolution for a
Symmetric Hovering Flat-Plate Wing. AIAA Journal 56 (4), 1360–1371.
Lawson, J. M. & Dawson, J. R. 2013 The formation of turbulent vortex rings by synthetic
jets. Physics of Fluids 25 (10), 105113.
Luchini, P. & Tognaccini, R. 2002 The start-up vortex issuing from a semi-infinite flat plate.
Journal of Fluid Mechanics 455, 175–193.
Mohseni, K. & Gharib, M. 1998 A model for universal time scale of vortex ring formation.
Physics of fluids 10 (10), 2436.
Moore, D. W. 1974 A numerical study of the roll-up of a finite vortex sheet. Journal of Fluid
Mechanics 63 (2), 225–235.
Moore, D. W., Saffman, P. G. & Stewartson, K. 1973 Axial flow in laminar trailing
vortices. Proceedings of the Royal Society of London. A. Mathematical and Physical
Sciences 333 (1595), 491–508.
Prasad, A. & Williamson, C. H. K. 1997 The instability of the shear layer separating from
a bluff body. Journal of Fluid Mechanics 333, 375–402.
Pullin, D. I. 1978 The large-scale structure of unsteady self-similar rolled-up vortex sheets.
Journal of Fluid Mechanics 88 (3), 401–430.
Pullin, D. I. & Perry, A. E. 1980 Some flow visualization experiments on the starting vortex.
Journal of Fluid Mechanics 97 (2), 239–255.
Rockwood, Matthew, Huang, Yangzi & Green, Melissa 2018 Tracking coherent
structures in massively-separated and turbulent flows. Physical Review Fluids 3 (1),
014702.
Rosi, G. A. & Rival, D. E. 2017 Entrainment and topology of accelerating shear layers.
Journal of Fluid Mechanics 811, 37–50.
Saffman, P. G. 1995 Vortex Dynamics, 1st edn., Cambridge Monographs on Mechanics and
Applied Mathematics, vol. 1. Cambridge ; New York: Cambridge University Press.
Sattari, P., Rival, D. E., Martinuzzi, R. J. & Tropea, C. 2012 Growth and separation of
a start-up vortex from a two-dimensional shear layer. Physics of Fluids 24 (10), 107102.
Schlueter-Kuck, K. & Dabiri, J. O. 2016 Pressure evolution in the shear layer of forming
vortex rings. Physical Review Fluids 1 (1), 012501.
Wei, T & Smith, C R 1986 Secondary vortices in the wake of circular cylinders 169, 513–533.
Willert, C., Stasicki, B., Klinner, J. & Moessner, S. 2010 Pulsed operation of high-power
light emitting diodes for imaging flow velocimetry. Measurement Science and Technology
21 (7), 075402.
Williamson, C. H. K. 1996 Vortex Dynamics in the Cylinder Wake. Annual Review of Fluid
Mechanics 28 (1), 477–539.
Wu, J., Sheridan, J., Hourigan, K. & Soria, J. 1996 Shear layer vortices and longitudinal
vortices in the near wake of a circular cylinder. Experimental Thermal and Fluid Science
12 (2), 169–174.
Zhou, J., Adrian, R. J., Balachandar, S. & Kendall, T. M. 1999 Mechanisms for
generating coherent packets of hairpin vortices in channel flow. Journal of Fluid Mechanics
387, 353–396.You can also read