The Effect of Article Characteristics on Citation Number in a Diachronic Dataset of the Biomedical Literature on Chronic Inflammation: An Analysis ...
←
→
Page content transcription
If your browser does not render page correctly, please read the page content below
publications

Article
The Effect of Article Characteristics on Citation Number in a
Diachronic Dataset of the Biomedical Literature on Chronic
Inflammation: An Analysis by Ensemble Machines
Carlo Galli *           and Stefano Guizzardi

                                          Department of Medicine and Surgery, Histology and Embryology Lab, University of Parma, Via Volturno 39,
                                          43126 Parma, Italy; stefano.guizzardi@unipr.it
                                          * Correspondence: carlo.galli@unipr.it; Tel.: +39-0521-906740

                                          Abstract: Citations are core metrics to gauge the relevance of scientific literature. Identifying features
                                          that can predict a high citation count is therefore of primary importance. For the present study,
                                          we generated a dataset of 121,640 publications on chronic inflammation from the Scopus database,
                                          containing data such as titles, authors, journal, publication date, type of document, type of access
                                          and citation count, ranging from 1951 to 2021. Hence we further computed title length, author count,
                                          title sentiment score, number of colons, semicolons and question marks in the title and we used these
                                          data as predictors in Gradient boosting, Bagging and Random Forest regressors and classifiers. Based
                                          on these data, we were able to train these machines, and Gradient Boosting achieved an F1 score of
                                          0.552 on classification. These models agreed that document type, access type and number of authors
                                          were the best predicting factors, followed by title length.

                                   Keywords: citations; title; machine learning
Citation: Galli, C.; Guizzardi, S.
The Effect of Article Characteristics
on Citation Number in a Diachronic
Dataset of the Biomedical Literature      1. Introduction
on Chronic Inflammation: An                     In a world where the sheer amount of available information is growing exponentially,
Analysis by Ensemble Machines.            ranking knowledge according to its reliability has become crucial, and the scientific com-
Publications 2021, 9, 15.                 munity has therefore attributed increasing importance to scientometrics, i.e., the ability
https://doi.org/10.3390/                  to analyze the impact of science [1]. Scientometrics, with all its limits [2], is the compass
publications9020015
                                          that is commonly used to drive strategic decisions in public health, in grant policies, to
                                          allocate funding, and at a lower level, to determine hiring and promotions [3]. Within
Received: 27 December 2020
                                          scientometrics, citations are the single most distinctive parameter to estimate the visibility
Accepted: 30 March 2021
                                          of a scientific publication [4]. The number of citations is also used to compute further
Published: 6 April 2021
                                          indices of performance, such as the Hirsch’s score, which are used to evaluate the scientific
                                          productivity of a scholar [5].
Publisher’s Note: MDPI stays neutral
                                                It may be—not without a reason—assumed that good science will eventually be
with regard to jurisdictional claims in
                                          cited more often, but in a situation of information overload in fields such as life sciences
published maps and institutional affil-
iations.
                                          and medicine, where “mountains of unloved and unread publications [exist]” [6] researchers
                                          have long strived to investigate what factors may affect the number of citations a study
                                          can accrue [7–10]. Several publications have pointed out that shorter titles can facilitate
                                          citations, possibly by making an article stand out during literature searches; its meaning
                                          more easily apprehended, and therefore remembered [11]. Besides cognitive mechanisms,
Copyright: © 2021 by the authors.
                                          other factors can possibly affect how often an article is searched, viewed and cited. Open
Licensee MDPI, Basel, Switzerland.
                                          access articles, for instance, are more easily accessible for scholars in low-budget contexts,
This article is an open access article
                                          who may not rely on institutional subscriptions [12]. The genre of the article could also
distributed under the terms and
                                          make a study more searched. Review articles, at least narrative reviews, generally describe
conditions of the Creative Commons
Attribution (CC BY) license (https://
                                          the state of the art in a given field and are often beloved reading for scholars looking for an
creativecommons.org/licenses/by/
                                          overview of a topic [13]. And even the number of authors (and prestigious authorship of
4.0/).                                    course) could affect citations [3], as each author can be part of a network of acquaintances

Publications 2021, 9, 15. https://doi.org/10.3390/publications9020015                                 https://www.mdpi.com/journal/publications
Publications 2021, 9, 15                                                                                            2 of 11

                           who may be more easily attracted and read, and therefore cite, their work, not to mention
                           the relevance of specific journals with high impact factor that may be a preferred reading
                           and citation source for scholars [14].
                                The goal of this study was to examine the association between some selected article
                           features, including textual features of the title and number of citations, in a diachronic
                           dataset of studies on chronic inflammation retrieved from Scopus using a set of specific
                           machine learning techniques, namely ensemble classifiers. This specific research field was
                           chosen for consistency reasons, because our group has been focusing and analyzing it in
                           the last few years. Although differences with publications in other medical areas may exist,
                           they are difficult to anticipate, and the conclusions from our survey are therefore applicable
                           mostly to the topic of inflammation.

                           2. Materials and Methods
                                 The analysis was conducted on a literature dataset created through Scopus. The
                           Scopus database was searched using the ‘Chronic Inflammation’ keywords, without filters.
                           All the information was downloaded as several.csv files (due to inherent limitations in
                           Scopus, which does not allow to download more than 20,000 records at a time), which
                           were then imported in a Jupyter notebook running Python 3.6, using the Pandas library.
                           The dataframes were concatenated into one single dataframe without duplicates. For data
                           analysis, the python Numpy, Pandas and Scipy libraries were used. Matplotlib and Seaborn
                           libraries were used for data visualization.
                                 The information provided by Scopus included title of the article, authors, journal,
                           publication date, type of document, type of access, publication stage and citation count,
                           besides Scopus ID codes, DOI and a link to the article. We proceeded to create further
                           features for each publication. We used the VADER implementation [15] in the Nltk library
                           to perform a sentiment analysis of the titles, which yielded a sentiment score. We used the
                           Re library to search for colons, semicolons and question marks within titles through regular
                           expressions. We also used the implementations of Linear Regression, Gradient Boosting,
                           Bagging, Random Forest regressor and classifiers and Logistic Regression algorithms in
                           the Scikit-learn package. To train the models the data were split into a training and a
                           testing set through Scikit-learn. The models were tuned using Randomized search CV in
                           the Scikit-learn package. The performance of the models was then evaluated on accuracy,
                           precision, recall and F1 score (the harmonic mean of precision and recall) calculated on
                           test data.

                           3. Results
                           3.1. Overview of the Dataset
                                 Our Scopus search retrieved 159,461 titles, published over the course of 194 years from
                           1827 to 2021 in 12,308 academic journals. Unfortunately, 25,227 articles lacked a citation
                           count, which could be attributable at least in part to their recent publication date (data not
                           shown). Though we could not rule out that some of those titles were articles that were
                           actually never cited, we decided to keep only those uncontroversial articles where a citation
                           count ≥1 was provided.
                                 Several kinds of publications were initially present in our dataset (data not shown),
                           e.g., letters, surveys, book chapters and even conference papers. Most publications, how-
                           ever, fell within the ‘Article’ or ‘Review’ categories, and the dataset was restricted to these
                           two classes only.
                                 We furthermore decided to keep only those papers that were published after 1951,
                           as only very few papers in our dataset were published before that date and their scarce
                           numbers might affect our analysis. We also decided to exclude papers with unusually high
                           numbers of authors, which, in a few very peculiar cases, could amount to hundreds. Based
                           on the distribution of author number, we removed papers with more authors than 1.5 times
                           their interquartile range (i.e., 15 authors). The remaining dataset, therefore, included
                           121,640 manuscripts.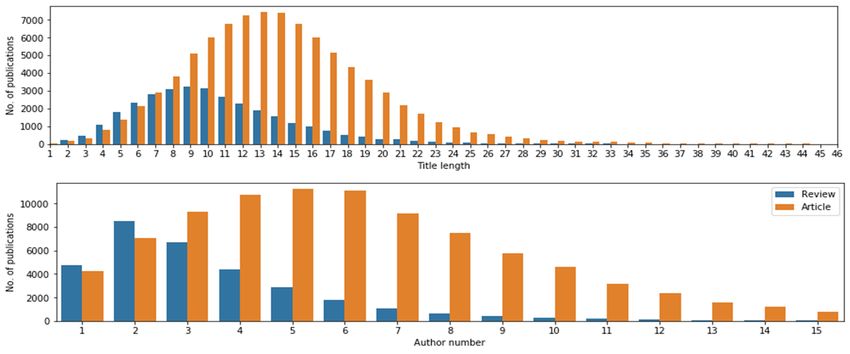
Publications 2021, 9, x FOR PEER REVIEW 3 of 11
Publications 2021, 9, 15 3 of 11
times their interquartile range (i.e., 15 authors). The remaining dataset, therefore, included
121,640 manuscripts.
3.2. Features Distribution
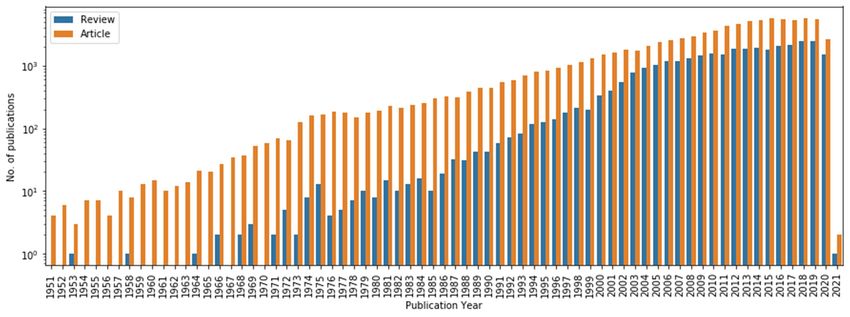
The temporal distribution
distribution of articles
articles by document
document type
type can
can be seen in Figure 1, which
shows, beside the well-known steady increment in publications over the years, the robust
surge of
of Reviews,
Reviews,which
whichhave
havebecome
becomemoremoreprominent
prominent since thethe
since mid ‘80s‘80s
mid andand
which ac-
which
count
accountforfor
about
about30%
30%ofofall
allthe
thepublications
publicationsininour
our dataset.
dataset. Beside
Beside Document
Document Type, the the
Scopus database contains information about the accessibility of full texts and and indicates
indicates
whether a specific entry belongs to an Open Access typology or a Paid subscription type.
Open Access is a novel business model that grants readers free access to the content of a
report, made possible by the digitalization of publications. Understandably, Open Access
journals have gained in popularity and many journals are now offered as open access, or
with an open access option. Many older articles are also offered as open access to readers,
even if their latest issues may not be.
Above: Distribution
Figure 1. Above: DistributionofofArticles
Articles(orange)
(orange)and
andReviews
Reviews (blue)
(blue) included
included in in
thethe present
present corpus,
corpus, expressed
expressed on aonlog
a
scale.
log scale.
To gain deeper insights into the characteristics of the papers in the dataset, we anno-
tated the presence and number of colons and semicolons in the title, as a sign of a more
structured and
structured andthus
thuscomplex
complextitle,
title,ororquestion
questionmarks
marks (a (a
sign of aofdifferent
sign illocutive
a different attitude
illocutive atti-
in the sentence), and we also performed a sentiment analysis using
tude in the sentence), and we also performed a sentiment analysis using VADER, a com- VADER, a common
package
mon packagefrom from
the Nltk
the library, whichwhich
Nltk library, assigns a positive
assigns or negative
a positive sentiment
or negative to sentences.
sentiment to sen-
This last
tences. feature
This shouldshould
last feature be taken bewith
takena with
caveat. VADER
a caveat. is a human-validated
VADER is a human-validated sentiment
sen-
analysis method, supported by a robust corpus of literature [15–17]
timent analysis method, supported by a robust corpus of literature [15–17] but not reallybut not really tested
with
testedbiomedical texts yet,
with biomedical although
texts our study
yet, although our(Figure A1) confirms
study (Figure that most
A1) confirms thatpublications
most pub-
display a positive sentiment, which is consistent with a positive publication
lications display a positive sentiment, which is consistent with a positive publication bias [18]. bias
[18]. Figure A1 in the Appendix A summarizes feature distribution in our dataset, stratified
by publication
Figure A1type.in theThe majorityAofsummarizes
Appendix publicationsfeature
in our dataset are original
distribution in our articles,
dataset,almost
strati-
three times as many as reviews. Seventy-five % of articles are also accessible
fied by publication type. The majority of publications in our dataset are original articles, via a payable
subscription.
almost Most as
three times articles
manyinasour datasetSeventy-five
reviews. are simple, without colons,
% of articles areoralso
with two colons
accessible viaata
most. Titles with more than two colons, and up to six, are a small fraction
payable subscription. Most articles in our dataset are simple, without colons, or with two of the dataset.
Most articles
colons at most.have no semicolons
Titles with more thanor question marksand
two colons, (Figure
up toA1).
six, About a thousand
are a small fractionarticles
of the
have a semicolon or a question mark. Though original articles are much more numerous
dataset. Most articles have no semicolons or question marks (Figure A1). About a thou-
than reviews, they are similarly distributed across features.
sand articles have a semicolon or a question mark. Though original articles are much more
The distribution of citations was quite skewed (data not shown). Though few manuscripts
numerous than reviews, they are similarly distributed across features.
were cited a very high number of times—up to 17,996—the overall median number of citations
The distribution of citations was quite skewed (data not shown). Though few manu-
for the included manuscripts was 15, with a 75th percentile of 39. As clearly visible by the
scripts were cited a very high number of times—up to 17,996—the overall median number
distribution of citations over the years, a peak of citations can be observed around the year
of citations for the included manuscripts was 15, with a 75th percentile of 39. As clearly
2000, with citations then declining in more recent years (Figure 2). This reflects the nature of
visible by the distribution of citations over the years, a peak of citations can be observed
citations, which accumulate with time, so manuscripts that were published up to 20 years ago
had obviously more time to collect a higher number of citations. On the other hand, older
articles did not get as many citations, possibly because their cultural parable was already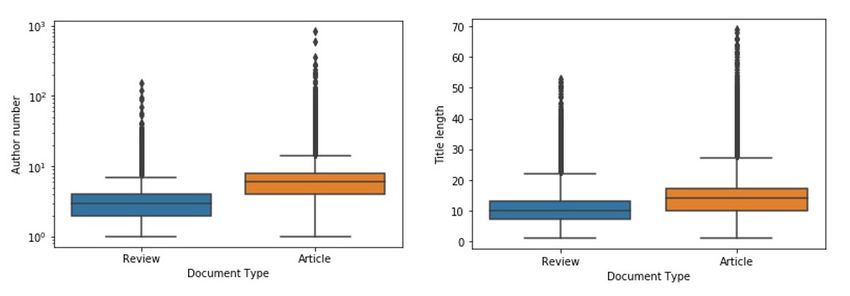
ations 2021, 9, x FOR PEER REVIEW 4 of 11
around the year 2000, with citations then declining in more recent years (Figure 2). This
Publications 2021, 9, 15 4 of 11
reflects the nature of citations, which accumulate with time, so manuscripts that were
published up to 20 years ago had obviously more time to collect a higher number of cita-
tions. On the other hand, older articles did not get as many citations, possibly because
their cultural declining
parable wasas citations
alreadystarted to beas
declining tracked, or simply
citations startedbecause at the time
to be tracked, or fewer
simplyjournals existed
because at theand
timefewer
fewerarticles were
journals published
existed and thus
and fewer the chances
articles to be cited
were published andwere
thusless
thenumerous. To
chances to be account for the
cited were lesseffect of timeTo
numerous. onaccount
the citation
for count of each
the effect article
of time onwethenormalized
citation the citation
number by the average expected citation for the year of publication,
count of each article we normalized the citation number by the average expected citation and used that as target
for our subsequent analysis.
for the year of publication, and used that as target for our subsequent analysis.
Figure 2. Distribution of citations for the manuscripts in the present corpus. Values are shown as
Figure 2. Distribution of citations for the manuscripts in the present corpus. Values are shown as mean +/− stan-
mean +/− standard deviation.
dard deviation.
It has been claimed
It has beenthat the length
claimed of the
that the length
title of of
a manuscript
the title of aismanuscript
associated is to associated
its to its
citation count,citation
though the results
count, though are conflicting.
the results Further evidence
are conflicting. has beenhas
Further evidence reported
been reported about
about a possible association
a possible between
association authors
between and citations.
authors To test
and citations. Tothese hypothesis,
test these we we analyzed
hypothesis,
analyzed title title
length (as number of words) and number of authors for
length (as number of words) and number of authors for the manuscripts the manuscripts in in our corpus.
our corpus. Title length did not appear to change significantly over the years; as
Title length did not appear to change significantly over the years; as previously reported, previ-
ously reported, thethe number
number ofofauthors
authorshashassteadily
steadilyincreased
increasedover overtime,
time,possibly
possibly asas studies
studies have become
have become more morecomplex
complexand andprogressively
progressively required
required moremore competences
competences and and
skillsskills
(data not shown).
(data not shown). Title length, however, was not homogeneously distributed across different document
Title length, however,
types. Original was not homogeneously
articles tend to have longer distributed across
titles than different
reviews do, document
while having also more
types. Originalauthors
articles(Figure
tend toA2).have longer titles than reviews do, while having also more
authors (Figure A2). A cumulative plot of author number and title length can be seen in Appendix B, where
A cumulative plot of author
these features number and
are represented title length
as boxplots cansignificantly
and are be seen in Appendix B,
different between reviews
where these features
and originalare represented
articles with as pboxplots
< 0.001,and by are
Mann significantly
Whitney U different between
test (Figure A3). These data
reviews and original
suggestarticles
that part with p < association
of the 0.001, by Mann Whitney
between U test (Figure
title length or author A3). These and citations
number
data suggest that part of the association between title length
might actually be mediated by differences in article genre. or author number and cita-
tions might actually be mediated by differences in article genre.
To better understand this phenomenon, we preliminarily investigated the relation
To betterbetween
understand this phenomenon,
the citations of a study andwe its
preliminarily
features (Figureinvestigated
3). Takenthe relationreview articles
together,
between the citations
collectedofmore a study and itsthan
citations features (Figure
original 3). Taken
articles (p < 0.001together,
by Mannreview articles
Whitney U test), possibly
collected morebecause
citations ofthan
theiroriginal articles (p
comprehensive and< 0.001 by Mann
broader scope.Whitney U test),no
Cumulatively, possibly
differences could be
because of their comprehensive
observed and broader
when articles scope. Cumulatively,
were stratified no differences
by access or sentiment, while could
fewer becitations were
observed when observed
articles with
weretitles with by
stratified multiple
access colons, thoughwhile
or sentiment, thesefewer
were citations
much lesswerenumerous, as we
observed withhave titlesshown (Figure 3).
with multiple colons, though these were much less numerous, as we
have shown (Figure We 3).next considered the association of citations with title length or author number.
Although it can be easily observed that studies with exceedingly long titles, over 30 or
40 words, are not cited as much as some studies with shorter titles, the bulk of the studies
in the dataset, with title length below 30 words, have a broad range of citations. We have
plotted the distribution of citations separately for articles and reviews and the pattern
appears quite similar (Figure 4), although research articles show a wider range in title
length than Reviews.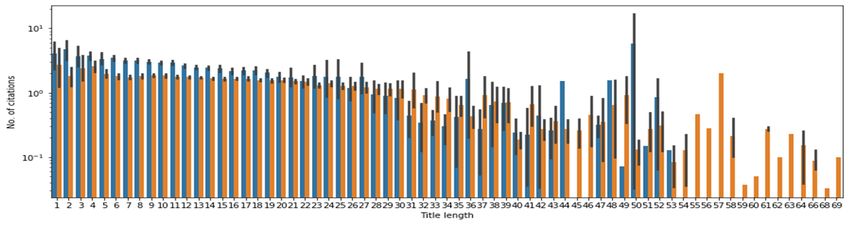
ons 2021, 9,Publications
x FOR PEER 2021, 9, 15
REVIEW 5 of 11 5 of 11
Figure 3. Boxplots representing the number of (normalized) citations in review and original arti-
cles (above, left-hand side), subscription-based and open access publications (above, middle), pub-
lications with negative or positive title sentiment score (above, right-hand side) and citation count
based on the number of colons in the title (below, left-hand side), semicolons (below, middle) or
question marks (below, right-hand side). For all the plots, review papers are indicated in blue and
original articles in orange.
We next considered the association of citations with title length or author number.
Although it can be easily observed that studies with exceedingly long titles, over 30 or 40
Figure 3.
Figure 3. Boxplots representing words, are the
Boxplots representing
the number not cited asofmuch
number
of (normalized) as some
(normalized)
citations studies
citations
in review with
in
and shorter
review
original and titles,
original
articles the bulk
arti-
(above, of the
left-hand studies in
side),
cles (above,
subscription-based and left-hand side),
the
open access subscription-based
dataset, with
publications (above, and open
title middle),
length below access publications
30 words,
publications have(above,
with negative a or
broad middle),
titlepub-
range
positive of citations.
sentiment We have
score
licationsside)
(above, right-hand with and
negative or positive
plotted
citation count title sentiment
the based
distribution ofscore
on the number (above,
citations
of right-hand
separately
colons side)
for
in the title andleft-hand
articles
(below, citation count
and reviews and the pattern
side), semicolons
basedor onquestion
the number of colons inright-hand
the title (below,
side).left-hand side), semicolons (below,are
(below, middle) appears
marks quite
(below, similar (Figure For4),allalthough
the plots, research articlesmiddle)
review papers show or in blue and
a wider range in title
indicated
question marks (below, right-hand side). For all the plots, review papers are indicated in blue and
original articles in orange. length than Reviews.
original articles in orange.
We next considered the association of citations with title length or author number.
Although it can be easily observed that studies with exceedingly long titles, over 30 or 40
words, are not cited as much as some studies with shorter titles, the bulk of the studies in
the dataset, with title length below 30 words, have a broad range of citations. We have
plotted the distribution of citations separately for articles and reviews and the pattern
appears quite similar (Figure 4), although research articles show a wider range in title
length than Reviews.
Figure
Figure 4. Above,
4. Above, left:left: Distribution
Distribution of normalized
of normalized citations
citations by by
titletitle length
length in reviews
in reviews (blue)
(blue) andand original
original articles
articles (orange);
(orange);
right:
right: boxplot
boxplot representing
representing thethe normalized
normalized citation
citation count
count by by quartiles
quartiles of title
of title length
length in reviews
in reviews or original
or original articles.
articles. Below,
Below,
left:left: Distribution
Distribution of normalized
of normalized citations
citations by by author
author count
count in reviews
in reviews (blue)
(blue) andand original
original articles
articles (orange);
(orange); right:
right: boxplot
boxplot
representing
representing the the normalized
normalized citation
citation count
count by quartiles
by quartiles of number
of number of authors
of authors in reviews
in reviews or original
or original articles.
articles.
It appears
It appears thatthat verbose
verbose titles
titles tend
tend to accrue
to accrue fewer
fewer citations,
citations, butbut
thethe same
same relationship
relationship
doesdoes
notnot hold
hold for for shorter
shorter titles,
titles, where where the whole
the whole rangerange of citations
of citations is observed.
is observed. This rela-
This relation
tionreally
is not is notapparent
really apparent
when we when we quartilized
quartilized the datathe
fordata
title for title(Figure
length length (Figure
4). 4).
It was
It was moremore difficult
difficult to observe
to observe a relation
a relation between
between thethe number
number of authors
of authors andand thethe
gure 4. Above, left: Distribution of normalized
number citations
number ofby title length
citations,
of citations, though in areviews
though slight (blue)
a slight and
positive
positive original articles
association
association (orange);
could
could be observed
be observed (Figure
(Figure 4). 4).
ght: boxplot representing the normalized citation count by quartiles of title length in reviews or original articles. Below,
ft: Distribution of normalized citations by 3.3.
author count in
Ensemble reviews (blue) and original articles (orange); right: boxplot
Machines
presenting the normalized citation count by quartiles of number of authors in reviews or original articles.
We decided to evaluate the relative importance of the textual factors on normalized
citations by adopting
It appears that verbose ensemble
titles tend to accruepredictive machines,
fewer citations, namely
but the sameGradient Boosting, Bagging
relationship
and Random Forest.
does not hold for shorter titles, where the whole range of citations is observed. This rela-
These algorithms are based on decision trees, i.e., algorithms that split the data based
tion is not really apparent when we quartilized the data for title length (Figure 4).
on the features provided in order to get homogenous groups, in this case distinguishing
It was more difficult to observe a relation between the number of authors and the
articles with higher and lower citation rates. We first attempted a regression algorithm, i.e.,
number of citations, though a slight positive association could be observed (Figure 4).
an algorithm aiming to predict the number of citations based on the collected features. The
following predictors were considered: sentiment analysis score for the title, presence of a
semicolon, a colon, a question mark, access options, document type, number of authors and
citations by adopting ensemble predictive machines, namely Gradient Boosting, Bagging
and Random Forest.
These algorithms are based on decision trees, i.e., algorithms that split the data based
on the features provided in order to get homogenous groups, in this case distinguishing
Publications 2021, 9, 15
articles with higher and lower citation rates. We first attempted a regression algorithm, 6 of 11
i.e., an algorithm aiming to predict the number of citations based on the collected features.
The following predictors were considered: sentiment analysis score for the title, presence
of a semicolon, a colon, a question mark, access options, document type, number of au-
title
thorslength. Even
and title usingEven
length. parameter
using tuning techniques,
parameter i.e., RandomCV
tuning techniques, search to optimize
i.e., RandomCV search to
the hyperparameters
optimize for the algorithm,
the hyperparameters for the the degree of
algorithm, thefitting
degreeof the regression
of fitting algorithms
of the regression
was very lowwas
algorithms R2 ranged
andvery low andfrom 2% forfrom
R2 ranged a simple linear
2% for regression
a simple to 3.3% of Random
linear regression to 3.3% of
Forest regressor. Interestingly, Gradient Boosting and Random
Random Forest regressor. Interestingly, Gradient Boosting and Random Forest algorithms can also
Forest algorithms
provide a score of importance for the features, which are shown in Figure
can also provide a score of importance for the features, which are shown in Figure 5. 5.
A B
Figure5.5.Feature
Figure Featureimportance
importancefor
for(A)
(A)GradientBoost
GradientBoostregressor
regressorand
and(B)
(B)Random
RandomForest
Forestregressor.
regressor.
As
Asa acomparison,
comparison, wewe also decided
also decidedto use ensemble
to use ensembleclassifiers, withwith
classifiers, the same predictors:
the same predic-
totors:
thisto
purpose, and to simplify the model, normalized citations were binarily
this purpose, and to simplify the model, normalized citations were binarily cate- categorized
asgorized
either as
low (below
either lowthe median)
(below or highor
the median) (above the median).
high (above Table Table
the median). 1 summarizes the
1 summarizes
performance of these algorithms, and Gradient Boosting appears to
the performance of these algorithms, and Gradient Boosting appears to have the highest have the highest
F1F1score.
score.
AAconfusion
confusion matrix for the
matrix for theclassification
classificationbyby Gradient
Gradient Boosting
Boosting cancan be found
be found in in
Figure
Figure A4. The relative weight of the considered factors can be seen in Figure 6. TheThe
A4. The relative weight of the considered factors can be seen in Figure 6. doc-
document
ument type type (Reviews
(Reviews vs.vs. articles)
articles) is,is, maybe
maybe unsurprisingly,the
unsurprisingly, themost
mostrelevant
relevantpredictor
predictorof
ofcitations,
citations,followed
followedby byitsitsaccess
access options
options (whether
(whether open
open access
access oror via
viapaid
paidsubscription),
subscription),
for the Random Forest classifier. The number of authors (which may show some collinearity
for the Random Forest classifier. The number of authors (which may show some colline-
with the publication year, Pearson’s r = 0.17) precedes the title length, which, though it
arity with the publication year, Pearson’s r = 0.17) precedes the title length, which, though
does show some association, does not seem to be playing a major role. The presence of a
it does show some association, does not seem to be playing a major role. The presence of
colon in the title (and even more so of a semi-colon) or the sentiment of the title may also
a colon in the title (and even more so of a semi-colon) or the sentiment of the title may also
have some relevance as predictors.
have some relevance as predictors.
Table 1. Summary of the performance of the algorithms for the classification of the citation rate in
Table 1. Summary of the performance of the algorithms for the classification of the citation rate in the analyzed corpus.
the analyzed corpus.
Algorithm Accuracy Precision Recall F1 Score
Algorithm Accuracy Precision Recall F1 Score
Gradient Boosting 0.599 0.598 0.514 0.552
Bagging Gradient Boosting
0.570 0.599
0.560 0.598 0.483 0.514 0.552
0.519
Bagging 0.570 0.560 0.483 0.519
Random Forest 0.597 0.601 0.479 0.533
Publications 2021, 9, x FOR PEER REVIEW Random Forest 0.597 0.601 0.479 0.533 7 of 11
Logistic Regression 0.590
Logistic Regression 0.583
0.590 0.583 0.517 0.517 0.548
0.548
A B
Figure6.6.Overview
Figure Overviewof
offeature
featureimportance
importancefor
for(A)
(A)GradientBoost
GradientBoostand
and(B)
(B)Random
RandomForest
Forestclassifier.
classifier.
4. Discussion
Citations are a fundamental factor for the scientific community, because they are the
basic metrics that are used to rank research and productivity, and therefore regulate its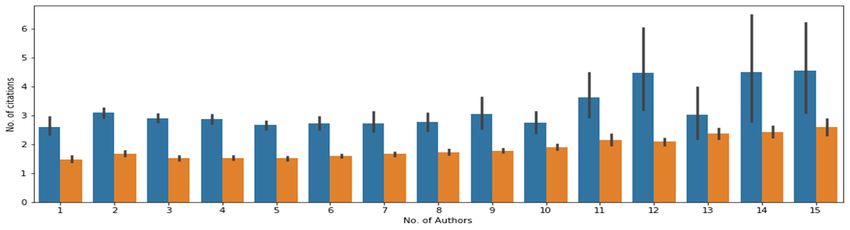
Publications 2021, 9, 15                                                                                              7 of 11

                           4. Discussion
                                 Citations are a fundamental factor for the scientific community, because they are the
                           basic metrics that are used to rank research and productivity, and therefore regulate its
                           policies and funding allocation. Within such an information overload setting as the one life
                           sciences are experiencing [19], publishing an article is not enough to expect the article to be
                           seen and cited. On the other hand, some articles may reach impressive levels of visibility. It
                           appears, therefore, important to investigate the factors that, beside scientific soundness and
                           content relevance, may make the article stand out in a literature search and be downloaded,
                           read and possibly cited, because visibility is key to the spreading of ideas and it may affect
                           novel directions and trends of research.
                                 A lot of research has focused on the effects of title length on citations [20], because
                           titles are what a reader would scan first while searching the literature. The results, however,
                           have been, so far, quite conflicting. An investigation conducted in 22 medical journals
                           (comprising more than 9000 articles) concluded that publications with longer titles are cited
                           more than articles with shorter titles, especially for high impact factor journals [21]. This is
                           in agreement with a research by Jacques et al., which showed a positive correlation between
                           title length and citation number in a small set of most- and least-cited articles in three
                           general medicine journals [22]. Other studies, however, found no association [23], different
                           associations according to the field [24], or, more recently, a negative association, when the
                           20,000 more cited papers for each year in the 2007–2013 period were considered [11].
                                 The present commentary followed a slightly different approach. We focused on articles
                           published in the biomedical field on the specific topic of chronic inflammation. This topic
                           was chosen because of the authors’ domain knowledge, but also because it is broad enough
                           to encompass a vast range of publications across thousands of journals in the biomedical
                           field, and was known and researched since the 19th century. This allowed us to collect a
                           large sample of more than 150,000 articles, or, after excluding those for which no citation
                           was available, with an unusually high number of authors and after limiting our analysis to
                           articles published after 1951, 121,640 articles. Our approach has some limits: it admittedly
                           focuses only on one scientific area, and one topic. By considering articles from such a vast
                           range of years, it may suffer from increased heterogeneity on some predictors. For this
                           reason, the initial dataset, which comprised publications from 1827 to 2021, was reduced to
                           papers appearing in the 1951–2021 interval.
                                 Our initial survey showed a robust association between the genre of the article and the
                           number of citations: unsurprisingly, and consistently with what has already been reported,
                           review articles are usually cited more than research articles [25]. What is more relevant,
                           however, is that reviews in our dataset have significantly shorter titles than original articles.
                           This too is somewhat unsurprising, or at least easily accounted for by the nature of reviews.
                           As they usually encompass broader topics, at least in their narrative version, they often
                           do not require investigation of the details of a single finding, as original articles do, and
                           thus, their titles may often need fewer words. This may in part justify the observation that
                           most-cited articles have shorter titles [11], because many of them happen to be reviews.
                           However, even stratifying by document type, there seems to be some kind of trend for
                           articles with longer titles to have fewer citations, so it may be that that shorter titles are
                           cognitively favored to be easily recognized and read and thus maybe cited.
                                 We then decided to investigate the predictive power of some features associated with
                           the text and its title and relied on ensemble machines Gradient Boosting [26], Bagging [27]
                           or Random Forest [28], both as regressors and as classifiers. These algorithms are based
                           on decision trees and reduce overfitting on training data by running parallel sub-optimal
                           decision trees. In other words, a decision tree could easily find the best splits to divide a
                           dataset in order to eventually obtain homogeneous groups, especially given enough splits,
                           but the solution would be difficult to generalize on different datasets. Thus, sub-optimal
                           trees are used in these algorithms: while each decision tree in these machines is a weak
                           predictor that uses only part of the data, the performance and the bias of the algorithm
                           can be improved by running several of such weak predictors in parallel and by averaging
Publications 2021, 9, 15 8 of 11
their results. When predicting the visibility of a manuscript we decided to avoid using the
citation count, as obtained from the repository, because citations are obviously affected by
the publication year. The same article would have different citation counts if assessed at
different time points after publication and thus time-since-publication is not an intrinsic
quality of a manuscript, but a rather incidental one. Thus, we preferred to use a normalized
citation count, which we obtained by normalizing the number of citations for an article
by the expected average for that year. We could have adjusted for other factors, e.g.,
publication or access type, as is often done, but this would have ended up removing these
factors from the features the ensemble algorithms consider when analyzing the data. Our
goal was to provide these ensemble machines with a series of predictors and let them
compute whether they can explain the observed variability in the distribution of the target
variable and assess the weight each factor has in affecting such a target.
It can be pointed out that the accuracy of these models was quite low, both for the
classifiers and even more so for the regressor algorithms. This means that only a fraction
of the variability in the citation count can be explained by these factors which is not
surprising. Our database did not include any indicator about the novelty of the content
of an article, the prestige of the authors or even the prestige of the journal, scientific and
even just sociological factors that would be normally associated to citing a study. Within
the factors that we did include, however, the type of document has a heavy impact on
citation count and so does the access to the article. The author number, in agreement
with Vieira et al. [3] appears high on the list too, although its distribution does not show
much association with the number of citations, but the result can be accounted for by the
change in author number over time. Title length has some impact but it is overall quite
limited. The presence of colons or sentiment analysis appears less relevant, while the effect
of semicolons or question marks is quite negligible. It must, however, be highlighted that
sentiment analysis was performed with a pre-set sentiment analyzer, albeit a quite popular
one, whose reliability in this context might be limited.
Considering how limited the features we used are, the answers the models provided
are quite interesting. Further textual characteristics could and should be investigated, such
as an analysis of embedding semantics for titles and abstracts, but also abstract length,
article length and of course impact factor. Further efforts should also be made to explore
the role of the originality and relevance of the content, although it is difficult to define and
identify correct metrics for these features.
5. Conclusions
In conclusion, considering the dataset of all the publications since 1951 in the field
of chronic inflammation, indexed in Scopus, several factors appear to be associated with
citation count; although, obviously, no single factor can decide the fate of a publication.
Besides the time passed since its publication, which is necessary for an article to gather
citations, the document type, the access type and the number of authors affect citation
count. Very wordy titles do appear associated to fewer citations, but title length seems to
play a small role in computational models trying to predict citation count.
Author Contributions: Conceptualization, C.G. and S.G.; methodology, C.G.; software, C.G.; formal
analysis, C.G.; investigation, S.G.; resources, S.G.; data curation, C.G.; writing—original draft
preparation, C.G.; writing—review and editing, C.G.; supervision, S.G.; Both authors have read and
agreed to the published version of the manuscript.
Funding: This research received no external funding.
Institutional Review Board Statement: Not applicable.
Informed Consent Statement: Not applicable.
Data Availability Statement: Data available on request due to restrictions.
Conflicts of Interest: The authors declare no conflict of interest.agreed to the published version of the manuscript.
Funding: This research received no external funding.
Funding: This research received no external funding.
Institutional Review Board Statement: Not applicable.
Institutional Review Board Statement: Not applicable.
Informed Consent Statement: Not applicable.
Publications 2021, 9, 15 Informed Consent Statement: Not applicable. 9 of 11
Data Availability Statement: Data available on request due to restrictions.
Data Availability Statement: Data available on request due to restrictions.
Conflicts of Interest: The authors declare no conflict of interest.
Conflicts of Interest: The authors declare no conflict of interest.
Appendix A
Appendix A
Appendix A
Figure A1. Composition of our dataset. Above: number of reviews and original articles (left), number of open access or
Figure A1. Composition
Composition of our dataset. Above: number of
of reviews
reviews and original articles (left), number of
of open access or
subscription papers (middle), number ofAbove: number
publications with negative and originaltitle
or positive articles (left), score
sentiment number open
(right). Below: num-
subscription
subscription papers
papers by(middle),
(middle), number of
numberinofthe publications
publications with negative or positive title sentiment score (right). Below: num-
ber of publications colon number title (left),with negative or
by semicolon positiveor
(middle) title
bysentiment
number ofscore (right).
question Below:
marks number
(right). All
ber
of of publications by colon number in the title (left), by semicolon (middle) or by number of question marks (right).
All All
thepublications
publicationsbyare
colon number
stratified in the title
according to (left),
documentby semicolon (middle)
type, where or by number
blue indicates of question
reviews and orange marks (right).original
indicates the
the publications
publications are stratified
are stratified according
according to document
to document type, where
type, where blue indicates
blue indicates reviewsreviews and orange
and orange indicates
indicates original original
articles.
articles.
articles.
Publications
Figure2021,
A2. 9,
A2. x FOR distribution
Above: PEER REVIEW of title lengths in our dataset for review and articles. Below: distribution
distribution of
of author count.10 of 11
author count.
Figure A2. Above: distribution of title lengths in our dataset for review and articles. Below: distribution of author count.
Blue bars
Blue bars indicate
indicatereviews
reviewsand andorange
orangebars
barsindicate
indicate articles.
articles. The
The length
length of the
of the barbar indicates
indicates the the exact
exact number
number of publica-
of publications
Blue bars indicate reviews and orange bars indicate articles. The length of the bar indicates the exact number of publica-
tions
for forspecific
that that specific
title title length
length or or author
author count count
in ourin our dataset.
dataset.
tions for that specific title length or author count in our dataset.
Appendix B
Appendix B
Figure A3.Boxplots
FigureA3. Boxplotsofofauthor
authornumber
number(left)
(left)and
andtitle
titlelength
length(right)
(right)by
bydocument
documenttype.
type.The
Theplots
plotsshow
showthat
thatreviews
reviewshave
have
significantly
significantlyfewer
fewerauthors
authorsand
andsignificantly
significantlyshorter
shortertitles.
titles.The
Thewhiskers
whiskersofofthe
theplots
plotscorresponds
correspondstoto1.5 × the
1.5× theinterquartile
interquartile
range.
range.Values
Valuesfalling
fallingoutside
outsideofofthis
thisintervals
intervalsare
arerepresented
representedasasblack
blackdots.
dots.Figure
Publications A3.9,Boxplots
2021, 15 of author number (left) and title length (right) by document type. The plots show that reviews have
10 of 11
significantly fewer authors and significantly shorter titles. The whiskers of the plots corresponds to 1.5× the interquartile
range. Values falling outside of this intervals are represented as black dots.
Figure
Figure A4. Confusion matrix A4. Confusion
for Gradient Boosting.matrix for Gradient
The matrix breaksBoosting. The that
down articles matrix breaks
were down
predicted toarticles that or
have a low were
predicted
high citation count and what to have
they were a low
actually or (‘Observed’).
like high citation count and what they were actually like (‘Observed’).
References
References
1.
1. Bai,
Bai, X.;
X.; Liu,
Liu, H.;
H.; Zhang,
Zhang, F.; F.; Ning,
Ning, Z.;
Z.; Kong,
Kong, X.;X.; Lee,
Lee, I.;
I.; Xia,
Xia, F.
F. An
An overview
overview on on evaluating
evaluating and
and predicting
predicting scholarly
scholarly article impact.
article impact.
Information 2017, 8, 73. [CrossRef]
Information 2017, 8, 73, doi:10.3390/info8030073.
2.
2. Bai,
Bai, X.;
X.; Zhang,
Zhang, F.; F.;Lee,
Lee,I.I.Predicting
Predictingthethecitations
citationsof ofscholarly paper.J.J.Informetr.
scholarlypaper. 2019,13,
Informetr.2019, 13,407–418.
407–418,[CrossRef]
doi:10.1016/j.joi.2019.01.010.
3.
3. Bentéjac,
Bentéjac, C.; Csörgő, A.; Martínez-Muñoz, G. A comparative analysis of gradient boostingalgorithms.
C.; Csörgő, A.; Martínez-Muñoz, G. A comparative analysis of gradient boosting algorithms. Artif.
Artif. Intell.
Intell. Rev. 2021, 54,
Rev. 2021, 54,
1937–1967.
1937–1967, [CrossRef]
doi:10.1007/s10462-020-09896-5.
4.
4. Blümel,
Blümel, C.;C.; Schniedermann,
Schniedermann, A. A. Studying
Studying review
review articles
articles in in scientometrics
scientometrics and and beyond:
beyond: A A research agenda. Science
research agenda. 2020, 124,
Science 2020, 124,
711–728. [CrossRef]
711–728, doi:10.1007/s11192-020-03431-7.
5.
5. Borg,
Borg, A.;
A.; Boldt,
Boldt, M.M. Using
Using VADER
VADERsentiment
sentimentand andSVMSVMfor for predicting
predictingcustomer
customer response sentiment. Expert
responsesentiment. Expert Syst.
Syst. Appl. 2020, 162,
Appl. 2020, 162,
113746. [CrossRef]
113746, doi:10.1016/j.eswa.2020.113746.
6. Bornmann,
6. Bornmann, L.; L.; Mutz,
Mutz, R. R. Growth
Growth rates
rates of
of modern
modern science:
science: A A bibliometric
bibliometric analysis
analysis based
based onon the
the number
number of of publications
publications and and cited
cited
references. J. Assoc. Inf. Sci. Technol. 2015, 66, 2215–2222. [CrossRef]
references. J. Assoc. Inf. Sci. Technol. 2015, 66, 2215–2222, doi:10.1002/asi.23329.
7.
7. Breiman,
Breiman, L. L. Random forests. Mach.
Random forests. Mach. Learn. 2001, 45,
Learn. 2001, 45, 5–32.
5–32, [CrossRef]
doi:10.1023/a:1010933404324.
8.
8. Burrell,
Burrell, Q.L.
Q.L. Predicting
Predicting future
futurecitation behavior.J.J.Am.
citationbehavior. Am.Soc.Soc. Informetr.
Informetr. Sci.
Sci. Technol. 2003,54,
Technol.2003, 54,372–378.
372–378, [CrossRef]
doi:10.1002/asi.10207.
9.
9. De
De Rijcke,
Rijcke, S.;
S.; Rushforth,
Rushforth, A. A. To
To intervene
intervene or or not
not to
to intervene;
intervene; isis that
that the
the question?
question? On On the
the role
role of
of scientometrics
scientometrics in in research
research
evaluation. J.J. Assoc.
evaluation. Assoc. Inf.
Inf. Sci. Technol. 2015,
Sci. Technol. 2015, 66,
66, 1954–1958. [CrossRef]
1954–1958, doi:10.1002/asi.23382.
10.
10. Duyx,
Duyx, B.;B.; Urlings,
Urlings, M.J.;
M.J.; Swaen,
Swaen, G.M.;
G.M.; Bouter,
Bouter, L.M.;
L.M.; Zeegers,
Zeegers, M.P.M.P.Scientific
Scientificcitations
citations favor
favor positive
positive results:
results: A
A systematic
systematic review
review
and meta-analysis. J. Clin. Epidemiol. 2017, 88, 92–101. [CrossRef]
and meta-analysis. J. Clin. Epidemiol. 2017, 88, 92–101, doi:10.1016/j.jclinepi.2017.06.002.
11.
11. Egghe,
Egghe, L.L. TheTheHirsch index and
Hirsch related
index andimpact
related impactAnnu.
measures. Rev. Inf.Annu.
measures. Sci. Technol. Inf. 44,
Rev. 2010, Sci.65–114. [CrossRef]
Technol. 2010, 44, 65–114,
12. Eysenbach, G. Citation advantage
doi:10.1002/aris.2010.1440440109. of open access articles. PLoS Biol. 2006, 4, e157. [CrossRef] [PubMed]
13. Génova, G.; Astudillo, H.; Fraga, A. The scientometric bubble considered harmful. Sci. Eng. Ethic. 2016, 22, 227–235. [CrossRef]
[PubMed]
14. Habibzadeh, F.; Yadollahie, M. Are shorter article titles more attractive for citations? Cross-sectional study of 22 scientific journals.
Croat. Med. J. 2010, 51, 165–170. [CrossRef]
15. Ho, Y.-S.; Kahn, M. A bibliometric study of highly cited reviews in the Science Citation Index expanded™. J. Assoc. Informetr. Sci.
Technol. 2014, 65, 372–385. [CrossRef]
16. Hutto, C.J.; Gilbert, E.E. VADER: A parsimonious rule-based model for sentiment analysis of social media text. In Proceedings of
the International AAAI Conference on Web and Social Media, Ann Arbor, MI, USA, 1–4 June 2014; Volume 8.
17. Jacques, T.S.; Sebire, N.J. The impact of article titles on citation hits: An analysis of general and specialist medical journals. JRSM
Short Rep. 2010, 1, 1–5. [CrossRef]
18. Letchford, A.; Moat, H.S.; Preis, T. The advantage of short paper titles. R. Soc. Open Sci. 2015, 2, 150266. [CrossRef]
19. Lovaglia, M.J. Predicting citations to journal articles: The ideal number of references. Am. Sociol. 1991, 22, 49–64. [CrossRef]
20. Mingers, J.; Leydesdorff, L. A review of theory and practice in scientometrics. Eur. J. Oper. Res. 2015, 246, 1–19. [CrossRef]
21. Newman, H.; Joyner, D. Artificial Intelligence in Education; Penstein Rosé, C., Ed.; Springer: Cham, Switzerland, 2018; pp. 246–250.
[CrossRef]
22. Rostami, F.; Mohammadpoorasl, A.; Hajizadeh, M. The effect of characteristics of title on citation rates of articles. Scientometrics
2014, 98, 2007–2010. [CrossRef]
23. Siebelt, M.; Siebelt, T.; Pilot, P.; Bloem, R.M.; Bhandari, M.; Poolman, R.W. Citation analysis of orthopaedic literature; 18 major
orthopaedic journals compared for Impact Factor and SCImago. BMC Musculoskelet. Disord. 2010, 11, 4. [CrossRef] [PubMed]Publications 2021, 9, 15 11 of 11
24. Skurichina, M.; Duin, R.P. Bagging for linear classifiers. Pattern Recognit. 1998, 31, 909–930. [CrossRef]
25. Smith, D.R. Impact factors, scientometrics and the history of citation-based research. Scientometrics 2012, 92, 419–427. [CrossRef]
26. Vieira, E.; Gomes, J. Citations to scientific articles: Its distribution and dependence on the article features. J. Informetr. 2010,
4, 1–13. [CrossRef]
27. Yitzhaki, M. Relation of the title length of a journal article to the length of the article. Scientometrics 2002, 54, 435–447. [CrossRef]
28. Yogatama, D.; Heilman, M.; O’Connor, B.; Dyer, C.; Routledge, B.R.; Smith, N.A. Predicting a scientific community’s response to
an article. In Proceedings of the EMNLP 2011—Conference on Empirical Methods in Natural Language Processing, Edinburgh,
UK, 27–31 July 2011; pp. 594–604.You can also read