Methodology to determine annual permitted take for Metropolitan Adelaide from the River Murray
←
→
Page content transcription
If your browser does not render page correctly, please read the page content below
Methodology to determine
annual permitted take for
Metropolitan Adelaide from
the River Murray

Version: 1.2
Date: 11/02/19
Status: Final

© 2019 SA Water Corporation. All rights reserved. This document may contain
confidential information of SA Water Corporation. Disclosure or dissemination to
unauthorised individuals is strictly prohibited. Uncontrolled when printed or
downloaded.
Methodology to determine annual permitted take for Metropolitan Adelaide from the River Murray        SA Water

Document Controls
Version History
         Version     Date       Author                 Comments
            0.1      22/01/18   Julian Whiting         First draft for comment
            0.2      22/03/18   Julian Whiting         Revised draft for comment
            1.0      23/04/18   Julian Whiting         Final
            1.1      03/01/19   Steve Kotz /           Revised final
                                Ashley Kingsborough
            1.2      01/02/19   Marc Jericho           Revised final
            1.3      11/02/19   Marc Jericho           Revised final

       This document and supporting modelling information is provided only for the purposes of
       demonstrating compliance with the permitted take for metropolitan Adelaide. Permission
       must be sought from SA Water to use for all other purposes.

Version 1.0 14/05/18 Final                                                                          Page 2 of 39
For Official Use Only                                                  Uncontrolled when printed or downloaded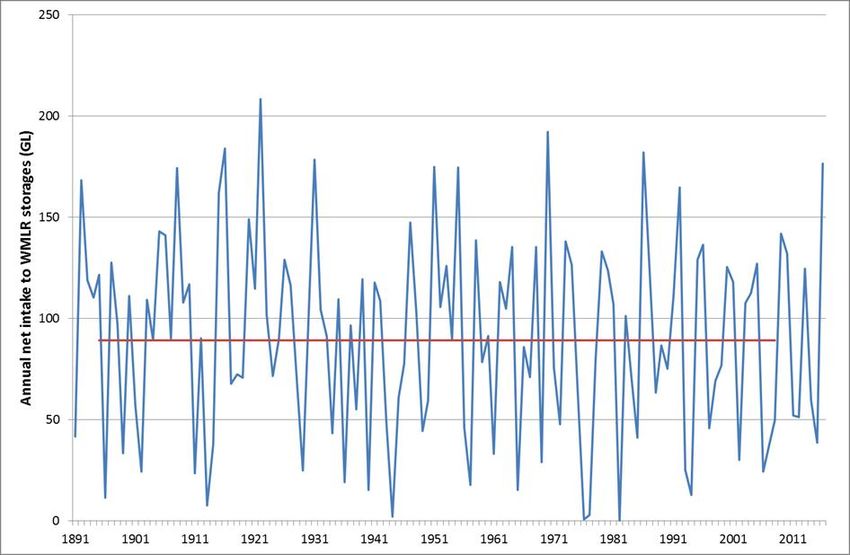
Contents
   1       Introduction ........................................................................................................ 7
   1.1        Objectives ..................................................................................................... 7
   1.2         Outline ........................................................................................................... 7

   2     Background ....................................................................................................... 8
   2.1     Metropolitan Adelaide water supply .......................................................... 8
   2.1.1     Annual permitted take............................................................................. 8
   2.1.2           Annual actual take .................................................................................. 8
   2.2         Modelling metropolitan Adelaide take from the River Murray ................. 9
   2.2.1         Background to the HOMAXP model ........................................................ 9
   2.2.2           Preference of supply source.................................................................. 10

   3       Surface water modelling for WMLR catchments ........................................... 12
   3.1       Modelling overview .................................................................................... 12
   3.2       Available models ........................................................................................ 12
   3.3         Climate data ............................................................................................... 12
   3.4         Intakes to WMLR storages........................................................................... 13

   4       Demand modelling for metropolitan Adelaide ............................................ 15
   4.1         Background ................................................................................................. 15
   4.2         Historical data used for model calibration ............................................... 15
   4.2.1          Monthly demands .................................................................................. 15
   4.2.2          Population data ..................................................................................... 17
   4.3         Climate-adjusted demand model ............................................................ 18

   5     Simulation of annual permitted take ............................................................. 20
   5.1      Input data.................................................................................................... 20
   5.1.1       Modelled demand ................................................................................. 20
   5.1.2       Modelled intakes .................................................................................... 22
   5.1.3           Forecast modelled demands and inflows............................................ 23
   5.1.4           WMLR reservoir target storage levels .................................................... 23
   5.2         Total annual demand ................................................................................. 24
   5.3         Available water from the WMLR storages................................................. 24
   5.3.1          Environmental flows ............................................................................... 24
   5.3.2           Net available intake to WMLR storages ............................................... 26

   6     Calculation of annual permitted take ........................................................... 27
   6.1     Modelling framework.................................................................................. 27
   6.2     Permitted take methodology .................................................................... 27
   6.3     Adjustments to meet metropolitan Adelaide’s long-term average permitted
           take .............................................................................................................. 29
   6.3.1      Impacts of the River Murray Water Allocation Plan ............................ 29
   6.3.2         Adjustment to annual permitted take .................................................. 30
   6.4         Validation of permitted take modelling ................................................... 31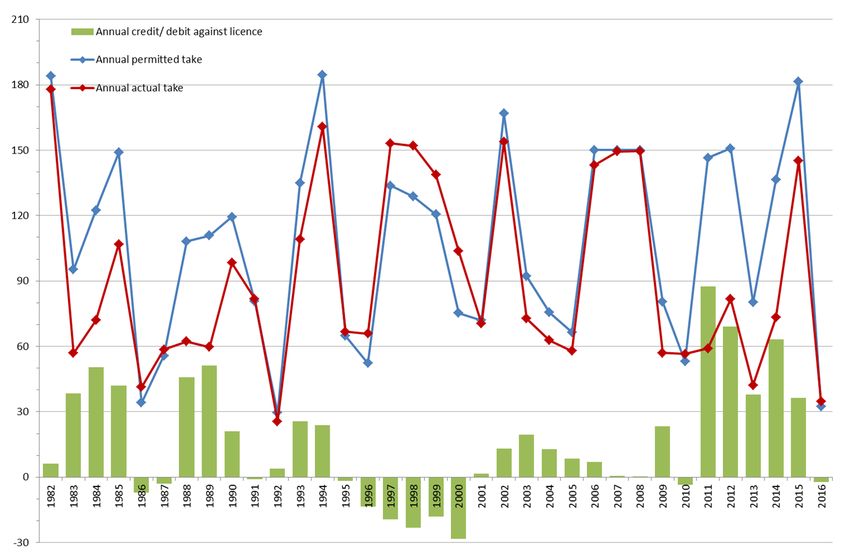
Methodology to determine annual permitted take for Metropolitan Adelaide from the River Murray                                  SA Water

       7       Conclusions...................................................................................................... 33

       8       Abbreviations and acronyms ......................................................................... 34

       9       References ....................................................................................................... 35

       Appendix A              HOMAXP schematic ....................................................................... 36

       Appendix B              Climate data .................................................................................. 37

       Appendix C              Metropolitan Adelaide Licence Area Population data .............. 38

       Appendix D              Environmental flow releases ......................................................... 39

List of figures
       Figure 2.1 Map showing the approximate supply area for metropolitan Adelaide
               licence, with WMLR storages and associated catchment areas, and River
               Murray offtakes ........................................................................................... 11
       Figure 3.1 Time series of total annual natural intakes to the WMLR storages as
               modelled for the 1891–2016 water years, with average values for 1895–2008
               and 2007–2016 shown ................................................................................ 14
       Figure 3.2 Average monthly natural intakes to the nine WMLR storages as modelled
               for the 1891–2016 water years ................................................................... 14
       Figure 4.1 Total monthly demand for the metropolitan Adelaide licence area for July
               2007–June 2017 ........................................................................................... 16
       Figure 4.2 Time series of total monthly demands alongside per capita monthly
               demands for July 2007–June 2017 ............................................................. 17
       Figure 4.3 Time series comparison of observed per capita monthly demand and
               simulated demands from climate-adjusted demand model (2007–2017)19
       Figure 4.4 Comparison between observed and predicted per capita monthly
               demand, with line of best fit shown .......................................................... 19
       Figure 5.1 Monthly proportions of metropolitan Adelaide demand that represent total
               volumes supplied through MW and SRS pipelines .................................... 21
       Figure 5.2 Average monthly third-party demands assumed for HOMAXP simulation 22
       Figure 5.3 Monthly target storage levels for WMLR storages incorporated in HOMAXP
               simulation ..................................................................................................... 23
       Figure 5.4 Total metropolitan Adelaide demand as used in the HOMAXP simulation 24
       Figure 5.5 Total annual environmental flow releases, with average annual release
               under Basin Plan reference period included ............................................ 25
       Figure 5.6 Annual modelled net intakes to WMLR storages with average annual net
               intake under Basin Plan reference period included (red line) ................ 26
       Figure 6.1 Schematic showing relationships between key model components, model
               inputs and model outputs .......................................................................... 27
       Figure 6.2 Annual deviations from average annual climate-adjusted demand for
               metropolitan Adelaide for the Basin Plan reference period (1895–2008)28
       Figure 6.3 Annual deviations from average annual modelled net intake to WMLR
               storages for the Basin Plan reference period (1895–2008) ...................... 29
       Figure 6.4 End-of-year (June) allocations for River Murray irrigators in South Australia30
       Figure 6.5 Annual permitted take shown as deviations from long-term average
               annual take ................................................................................................. 31

Version 1.0 14/05/18 Final                                                                                              Page 4 of 39
For Official Use Only                                                                      Uncontrolled when printed or downloaded
Methodology to determine annual permitted take for Metropolitan Adelaide from the River Murray                             SA Water

       Figure 6.6 Comparison between annual actual take and annual permitted take, with
               credit/debit against metropolitan Adelaide licence .............................. 32

List of tables
       Table 3.1 Summary of natural intakes to the nine WMLR storages as modelled in
               WaterCress for the 1891–2016 water years ............................................... 13
       Table 4.1 Average annual demands supplied by the various distribution nodes in the
               metropolitan Adelaide network (July 2007–June 2017)........................... 16
       Table 4.2 Summary of regression model for climate-adjusted demands ............ 18
       Table 5.1 Proportions of total River Murray extractions through the MW and SRS
               pipelines to be assigned to country demand nodes in HOMAXP ............ 21
       Table 5.2 Average annual natural intakes to WMLR systems ................................ 22
       Table 5.3 Average annual metropolitan Adelaide demand used for HOMAXP
               simulation ..................................................................................................... 24
       Table 5.4 Average annual net intakes to WMLR storages as modelled in HOMAXP26

Version 1.0 14/05/18 Final                                                                                           Page 5 of 39
For Official Use Only                                                                   Uncontrolled when printed or downloaded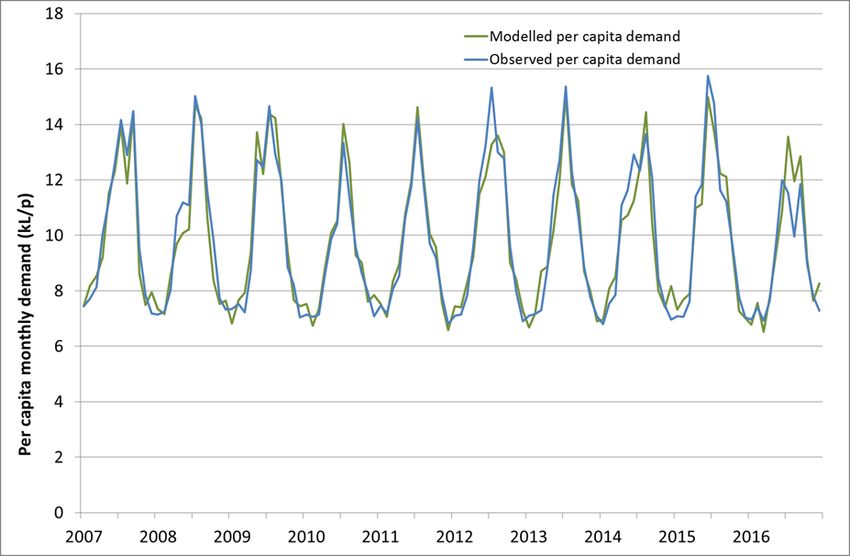
Methodology to determine annual permitted take for Metropolitan Adelaide from the River Murray      SA Water

Executive Summary

       The River Murray is a significant source of potable water for metropolitan Adelaide, supplying
       up to 90 per cent of total demand in dry years. Diversions from the River Murray for
       consumptive use in metropolitan Adelaide form part of total take from the surface water
       Sustainable Diversion Limit (SDL) resource unit SS11 (South Australian Murray), as defined in the
       Murray–Darling Basin Plan (the Basin Plan), with a long-term average diversion limit of
       100 Gigalitres per annum (GL/a).

       The methodology for the Implementation of the Sustainable Diversion Limit for the full South
       Australian Murray SDL Resource Unit (SS11) is documented in DEW (2019). A methodology to
       calculate annual permitted take for the metropolitan Adelaide component is presented in
       this report. This methodology accounts for annual variability both in demand across the
       Metropolitan Adelaide Water Supply System (MAWSS) and natural intakes to the Western Mt
       Lofty Ranges (WMLR) storages. Natural intakes to storages in the WMLR are the preferred
       (lowest-cost) source of supply to metropolitan Adelaide.

       Annual permitted take for metropolitan Adelaide represents the quantity of water that is
       permitted to be taken from the River Murray for consumptive use in metropolitan Adelaide
       during a water accounting period, depending on climatic conditions experienced in the
       period.

       The methodology presented includes a climate-adjusted model of total demand in
       metropolitan Adelaide alongside hydrological models to simulate intakes to WMLR storages.
       Permitted take for metropolitan Adelaide is therefore assumed to be the component of the
       annual climate-adjusted demand that is not met from intakes captured by WMLR storages in
       that year. In addition, adjustments are included to account for historical allocation levels for
       River Murray diversions in South Australia, and to ensure a long-term average permitted take
       of 100 GL/a across the 1895–2009 Basin Plan reference period.

       This document and supporting modelling information is provided only for the purposes of
       demonstrating compliance with the permitted take for metropolitan Adelaide. Permission
       must be sought from SA Water to use this document and the information it contains for all
       other purposes.

Version 1.0 14/05/18 Final                                                                        Page 6 of 39
For Official Use Only                                                Uncontrolled when printed or downloaded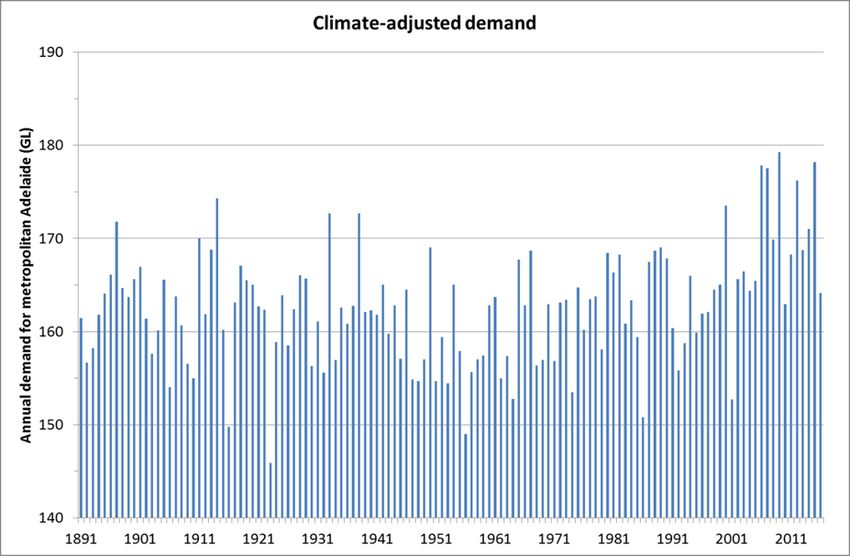
Methodology to determine annual permitted take for Metropolitan Adelaide from the River Murray SA Water
1 Introduction
1.1 Objectives
The objective of this report is to describe the modelling of annual permitted take from the
River Murray for consumptive use in metropolitan Adelaide. The methodology for the
Implementation of the Sustainable Diversion Limit for the full South Australian Murray SDL
Resource Unit (SS11) is documented in DEW (2019).
Metropolitan Adelaide’s take from the River Murray forms one component of surface water
take for consumptive use from the South Australian Murray (SS11) Sustainable Diversion Limit
(SDL) resource unit. This document describes the long-term diversion limit, and the
methodology used to determine annual permitted take for metropolitan Adelaide under the
Murray–Darling Basin Plan (the Basin Plan).
This report presents a methodology to determine the modelled component of annual
permitted take in a manner that meets the requirements of s10 of the Basin Plan and further
details presented in Position Statement 3C Method for Determining Take (Murray–Darling
Basin Authority (MDBA), 2015), and Position Statement 3E Interpretation of Annual Permitted
Take (MDBA, 2017).
1.2 Outline
This document includes:
background information on model development for the Metropolitan Adelaide Water
Supply System (MAWSS)
an overview of the surface water modelling approach adopted to determine natural
intakes to storages in the Western Mt Lofty Ranges (WMLR) that support metropolitan
Adelaide
description of models for consumptive demand in metropolitan Adelaide
description of model input data
summary of results of model simulations.
Version 1.0 14/05/18 Final Page 7 of 39
For Official Use Only Uncontrolled when printed or downloaded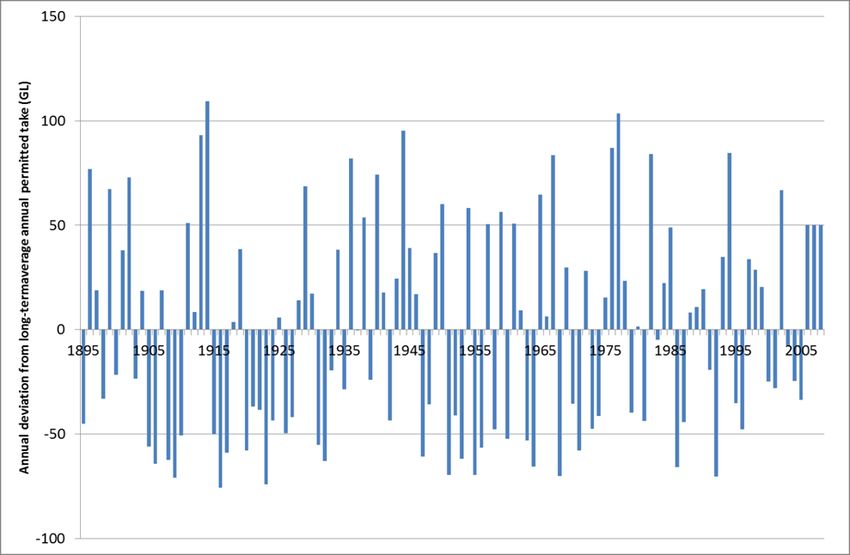
Methodology to determine annual permitted take for Metropolitan Adelaide from the River Murray SA Water
2 Background
2.1 Metropolitan Adelaide water supply
Since the use of River Murray water to supplement the Metropolitan Adelaide Water Supply
System (MAWSS) commenced in the 1950s, the order of preference for Adelaide’s supply,
from a volumetric perspective, has been:
1. Natural intakes to the Western Mt Lofty Ranges (WMLR) storages
2. Metropolitan Adelaide entitlement from the River Murray.
2.1.1 Annual permitted take
Annual permitted take for a sustainable diversion limit (SDL) resource unit represents the
maximum quantity of water permitted to be taken by each form of take for consumptive use
from the SDL resource unit (s6.10 of the Basin Plan). Metropolitan Adelaide represents one
form of take within the South Australian Murray (SS11) SDL resource unit.
For each surface water SDL resource unit, s10.10 of the Basin Plan requires the water resource
plan to set out the method to determine annual permitted take after the end of each water
accounting period, having regard to the water resources available during the accounting
period.
The quantity of water diverted from the River Murray for consumptive use in metropolitan
Adelaide in any water accounting period will depend on the water resources available from
the WMLR storages in that year, and the total consumptive demand from the MAWSS. Local
climate variability will influence both demand from metropolitan Adelaide and natural
intakes to the WMLR storages. Metropolitan Adelaide’s long-term average permitted take
under the Cap on Diversions was an average of 130 GL/a (650 GL over five years).
Water availability in the Mt Lofty Ranges varies significantly depending on the climate, and as
such metropolitan Adelaide’s long-term average demand from the River Murray is sensitive to
the rainfall and temperature time series used to calculate the average demand from the
River Murray.
The methodology presented delivers a long-term average permitted take of 100 GL/a across
the 1895–2009 Basin Plan reference period. Using a different climate subset from within the
historical record, and per capita demands observed before the implementation of
permanent water wise measures and water security programs, metropolitan Adelaide’s
average demand from the River Murray would exceed 105 GL/a.
This document outlines the methodology to determine the volume permitted to be taken for
consumptive use in metropolitan Adelaide, such that the long-term average annual diversion
limit for metropolitan Adelaide is not exceeded.
2.1.2 Annual actual take
Annual actual take for an SDL resource unit represents the maximum quantity of water
actually taken by each form of take for consumptive use from the SDL resource unit (s6.10 of
the Basin Plan).
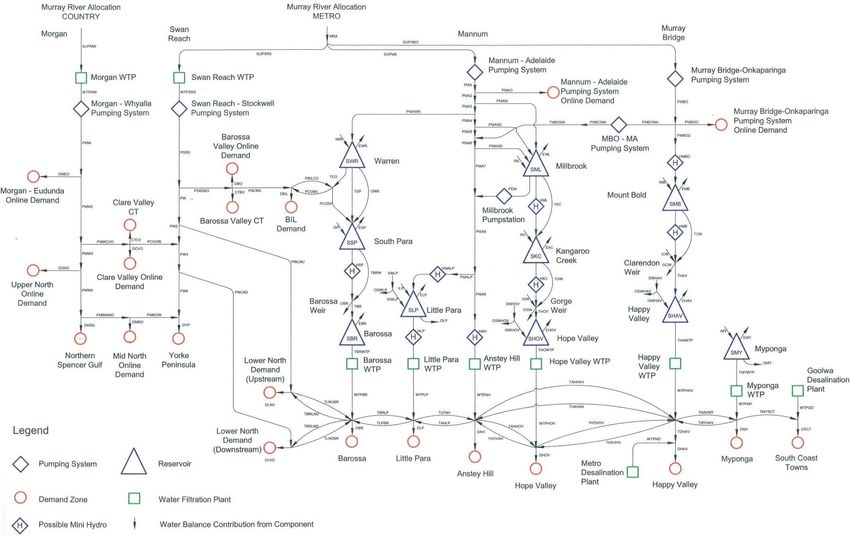
Actual take for metropolitan Adelaide (and associated country areas) is the volume of water
diverted from the River Murray for consumptive use through the Swan Reach–Stockwell (SRS),
Mannum–Adelaide (MA), and Murray Bridge–Onkaparinga (MBO) pipelines.
The locations of the SRS, MA and MBO pipelines with respect to metropolitan Adelaide and
the WMLR storages are summarised in Figure 2.1.
Version 1.0 14/05/18 Final Page 8 of 39
For Official Use Only Uncontrolled when printed or downloaded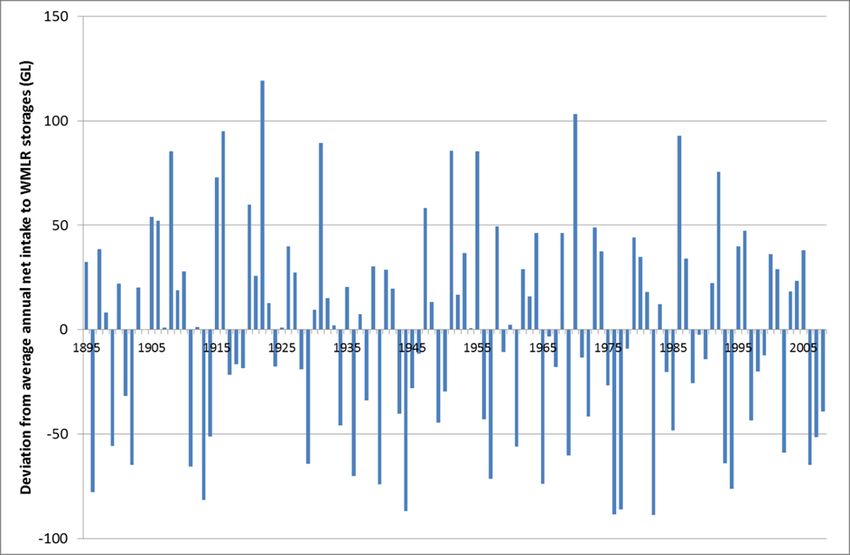
Methodology to determine annual permitted take for Metropolitan Adelaide from the River Murray SA Water
2.2 Modelling metropolitan Adelaide take from the River
Murray
An essential component of the Water Resource Plan for the South Australian Murray (SS11)
SDL resource unit is the simulation of bulk water transfers through the MAWSS to establish the
long-term annual diversion limit for metropolitan Adelaide diversions from the River Murray for
consumptive use.
The total volume diverted from the three major River Murray extraction locations for the
metropolitan Adelaide licence (Swan Reach, Mannum and Murray Bridge) is a function of:
the demand (and its timing) from the MAWSS; the timing and volume of WMLR catchment
yields; the physical capacity of components of the system; and the structure of electricity
tariffs for pumping throughout the year. Consequently, the determination of monthly
diversions from the River Murray involves analysis of various data including harvestable
reservoir catchment yields, consumptive demands from metropolitan Adelaide, monthly
pumping capacity and costs, and climate information including rainfall and temperature
data.
A 2002 investigation for the Murray–Darling Basin Commission (Tonkin Consulting, 2002) to
determine the monthly River Murray diversions required by metropolitan Adelaide during
1891–2000 under both 1994 and 2001 ‘Levels of Development’ used the ‘Headworks
Optimisation Model – Adelaide’ (HOMA) modelling package to simulate the planning and
operational decisions that are involved in bulk water transfers across the MAWSS. The HOMA
modelling package was subsequently updated and expanded to the HOMAXP package
(Tonkin Consulting, 2006), and this remains the best available model of bulk water transfers
throughout the metropolitan Adelaide water supply headworks system.
2.2.1 Background to the HOMAXP model
SA Water uses HOMAXP as a planning tool for the metropolitan Adelaide water supply
headworks system. HOMAXP is a monthly time-step model comprising a suite of computer
programs. It has been designed, written and tested to assist in the planning and operation of
the metropolitan Adelaide headworks system, initially comprising the WMLR catchments and
pipelines from the River Murray.
HOMAXP identifies an ‘optimal pumping strategy’ associated with the operation of the system
while satisfying a set of operating rules. Aspects of the operation of the headworks system
that HOMAXP takes into account include:
reservoir maximum storage capacities
monthly reservoir evaporation losses (as a function of reservoir storage volume)
monthly transfer and pipeline capacities
monthly estimated pump cost-curves
monthly minimum reservoir target storage levels
monthly forecast reservoir inflows
monthly forecast demands.
HOMAXP uses a mathematical optimisation technique known as linear programming. Detailed
information describing the initial formulation and development of the HOMAXP model, its input
parameters and modes of operation are provided by Crawley (1990) and Crawley and
Dandy (1992).
Monthly pump-cost curves have been derived and included in the model for each of the
metropolitan Adelaide pipelines. Each of the monthly curves includes the following factors:
pump start-up and shutdown losses
Version 1.0 14/05/18 Final Page 9 of 39
For Official Use Only Uncontrolled when printed or downloaded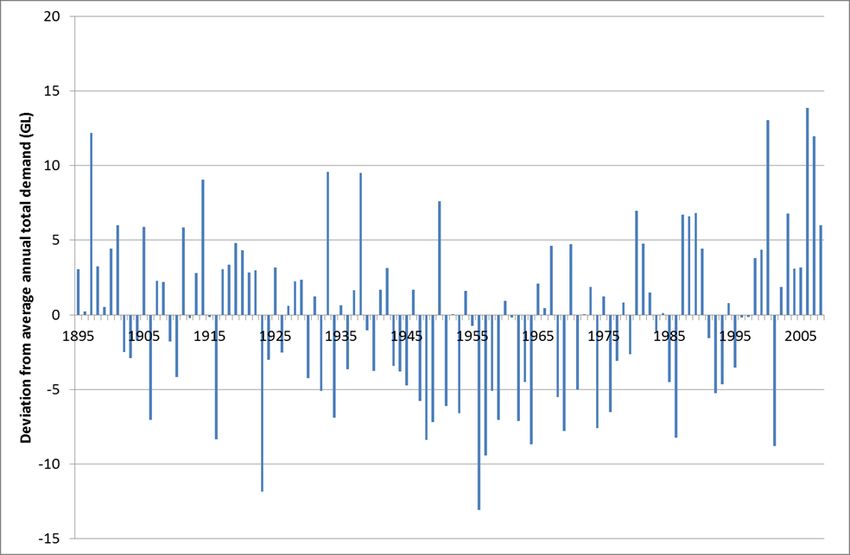
Methodology to determine annual permitted take for Metropolitan Adelaide from the River Murray SA Water
different pump combination rates and efficiencies
pipeline friction losses.
The monthly pump-cost curves used in HOMAXP are based on the energy usage charge
component of SA Water’s bulk water pumping tariff. For the calculation of the long-term
annual diversion limit, HOMAXP was used in its ‘Planning-Forecast’ mode. In this mode,
HOMAXP can be used to simulate the monthly operation of the headworks system. The model
is given only the information that would have been available to the Operations System
Controller in the actual operation of the system.
An optimum operating program is obtained for the system at a particular point in time and
the determined program for the coming month is assumed to be adopted. Monthly forecast
inflows and demands are replaced with ‘actual’ figures, and a new formulation of the linear
programming model is constructed for the remaining months in the water year under
consideration. The model ‘steps through’ a period of records (either historical or synthetic) in
this manner and can be used to simulate the behaviour of the system, including the operator
decision-making process.
Although the sequence of monthly intakes and demands is generally modelled to reflect
specific conditions in the system, and may not necessarily represent historical observed data,
HOMAXP uses the terminology ‘Actual Inflows’ and ‘Actual Demands’, to differentiate these
from the sequences of 12 monthly forecast values.
HOMAXP has been used, refined and enhanced in SA Water for more than 20 years and has
been accepted as a useful and reliable operational and planning tool for the operation of
the metropolitan Adelaide water supply headworks system. A schematic of the MAWSS as
used in HOMAXP is included in Appendix A.
2.2.2 Preference of supply source
An important feature in the simulation of HOMAXP is the order of preference that is assumed
for the water supply sources that are available to the MAWSS. The model is configured so that
yield from WMLR catchments is the preferred source of supply over River Murray water
pumped into the WMLR storages. Optimisation within HOMAXP is driven through minimising
costs within the physical infrastructure constraints, so it is necessary to adopt unit supply costs
for each water supply source. The order of preference for the two supply sources is
encapsulated in HOMAXP through unit costs for water produced from the various water
treatment plants and variable pumping costs for the Swan Reach–Stockwell, Mannum–
Adelaide and Murray Bridge–Onkaparinga pipelines from the River Murray.
It is not essential for costs assumed in the HOMAXP model to be ‘real-world’ costs, as the
relative difference between the supply costs from the various sources is sufficient for the
model to ‘choose’ the optimal source of water to maintain supply to the MAWSS. For
example, if, during the HOMAXP simulation, there are periods of a high probability of
significant inflows into WMLR storages that are likely to be sufficient to meet demands, the
optimal (lowest-cost) option would be to reduce the diversions made from the River Murray.
Version 1.0 14/05/18 Final Page 10 of 39
For Official Use Only Uncontrolled when printed or downloadedMethodology to determine annual permitted take for Metropolitan Adelaide from the River Murray SA Water
Figure 2.1 Map showing the approximate supply area for metropolitan Adelaide licence, with
WMLR storages and associated catchment areas, and River Murray offtakes
Version 1.0 14/05/18 Final Page 11 of 39
For Official Use Only Uncontrolled when printed or downloadedMethodology to determine annual permitted take for Metropolitan Adelaide from the River Murray SA Water
3 Surface water modelling for WMLR catchments
This section provides an overview of the hydrological modelling approach that was used to
determine intakes to storages in the Western Mt Lofty Ranges (WMLR) that are operated by
SA Water for water supply to metropolitan Adelaide.
3.1 Modelling overview
Hydrological models built to simulate intakes to WMLR storages represent interactions
between the various surface water components of the hydrologic cycle (rainfall,
interception, evaporation, infiltration, surface runoff, groundwater recharge, streamflow and
baseflow), at a catchment scale. The interaction processes are represented by
mathematical functions built into the model. Hydrological models are typically built to
simulate catchment conditions, to generate long-term data and to enhance understanding
of the hydrological processes within catchments.
Hydrological models for catchments in the WMLR are rainfall-runoff catchment-scale water
balance models, built in the Water Community Resource Evaluation and Simulation System
(WaterCress) modelling platform (Cresswell, 2002), which incorporates some of the most
widely used rainfall-runoff models in Australia (including AWBM, Simhyd, HYDROLOG, and WC-
1). Simulated inflows developed from these rainfall-runoff models were used extensively in
development of water allocation plans (WAPs) in the Mount Lofty Ranges by the Adelaide
and Mount Lofty Ranges Natural Resources Management Board.
WaterCress models are constructed as a series of nodes that are linked on the basis of
drainage direction to form one major catchment. Each model node includes one of the
following components:
catchment characteristics – including rural and urban catchment areas
storages – including reservoirs, aquifer, tank and dam (on-stream and off-stream) storages,
including functionality to allow the passage of baseflow
transfer infrastructure – including weirs and routing components
treatment processes – including sewage treatment works and wetlands
demand – including urban and rural demands.
The variability in hydrological response across a catchment is incorporated in a WaterCress
model through catchment parameters to represent variability of soil type and land use, and
the use of various point rainfall data to reflect its spatial variability.
3.2 Available models
WaterCress models for the five WMLR systems (South Para, Little Para, Torrens, Onkaparinga
and Myponga) were most recently calibrated in 2011 using flows and climatic conditions
recorded during 1990–2010. These calibrated models (described in Richard Clark and
Associates, 2013) represent catchment behaviour at year 2010 (including farm dam and
irrigation developments) but remain the best available catchment models.
3.3 Climate data
The five WaterCress models for the WMLR systems use daily rainfall and evaporation data
from 22 different sites. These sites are detailed in Appendix B. These data are obtained from
the Queensland Government’s enhanced climate database SILO (Scientific Information for
Land Owners) and are available from 1889 to the present day. These data are part of the
Patched Point Dataset, which has been disaggregated and infilled using the methods
described in Jeffrey et al. (2001), meaning that it is a complete dataset with no missing days.
The use of SILO data is consistent with the approach used for water resource investigations
Version 1.0 14/05/18 Final Page 12 of 39
For Official Use Only Uncontrolled when printed or downloadedMethodology to determine annual permitted take for Metropolitan Adelaide from the River Murray SA Water
across other agencies of the Government of South Australia (e.g. Alcorn, Savadamuthu and
Murdoch, 2008).
3.4 Intakes to WMLR storages
Time series of natural intakes to WMLR storages were required to determine annual permitted
take from the River Murray for metropolitan Adelaide. The WaterCress models for the five
WMLR systems were used to calculate the impact of the observed climate on available water
resources from the WMLR during each water accounting period. These natural intakes to the
nine WMLR storages across these five systems were subsequently used as inputs to the
HOMAXP model (termed ‘Actual Inflows’).
Using the previously calibrated WaterCress models, natural intakes across the five WMLR
systems were simulated across the 126-year period (1891–2016), with results of the simulations
summarised in Table 3.1.
Table 3.1 Summary of natural intakes to the nine WMLR storages as modelled in WaterCress for
the 1891–2016 water years
System WMLR storage Upstream Annual average Annual std dev
catchment (ML) (ML)
area (Ha)
South Para South Para Reservoir 10,786 11,244 8,319
Warren Reservoir 11,826 10,894 8,629
Little Para Little Para Reservoir 8,185 7,814 5,591
Torrens Millbrook Reservoir 22,996 21,960 16,814
Kangaroo Creek 5,474 7,427 4,864
Reservoir
Gorge Weir 5,669 8,943 5,867
Onkaparinga Mt Bold Reservoir 38,358 52,936 29,783
Clarendon Weir 5,765 6,121 3,700
Myponga Myponga Reservoir 12,183 15,966 9,030
Total intake 143,307 87,207
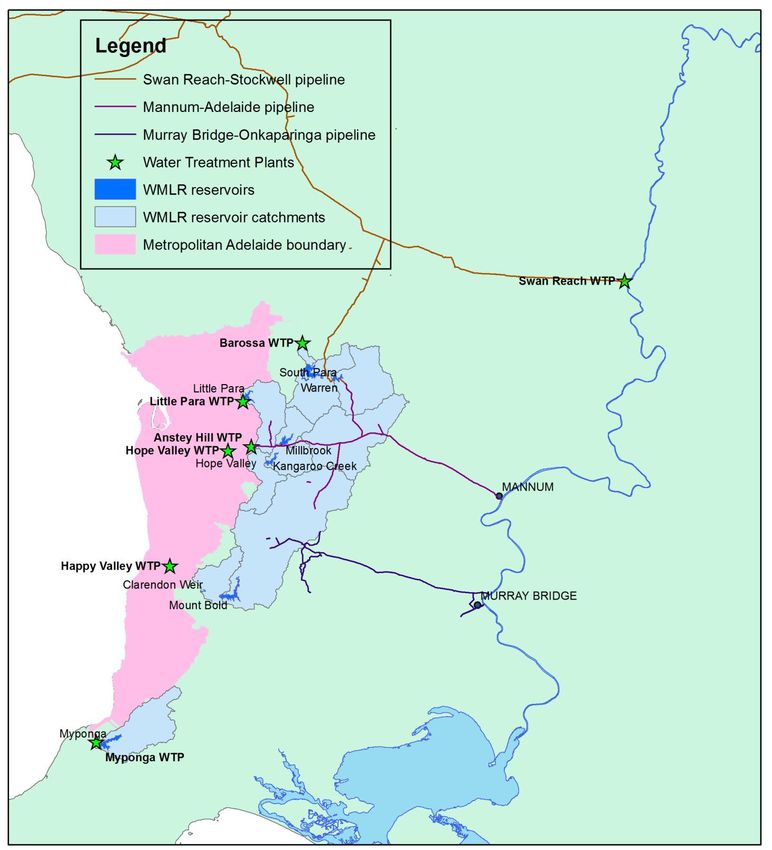
Figure 3.1 shows the time series of annual total intakes to WMLR storages for the 1891–2016
water years. The red line shows the average annual intake to the WMLR storages for 1895–
2008 water years (142.3 GL). For illustration of recent climatic conditions, the green line shows
the average annual modelled intakes for the past 10 years (2007–2016 water years), which is
approximately 13 GL/a lower (129 GL).
It should be noted that these annual intakes represent total intakes from the contributing
catchments, and do not represent the ‘usable’ volumes available to the Metropolitan
Adelaide Water Supply System (MAWSS) after accounting for environmental flows, spill and
evaporative losses from the WMLR storages. Total ‘usable’ intakes for the model period were
determined from the HOMAXP model.
Version 1.0 14/05/18 Final Page 13 of 39
For Official Use Only Uncontrolled when printed or downloadedMethodology to determine annual permitted take for Metropolitan Adelaide from the River Murray SA Water
Figure 3.1 Time series of total annual natural intakes to the WMLR storages as modelled for the
1891–2016 water years, with average values for 1895–2008 and 2007–2016 shown
Figure 3.2 shows the average monthly total intakes to the nine storages across the five WMLR
systems, as modelled in WaterCress for the 1891–2016 simulation period.
Figure 3.2 Average monthly natural intakes to the nine WMLR storages as modelled for the
1891–2016 water years
Version 1.0 14/05/18 Final Page 14 of 39
For Official Use Only Uncontrolled when printed or downloadedMethodology to determine annual permitted take for Metropolitan Adelaide from the River Murray SA Water
4 Demand modelling for metropolitan Adelaide
This section describes a climate-adjusted model for potable water demands in metropolitan
Adelaide that was used to determine demand for each water accounting period, based on
observed climatic conditions.
4.1 Background
A climate-adjusted demand model was developed as a multivariate linear regression model
of per capita monthly demands in the metropolitan Adelaide licence area. This licence area
represents the geographical area that is supplied with water from the River Murray under SA
Water’s licence for metropolitan Adelaide, i.e. River Murray water supplied through the Swan
Reach–Stockwell (SRS), Mannum–Adelaide (MA) and Murray Bridge–Onkaparinga (MBO)
pipelines, minus water supplied from these pipelines to third-party users (as per Figure 2.1). It
does not include water supplied to the Country Towns licence area or water extracted from
the Eastern Mt Lofty Ranges (EMLR) Water Resource Plan area. The climate-adjusted demand
model was used to simulate a 126-year sequence of monthly demands from metropolitan
Adelaide for input to the HOMAXP model, in order to calculate long-term average annual
extractions from the River Murray.
4.2 Historical data used for model calibration
4.2.1 Monthly demands
Historical monthly demands for potable water in the metropolitan Adelaide licence area
were calculated from SA Water master meter data for the ten-year period July 2007 to June
2017. The metropolitan Adelaide licence area is supplied with potable water from six water
treatment plants (WTPs) in greater Adelaide (Barossa, Little Para, Hope Valley, Anstey Hill,
Happy Valley and Myponga) and as ‘online’ demands from the major River Murray pipelines.
The WTPs in greater Adelaide are supplied with both natural intakes to the Western Mt Lofty
Ranges (WMLR) storages, and water extracted from the River Murray. Online demands from
the major pipelines include areas in the Adelaide Hills, and the EMLR that are outside the
Metropolitan Adelaide Water Supply System (MAWSS). In most years, the SRS pipeline does
not supply River Murray water to the WMLR storages, such that all volumes extracted from the
River Murray through the SRS pipeline are supplied directly to meet potable water demands.
Table 4.1 summarises average annual historical demands for the various components of
metropolitan Adelaide demand.
Version 1.0 14/05/18 Final Page 15 of 39
For Official Use Only Uncontrolled when printed or downloadedMethodology to determine annual permitted take for Metropolitan Adelaide from the River Murray SA Water
Table 4.1 Average annual demands supplied by the various distribution nodes in the
metropolitan Adelaide network (July 2007–June 2017)
Demand nodes (WIZ data) Average annual historical demand
(2007–2017)
Barossa WTP 11,989 ML
Little Para WTP 10,790 ML
Hope Valley WTP 17,203 ML
Anstey Hill WTP 26,365 ML
Happy Valley WTP (includes ADP volumes) 73,757 ML
Myponga WTP 5,122 ML
SRS pipeline extractions (excludes transportation 8,109 ML
of 3rd party water and supply to WMLR storages)
MA pipeline ‘online’ demands 768 ML
MBO pipeline ‘online’ demands 9,661 ML
Total demand 163,763 ML
Desalinated water from the Adelaide Desalination Plant (ADP) is pumped along an
11 kilometre transfer pipeline to storage tanks at the Happy Valley WTP, where it is blended
with treated water from the reservoir to supply the MAWSS. The average demand for Happy
Valley WTP in Table 4.1 includes volumes supplied to the MAWSS from the ADP since July 2011.
Since that time, 144 GL have been supplied from the ADP (November 2018). Now fully
commissioned, the service life and value of the ADP are maximised by switching to a
minimum production mode when other water sources are available. This can be for around
nine months of the year, contributing approximately 4 GL annually. For the remaining three
months of the year, when demand is typically low during wetter periods, it operates in
standby mode. Figure 4.1 shows total monthly demands for metropolitan Adelaide for July
2007–June 2017.
Figure 4.1 Total monthly demand for the metropolitan Adelaide licence area for July 2007–
June 2017
Version 1.0 14/05/18 Final Page 16 of 39
For Official Use Only Uncontrolled when printed or downloadedMethodology to determine annual permitted take for Metropolitan Adelaide from the River Murray SA Water
4.2.2 Population data
The impact of population growth in the metropolitan Adelaide area on historical increases in
potable water demand was accounted for through the development of a climate-adjusted
model of per capita demands. Historical population for the Adelaide licence area was
assessed using estimated resident population (ERP) figures, at a local government area (LGA)
scale, as published by the Australian Bureau of Statistics (ABS). The ABS publishes ERP data as
at 30 June each year, with the LGA scale being the smallest spatial resolution provided.
Appendix C summarises the ERP at 30 June 2016 for each LGA that was assumed to be within
the geographical boundary of the metropolitan Adelaide licence area. The proportions of
some regional LGAs within the area potentially supplied with River Murray water under the
metropolitan Adelaide licence were estimated for this purpose.
The metropolitan Adelaide licence area ERP was calculated for 30 June each year between
2007 and 2017. The total ERP was assumed to increase at a constant rate throughout each
year, determined from the total annual population calculated at 30 June in successive years,
in order to produce a time series of total population for the metropolitan Adelaide licence
area at a monthly scale. It was assumed that the rate of growth for population in
metropolitan Adelaide for the 12 months following 30 June 2016 would match the rate of
growth recorded in the year preceding. Monthly estimates of total population were then
used to produce a series of monthly per capita demands for metropolitan Adelaide.
Figure 4.2 shows total monthly demands alongside per capita demands for the metropolitan
Adelaide area for the period July 2007–June 2017. The relationships between the latter and
climatic predictors were investigated for the climate-adjusted demand model. It should be
noted that the sequence of per capita demands does not represent only the residential
component of water use in metropolitan Adelaide; rather, it represents a ratio of total
demand (including residential, commercial and other non-residential uses) to estimated
population in the metropolitan Adelaide licence area.
Figure 4.2 Time series of total monthly demands alongside per capita monthly demands for
July 2007–June 2017
Version 1.0 14/05/18 Final Page 17 of 39
For Official Use Only Uncontrolled when printed or downloadedMethodology to determine annual permitted take for Metropolitan Adelaide from the River Murray SA Water
4.3 Climate-adjusted demand model
For the development of the climate-adjusted demand model, climatic data for Adelaide
were obtained from the Scientific Information for Land Owners (SILO) database and the
Bureau of Meteorology to be analysed as potential predictor variables for per capita
demand. A range of climatic predictor variables was analysed to determine the most
appropriate model of per capita demands to end June 2017.
The final climate-adjusted demand model was based on a regression of per capita monthly
demands for metropolitan Adelaide against monthly rainfall (measured at Kent Town, SA)
and the sum of cooling degree days (CDD18) each month for the 10-year period from July
2007 to June 20171.
This climate-adjusted demand model is presented in Equation 1:
Monthly per capita demands (kL/p) = 8.389 + 0.029 x CDD18 – 0.014 x Rainfall (Eq. 1)
Where: Rainfall = monthly rainfall (mm) recorded at Kent Town (site no. 023090)
CDD18 = Sum of CDD18 for a given month (oC)
Table 4.2 summarises the statistical indicators for this final demand model, which had an
adjusted R-squared value of 0.923.
Table 4.2 Summary of regression model for climate-adjusted demands
Coefficient Std. error T-statistic P-value
Intercept 8.3888 0.1654 50.722 1.69E-81
CDD18 0.0294 0.0010 28.933 3.77E-55
Rainfall -0.0143 0.0024 6.023 2.033E-08
Figure 4.3 provides a comparison between observed per capita monthly demands for
metropolitan Adelaide, and predictions from the climate-adjusted demand model for the 10-
year period July 2007 to June 2017. Figure 4.4 summarises the fit of the simulated demands
from the climate-adjusted demand model against observed data for the 2007–2017
calibration period.
The climate-adjusted demand model (shown in Eq.1) was used to generate a long-term
sequence of monthly demands from metropolitan Adelaide, using historical rainfall and
temperature data. The multiplication of these simulated monthly per capita demands by the
estimated population at 30 June 2017 (1,461,840, based on recorded ERP of 1,450,335 at
30 June 2016) generated a sequence of modelled demands. These modelled demands were
then used as input data for a simulation of the MAWSS under historical climate conditions with
HOMAXP, as detailed in Section 5.
1Cooling Degree Days (CDD18) are based on daily temperature observations. CDD are based on the monthly sum of
values calculated as:
The average daily temperature [i.e. (max. daily temperature + min. daily temperature) / 2]
The difference between the average daily temperature and the base temperature of 18 oC
Version 1.0 14/05/18 Final Page 18 of 39
For Official Use Only Uncontrolled when printed or downloadedMethodology to determine annual permitted take for Metropolitan Adelaide from the River Murray SA Water
Figure 4.3 Time series comparison of observed per capita monthly demand and simulated
demands from climate-adjusted demand model (2007–2017)
Figure 4.4 Comparison between observed and predicted per capita monthly demand, with
line of best fit shown
Version 1.0 14/05/18 Final Page 19 of 39
For Official Use Only Uncontrolled when printed or downloadedMethodology to determine annual permitted take for Metropolitan Adelaide from the River Murray SA Water
5 Simulation of annual permitted take
The HOMAXP model was used to simulate the operation of the Metropolitan Adelaide Water
Supply System (MAWSS) for a 126-year period, the 1891–2016 water years.
5.1 Input data
As discussed in Section 2.2, key inputs to HOMAXP simulations are time series of monthly
demands and natural intakes to Western Mt Lofty Ranges (WMLR) storages.
5.1.1 Modelled demand
Potable water demands for the metropolitan Adelaide licence area were obtained from the
climate-adjusted demand model by simulating a sequence of monthly per capita demands
using historical climate data for 1891–2016, and then multiplying by the expected population
at end June 2017.
As shown in the schematic in Appendix A, HOMAXP incorporates 21 demand nodes, with
these nodes representing either treated water outputs from water treatment plants (WTPs), or
demands across a defined geographical area. A time series of monthly demands for each of
these 21 nodes is required for a HOMAXP simulation.
The 126-year series of simulated total monthly demands for metropolitan Adelaide was
apportioned to the 21 demand nodes using the following steps, which allow demands by
country towns to be excluded when determining the metropolitan Adelaide demand.
As described in Section 4.2.1, the total metropolitan Adelaide demand represented the
sum of demand from the six WTPs, online demand from the Mannum–Adelaide (MA) and
Murray Bridge–Onkaparinga (MBO) pipelines, and River Murray diversions through the
Swan Reach–Stoickwell (SRS) pipeline (it does not include water supplied to the Country
Towns licence area or water extracted from the Eastern Mt Lofty Ranges).
For each of these nine components of demand (e.g. Happy Valley WTP output), the
proportion of its monthly demand to the total metropolitan Adelaide demand was
calculated for each calendar month across the 10-year model calibration period.
The average monthly proportions across the five-year period (July 2012–June 2017) after
the completion of key water supply infrastructure in metropolitan Adelaide, including the
Adelaide Desalination Plant (ADP) and the North-South Interconnection Project, were then
used to determine monthly demand for each component of metropolitan Adelaide in
terms of the simulated total demand across the entire 126-year sequence.
Myponga WTP output was then split into demand from two HOMAXP nodes: 40 per cent of
demand assigned to the Myponga zone (DMY) and 60 per cent of demand to the South
Coast Towns zone (DSCT).
As the HOMAXP model was developed for alternative state planning purposes, it also
incorporates demand nodes for areas outside the River Murray metropolitan Adelaide
licence area, including areas to the north of metropolitan Adelaide that can be supplied with
River Murray water from either the Morgan–Whyalla (MW) or SRS pipelines. To ensure the final
monthly demands for metropolitan Adelaide do not include water supplied to the Country
Towns licence area, demands for each of these ‘country’ nodes were calculated as
proportions of the simulated demands for metropolitan Adelaide. The DYP (Yorke Peninsula)
and DLND (Lower North Downstream) demand nodes (Appendix A) represent areas that are
predominantly supplied bya mixture of metropolitan Adelaide licence (via Swan Reach No.1
Pump Station) and country licence (via Morgan No.1 Pump Station).
Although SRS diversions form part of the total diversions from the River Murray against the
metropolitan Adelaide licence, these diversions were combined with historical MW diversions
to represent the total regional demand in HOMAXP for areas north of metropolitan Adelaide.
Version 1.0 14/05/18 Final Page 20 of 39
For Official Use Only Uncontrolled when printed or downloadedMethodology to determine annual permitted take for Metropolitan Adelaide from the River Murray SA Water
This approach allows the modelled flows to be drawn through the water network, in line with
real-world operations. Figure 5.1 summarises average monthly ratios of total volumes diverted
from the River Murray through the MW and SRS pipelines (minus third-party transport to
Barossa Valley) to the total metropolitan Adelaide demands in the five-year period 2012–
2017. These monthly ratios were used to generate a 126-year sequence of simulated monthly
diversions through the MW and SRS pipelines, in terms of simulated monthly demands for
metropolitan Adelaide.
Figure 5.1 Monthly proportions of metropolitan Adelaide demand that represent total volumes
supplied through MW and SRS pipelines
The total ‘country’ demands (represented by total diversions through the MW and SRS
pipelines) were disaggregated to demands at discrete nodes for HOMAXP using the
proportions provided in Table 5.1. These proportions are consistent with assumptions used by
SA Water for water supply planning purposes.
Table 5.1 Proportions of total River Murray extractions through the MW and SRS pipelines to be
assigned to country demand nodes in HOMAXP
HOMAXP node name HOMAXP node description Proportion of total MW+SRS
volumes
DMEO Morgan–Eudunda Online Demand 4.3%
DUNO Upper North Online Demand 3.7%
DNSG Northern Spencer Gulf Demand 55.3%
DCVO Clare Valley Online Demand 2.0%
DMNO Mid-North Online Demand 5.1%
DLNU Lower North Demand (Upstream) 3.0%
DLND Lower North Demand 3.6%
(Downstream)
DYP Yorke Peninsula Demand 11.6%
DBO Barossa Valley Online Demand 11.5%
Version 1.0 14/05/18 Final Page 21 of 39
For Official Use Only Uncontrolled when printed or downloadedMethodology to determine annual permitted take for Metropolitan Adelaide from the River Murray SA Water
HOMAXP includes three nodes that represent third-party demand: Barossa Infrastructure
Limited (BIL), Commercial Transport in Clare Valley (CTCV) and Commercial Transport in
Barossa Valley (CTBV). Typical volumes supplied to third-party users in Clare Valley (0.4 GL/a)
and Barossa Valley (1.4 GL/a, including approximately 0.1 GL/a supplied to users in Eden
Valley) during 2012–2017 were used to generate a sequence of demands for the 126-year
HOMAXP simulation.
Demands from BIL were assumed to be the full contracted volume of 11 GL/a, even though
the volume supplied by SA Water has been less than 11 GL/a over the past five years. The
monthly demand profiles shown in Figure 5.2 were used to generate demands for the CTCV,
CTBV and BIL nodes in this simulation.
Figure 5.2 Average monthly third-party demands assumed for HOMAXP simulation
5.1.2 Modelled intakes
HOMAXP incorporates natural inflows to the nine WMLR storages. The 126-year series of
monthly natural intakes simulated by the five WaterCress models described in Section 3
represented the ‘Actual Inflows’ input series for the HOMAXP simulation. The average annual
natural intakes from the five WMLR systems for both the full modelling period and the Basin
Plan reference period are summarised in Table 5.2
Table 5.2 Average annual natural intakes to WMLR systems
WMLR system 1891–2016 annual average (ML) 1895–2008 annual average (ML)
South Para 22,138 21,805
Little Para 7,814 7,868
Torrens 38,331 38,292
Onkaparinga 59,057 58,378
Myponga 15,966 15,985
Total 143,307 142,329
Version 1.0 14/05/18 Final Page 22 of 39
For Official Use Only Uncontrolled when printed or downloadedMethodology to determine annual permitted take for Metropolitan Adelaide from the River Murray SA Water
5.1.3 Forecast modelled demands and inflows
HOMAXP uses a sequence of 12-monthly forecast values for each demand and inflow node.
These monthly forecast values are used in the simulation to forecast headworks operations,
including planned pumping from the River Murray throughout a water year. The model
simulation used forecast demands and inflows that represented a 50 per cent probability of
exceedance (POE).
To calculate the 50 per cent POE sequence of forecast inflows, the time series of annual
intake (the sum of annual intakes to the nine WMLR storages) for the 126-year simulation
period was ranked. The median annual intake was then identified, and the simulated monthly
intakes for that year were used as the forecast monthly intakes for the nine WMLR storages.
As previously described, the HOMAXP ‘Actual Demands’ are proportional to each other in
each calendar month. The sequence of 12-monthly forecast demands were calculated by
determining the year with the median annual demand and apportioning this across the 21
demand nodes, using the monthly distributions as described in Section 5.1.1.
5.1.4 WMLR reservoir target storage levels
The optimisation process in HOMAXP includes monthly target storage levels (TSLs) in each of
the WMLR storages which represent SA Water’s proposed operation of the WMLR storages.
The timing and magnitude of diversions from the River Murray are managed in conjunction
with forecast intakes from the WMLR catchments to meet TSLs in each of the WMLR systems
throughout the HOMAXP simulations. The suite of TSLs that were adopted, as shown in Figure
5.3, correspond to the currently used set of minimum reservoir TSLs as updated by SA Water
for the 2016 business planning process.
Figure 5.3 Monthly target storage levels for WMLR storages incorporated in HOMAXP simulation
Version 1.0 14/05/18 Final Page 23 of 39
For Official Use Only Uncontrolled when printed or downloadedMethodology to determine annual permitted take for Metropolitan Adelaide from the River Murray SA Water
5.2 Total annual demand
The total annual demand from metropolitan Adelaide that was used as input to the HOMAXP
simulation was calculated as the sum of total demand as modelled with the climate-adjusted
demand model. Table 5.3 summarises the average annual total demand from metropolitan
Adelaide.
Table 5.3 Average annual metropolitan Adelaide demand used for HOMAXP simulation
1891–2016 average 1895–2008 average
(GL/a) (GL/a)
Metropolitan Adelaide demand as 162.63 162.15
calculated by the climate-adjusted demand
model
Figure 5.4 shows the time series of annual modelled demand used in the HOMAXP simulation
for 1891–2016.
Figure 5.4 Total metropolitan Adelaide demand as used in the HOMAXP simulation
5.3 Available water from the WMLR storages
5.3.1 Environmental flows
Environmental flow releases represent the coordinated release of water from the WMLR
storages for the purpose of improving the biodiversity of downstream waterways rather than
for water supply. SA Water’s operational practice includes coordinated releases from the
South Para system (at the Barossa Diversion Weir), Torrens system (at Gorge Weir) and
Onkaparinga system (at Clarendon Weir). SA Water is required to provide reasonable
environmental flows in these watercourses for environmental flow purposes.
The environmental flow releases are secured through provisions of the WMLR Water Allocation
Plan (WAP) and administered through a condition of SA Water’s water extraction licence. The
current flow regime has been in place since 2012. These releases reduce the volume of water
Version 1.0 14/05/18 Final Page 24 of 39
For Official Use Only Uncontrolled when printed or downloadedMethodology to determine annual permitted take for Metropolitan Adelaide from the River Murray SA Water
available from the WMLR to meet metropolitan Adelaide’s consumptive demands. Future
environmental flow requirements may be refined, subject to the outcomes of the current
interim environmental flow program.
Appendix D summarises monthly target environmental flow release volumes from WMLR
storages that are used in operational planning by SA Water. These were established by the
Adelaide and Mount Lofty Ranges Natural Resources Management Board in consultation
with SA Water. They seek to balance environmental and water security requirements.
The environmental flow releases are modelled in HOMAXP by allowing 20 per cent of the
monthly intake volume to the South Para, Torrens and Onkaparinga systems to be routed
through the reservoirs as environmental flows (as calculated by the WaterCress catchment
models) when sufficient water is available, up to a maximum monthly volume (as per
Appendix D).
The total intake to the South Para system is the sum of modelled intakes to the South Para and
Warren Reservoirs; the total intake to the Torrens system is the sum of modelled intakes to
Millbrook Reservoir, Kangaroo Creek Reservoir and Gorge Weir; and the Onkaparinga system
intake is the sum of monthly intakes to Mt Bold Reservoir and Clarendon Weir. Monthly
environmental flow releases from the South Para, Torrens and Onkaparinga systems for 1891–
2016 were incorporated into the HOMAXP simulation.
Figure 5.5 shows the total annual environmental flow releases that were incorporated in the
HOMAXP simulation2. The Basin Plan reference period (1895–2008 water years) included an
average annual total release of 6.19 GL/a, below the planned upper limit for releases under
current operations (approximately 11.5 GL/a).
In addition, flows currently released by SA Water from Gorge Weir in the Torrens System for the
River Torrens Water Quality Improvement Program to manage blue-green algae in Torrens
Lake were also incorporated in the HOMAXP simulation. A total of 2.4 GL/a, consisting of
monthly releases of 600 ML in December through March each year, were incorporated as
minimum ‘spill’ from the Gorge Weir storage (OGW) in these months.
Figure 5.5 Total annual environmental flow releases, with average annual release under Basin
Plan reference period included
2In the HOMAXP simulation, environmental water is modelled as an additional demand (this effectively quarantines it from
consumptive use) as this most accurately represents its flow through the network.
Version 1.0 14/05/18 Final Page 25 of 39
For Official Use Only Uncontrolled when printed or downloadedMethodology to determine annual permitted take for Metropolitan Adelaide from the River Murray SA Water
5.3.2 Net available intake to WMLR storages
A key result from the HOMAXP simulation is the calculation of spill, environmental flow releases
and evaporation loss from the nine WMLR storages across the 126-year simulation period. The
‘Actual Inflows’ input series, as described in Section 5.1.2, represented the simulated runoff
from the contributing catchments to the nine WMLR storages. Table 5.4 summarises the
average intake, environmental provision and loss from WMLR storages as simulated with
HOMAXP. Net intakes represent the ‘usable’ intake volumes to the WMLR storages.
Table 5.4 Average annual net intakes to WMLR storages as modelled in HOMAXP
1891–2016 average 1895–2008 average
(GL/a) (GL/a)
Total natural intakes to WMLR storages 143.31 142.33
Total spill from WMLR storages 35.33 35.52
Total evaporation loss from WMLR storages 17.66 17.65
Environment flow releases from WMLR 6.22 6.19
storages
Total ‘net’ intakes to WMLR storages 84.10 82.97
Figure 5.6 shows a time series of average annual ‘net’ intake to WMLR storages for the full 126-
year modelling period, with the average annual net intake for the Basin Plan reference
period (1895–2008) included.
Figure 5.6 Annual modelled net intakes to WMLR storages with average annual net intake
under Basin Plan reference period included (red line)
Version 1.0 14/05/18 Final Page 26 of 39
For Official Use Only Uncontrolled when printed or downloadedYou can also read