Unmanned Aircraft Systems - FAA
←
→
Page content transcription
If your browser does not render page correctly, please read the page content below
Unmanned Aircraft Systems
Over the last 5 years, unmanned aircraft sys-          FAA will continue to enable the thriving UAS
tems (UAS) have been experiencing healthy              industry, with the safe integration of UAS into
growth in the United States and around the             the NAS.
world. UAS consists of the unmanned air-
craft platform and its associated elements--
including communication links, sensors, soft-          Trends in Model Aircraft and Forecast
ware and power supply-- that are required for
the safe and efficient operation in the na-            The FAA’s online registration system went
tional airspace system (NAS). While the in-            into effect on Dec. 21, 2015. This required
troduction of UAS in the NAS has opened up             all UAS weighing more than 0.55 pounds
numerous possibilities, it has also brought            (250 grams) and less than 55 pounds to be
operational challenges including safe inte-            registered using the on-line system
gration into the NAS. Despite these chal-              (https://www.faa.gov/uas/get-
lenges, the UAS sector holds enormous                  ting_started/registration/) or by using the ex-
promise. Uses may include modelers exper-              isting (paper-based) aircraft registry. In May,
imenting with small UAS (sUAS), performing             2017, a U.S. Appeals Court Order caused a
numerous functions including aerial photog-            temporary halt in UAS registration. Subse-
raphy and personal recreational flying. At             quently, the registration requirement for all
the same time commercial operators may be              model aircraft owners was reinstated in De-
experimenting with package and medical                 cember 2017 with the 2018 National Defense
supply delivery and providing support for              Authorization Act (NDAA). Despite the tem-
search and rescue missions.                            porary halt, registration’s pace continued be-
                                                       yond May, 2017. The latest FAA reauthoriza-
This section provides a broad landscape                tion codifies       the requirement        [see
covering model and non-model aircraft 12 and           https://www.faa.gov/news/up-
their recent trends as gleaned from trends in
                                                       dates/?newsId=91844 for more details].
registration, overall market and operational
information. Using these trends and insights           With the continuing registration, more than
from industry, the FAA has produced several            900,000 owners had already registered with
areas of forecasts for UAS. Forecasts re-              the FAA by Sept. 2018. Monthly owner reg-
ported in this section are driven primarily by         istration averaged around 8,000-9,000 dur-
the assumption of continuing evolution of the          ing Jan.-Dec., 2018, with some expected
regulatory environment (i.e., unconstrained            peaks during the holiday season and sum-
environment), the commercial ingenuity of              mer.
manufacturers and operators and underlying
demand, including business models. The

12These are also called, interchangeably, hobby        notes including other documents of the Agency,
and non-hobby UAS, respectively. In previous           these terms are often interchanged.

                                                  41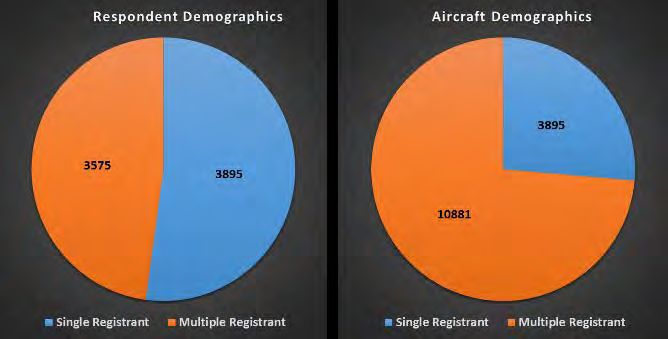
Unlike non-model counterparts, the registra-
tion rules do not require modelers to register
each individual aircraft; only owners are reg-
istered. Each owner registers, and each
owner might have multiple UAS. Exceptions
may be registered modelers with no owned
equipment. Notwithstanding these chal-
lenges, there is information available for both
industry and academia, allowing us to under-
stand aircraft ownership. Furthermore, un-
The pace of registration in 2018 slowed con- der the sponsorship of the UAS Integration
siderably compared to 2016 and 2017. Research Plan, the Agency has launched
Monthly owner registration now stands at various research activities to understand the
half of what was observed a year ago. possible magnitude of the sector as well as
implications for likely aircraft that may be
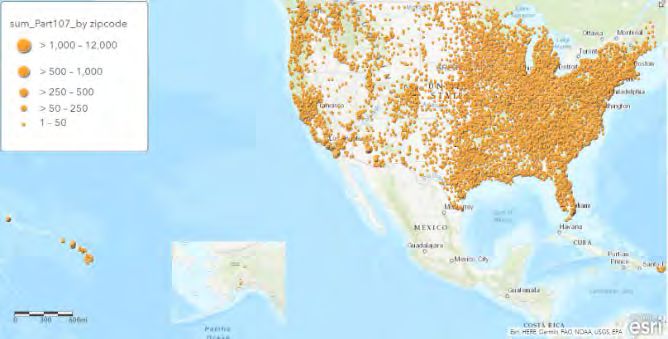
Model registration and thus ownership of used for model flying and safety implications
sUAS is distributed throughout the country. for the UAS fleet from gradual integration into
Using the data as available in Sept 2018, a NAS. The forecasts presented use all avail-
spatial distribution of ownership by zip code able resources to analyze and forecast both
below demonstrates that sUAS continue to model and non-model activities in the U.S.
be distributed throughout the country with
denser ownership mapping closely against With over 900,000 modelers registered as of
the population centers of the country, as ex- December 31, 2018, we estimate that there
pected. are around 1.25 million drones distinctly
identified as model aircraft. Comparing with
industry sales and other data noted above,
we conclude that model aircraft is almost 40
percent higher than ownership registration 13.
A comparison of last year’s data with this
year’s (2018) shows that the annual growth
rate to be around 13 percent. This continues
to be substantial growth as anticipated from
the introduction of drones as a recreation ac-
tivity facilitated by falling equipment prices
and improved technology, such as built-in
cameras and relatively easy maneuvering.
13 This calculation involves taking into account re- we expect this rate to change dynamically over
tirement, redundancy, and loss of craft corre- time.
sponding to ownership registration. As craft be-
comes sturdier and operators situationally aware,
42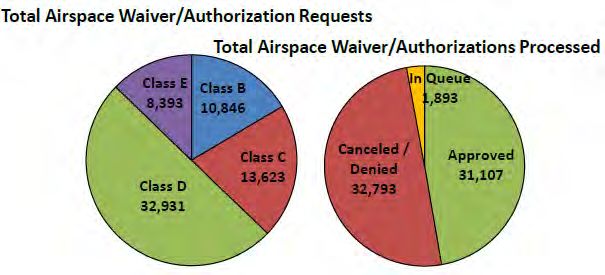
However, like in all other technologies includ-          model on registration trends. Using these,
ing hobby items, (e.g., cell phones and video            we forecast that the model fleet will likely
game consoles; and prior to that, video cam-             (i.e., base scenario) attain its peak over the
eras, and video players), the trend in model             next 5 years, climbing from the present 1.25
aircraft is likely to slow as the pace of falling        million units to around 1.39 million units by
prices diminishes and the early adopters                 2023. The high/optimistic scenario may be
begin to experience limits in their experi-              estimated at 1.66 million units over the next
ments or simply eagerness plateaus.                      5 years. As evident, the growth rates under-
                                                         lying these numbers are fairly steady in the
         Total Recreation/Model Fleet                    initial years but are diminishing faster in the
         (Million sUAS Units)                            last 2-3 years. The gradual saturation that is
  year         Low        Base            High           projected in 5 years and beyond in the model
                                                         aircraft fleet parallels other consumer tech-
  2018         1.25        1.25           1.25
                                                         nology products.
  2019         1.29        1.31           1.35
  2020         1.31        1.35           1.44
  2021         1.31        1.37           1.52
  2022         1.32        1.38           1.59
  2023         1.32        1.39           1.66           Survey of Non-Model Aircraft Owners
                                                         Before we describe non-model sUAS trends
Given the trend in registration and market de-           and forecasting in the next section, we pro-
velopments, we forecast that the model air-              vide a brief overview of results from a proto-
craft market will saturate at around 1.4 million         type survey that the FAA undertook during
units. However, there are still some upside              June-July, 2018. The results provide likely
uncertainties due to further changes in tech-            growth path in the near future. The survey,
nology and the likely event of continuously              based on a well-tested questionnaire, was
falling prices. This yields to some upside un-           sent by the FAA to individuals registered by
certainty in the forecast. We do not antici-             December 31, 2017 and conducting activities
pate similar symmetry in low side as it paral-           under Part 107 (i.e., non-model or commer-
lels to the growth in the base projection.               cial activities) in that year. The response rate
Nevertheless, we provide a forecast base                 to the survey was approximately 8 percent
(i.e., likely) with high (or optimistic) and low         (7,400 responses from 89,000 contacted).
(or pessimistic) scenarios, provided in the ta-          The survey was designed primarily to get a
ble above. The FAA projects, unlike in pre-              snapshot of non-model/commercial mission
vious years, that this sector may have ex-               characteristics including location, types of
hausted downside risks; i.e., decline in regis-          aircraft used, and altitude flown. In addition
tration beyond saturation as captured by                 to providing the FAA key data in understand-
base forecast.                                           ing operational characteristics of non-model
                                                         activities throughout the country, these key
We use the trend observed in registrations,
                                                         metrics are also important for understanding
particularly over the past year, expert opin-
                                                         trends in non-model activities and likely
ions collected in TRB annual workshops, re-
                                                         growth trajectory in the near future.
view of available industry forecasts, mar-
ket/industry research, and a time-series

                                                    43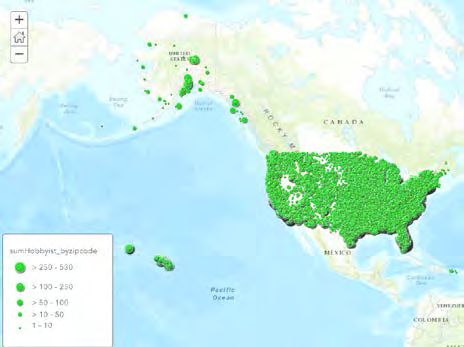
Registrants with one aircraft and those who
owned/operated multiple aircraft responded
almost equally as the figure above shows.               Turning to distribution of ownership, we ob-
The average number of aircraft among multi-             serve that almost 1 in 3 survey respondents
ple registrants was around 3 with a margin of           used one sUAS compared to 55 percent from
error of + 0.2. Survey sample was repre-                the population (i.e., the Registry). For those
sentative when checked against the popula-              who operate multiple sUAS, a large group
tion from the Registry.                                 (54 percent) falls into the category of operat-
                                                        ing 2-9 sUAS, as compared to only 1 in 3 in
The survey reveals that most of the non-                that category from the Registry or population
model UAS are light UAS, those weighing 5               counts. For operators with over 10 sUAS,
lbs or less. This result was the same as in             survey response (15 percent) were closer to
the Registry. The figure below shows the                what we observe in the Registry (12 percent).
distribution among the responses from single            This distribution provides valuable infor-
sUAS users:                                             mation regarding the use intensity of sUAS
                                                        by both single and multiple owners.

A similar distribution is reflected in responses
from multiple aircraft owners, although the
weight of the classes are skewed more to-
                                                        Bigger variations are observed between sin-
wards the medium (5-24 lbs) and heavy (25-
                                                        gle and multiple sUAS when asked about in-
55 lbs):

                                                   44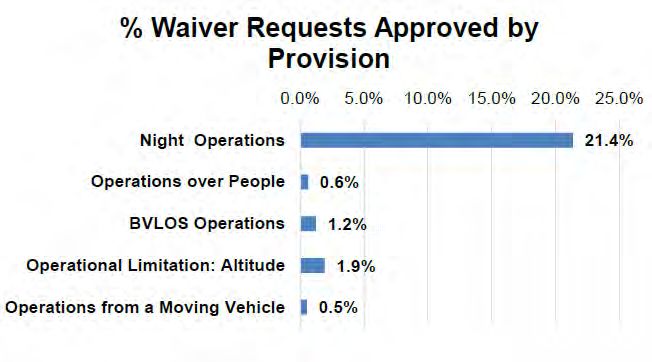
tensity of operations as captured by the num-
ber of missions 14 in 2017. It is apparent from
the table below, the more one operates (i.e.,
multiple owners) sUAS, the more missions
they fly during the year; i.e., over twice as
many as the single operator. On average,
while a single operator flies 32 mis-
sions/year, multiple owner/operators flew
more than twice that number (82 missions,
on average):

Trends in Non-Model Aircraft and Fore-                 pace accelerated to 14,600 registrations a
cast                                                   month during the last year (2018). The non-
                                                       model sector is primarily commercial in na-
Unlike model ownership, rules for non-model
                                                       ture. It is dynamic and appears to be at an
registration require owners to register each
                                                       inflexion point of demonstrating powerful
sUAS, thus giving a one-to-one correspond-
                                                       stages of growth. Unlike the model sector,
ence between registration and aircraft. For
                                                       we anticipate that the growth rate in this sec-
the calendar year 2018, more than 175,000
                                                       tor will continue to accelerate over the next
non-model owners/operators registered their
                                                       few years. Since initiation of Part 107, there
equipment. The pace of monthly registra-
                                                       has been proposed rule changes (see
tion, almost 15,000, is nearly 3-times higher
                                                       https://www.federalregister.gov/docu-
than the pace at which non-model aircraft
                                                       ments/2019/02/13/2019-00732/operation-of-
owners registered their craft during the same
                                                       small-unmanned-aircraft-systems-over-peo-
time last year. While the pace of model reg-
                                                       ple. The requirements would address oper-
istration ownership has slowed down consid-
                                                       ations over people, operations at night with-
erably, interestingly, the pace of registration
                                                       out waivers and possibilities for waivers in-
is accelerating for non-model counterparts.
                                                       cluding enhancement of operational efficien-
By the end of 2018, there were more than
                                                       cies. They would also address more com-
277,000 non-model aircraft registered since
                                                       mercial uses that will likely facilitate further
registration opened.
                                                       growth. Notably, a single point for submis-
Since the registration process has been                sion of all operational information, including
available through Dec 2017, over 4,600 air-
craft per month have been registered. This

14Missions were described as a job or economic
activity consisting of many take-offs/landings.

                                                  45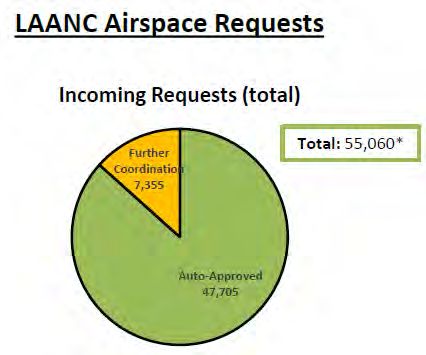
registration, authorization, and accident log-             fell short by almost 80 percent for 2018 (or
ging, helps facilitate this growth further                 277,000 actual aircraft vs 158,900 that we
[https://faadronezone.faa.gov/#/].                         projected last year). The significant growth
                                                           in this sector over the past year demon-
                                                           strates the uncertainty and potential of the
                                                           market.

                                                           Given the trend observed in the registrations,
                                                           information from the survey, review of avail-
                                                           able industry forecasts, and internal re-
                                                           search, together with market/industry re-
                                                           search, we project that the non-model fleet
                                                           by 2023 will likely (i.e., base scenario) be
As in the case of model UAS ownership, non-
                                                           three times larger than the current number of
model sUAS are distributed across the coun-
                                                           non-model aircraft 15. As the present base
try. A spatial distribution of equipment regis-
                                                           (i.e. cumulative total) gets larger, we antici-
tration (using data for September 2018)
                                                           pate the growth rate of the sector will slow
demonstrates that non-model sUAS are dis-
                                                           down over time. Nevertheless, the sector will
tributed throughout the country with denser
                                                           be much larger than what we understood as
activities mapping closely against the eco-
                                                           recently as last year. Given the accelerated
nomic or commercial activities of the country.
                                                           registration over the last year, we now project
                                                           the non-model sUAS sector will have over
                                                           835,000 aircraft in 2023 (i.e., end of 5-year
                                                           period). Important to note here is that last
                                                           year’s forecasted sUAS for 2022 (452,000
                                                           units) will be surpassed sometime towards
                                                           the later part of 2019 or early 2020 if the pre-
                                                           sent registration trend continues. This will
                                                           shorten the forecast outcome period by al-
                                                           most 2-3 years.
Last year, we forecasted that the non-model
sector would have around 229,400 sUAS in                   In order to understand the growth trajectory
2019, a growth rate exceeding 44 percent                   of the sector better, we divide the non-model
from the year before (2018). Actual data far               sector into two types of UAS aircraft: con-
exceeds that trend with over 277,000 aircraft              sumer grade and professional grade. The
already registered by the end of 2018. Our                 consumer grade non-model aircraft are
forecast of non-model sUAS last year thus                  priced in a wide range, somewhere below US

15Last year, this ratio (from base year of forecast
to end-year of forecast) was 4-times; i.e., we pro-
jected forecast to be 4-times the base year’s
(2017) numbers in 5-year.

                                                      46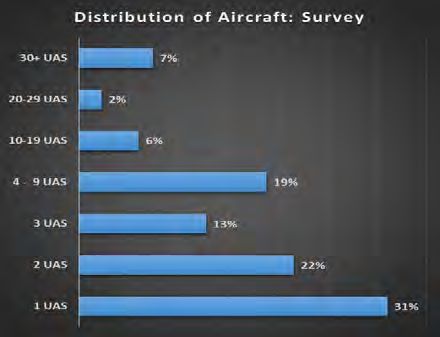
$10,000 with an average unit price of around              ther enhanced by, for example, the Low Alti-
$2,500. The professional grade is typically               tude Authorization and Notification Capability
priced above US $10,000, with an average                  (LAANC) system 17, which began authoriza-
unit price assumed to be around $25,000 16.               tion in May, 2018. LAANC is designed to al-
For both consumer grade and professional                  low considerable flexibility in sUAS opera-
grade aircraft, the average price has been                tions and facilitate non-modelers’ use of the
falling over time, particularly over the last             NAS. While most of the near-term growth in
three years. Currently, the consumer grade                non-model sUAS will continue to come from
dominates the non-model sector with a mar-                consumer grade (over 90 percent), we antic-
ket share approaching 95 percent. However,                ipate a significant part will come from profes-
as the sector matures and the industry be-                sional grade non-model sUAS as well.
gins to consolidate, the share of consumer
grade non-model aircraft is likely to decline             As non-model aircraft become operationally
but will still be dominant. By 2023, FAA pro-             more efficient and safe, battery life expands
jects this sub-sector will have around 85 per-            and integration continues, new business
cent share of the overall non-model sUAS                  models will begin to develop, thus enhancing
sector.                                                   robust supply-side responses. These re-
                                                          sponses, in turn, will pull demand forces
Starting from a low base of around 13,000                 (e.g., consumer responses to receiving com-
aircraft in 2018, professional grade non-                 mercial packages; routine blood delivery to
model sUAS sub-sector stands to expand                    hospitals, search-and-rescue operations,
rapidly over time, especially as newer and                etc.) that are somewhat latent and at the ex-
more sophisticated uses are identified, de-               periment stage, at present. Unlike a devel-
signed, and operationally planned and flown.              oped sector such as passenger air transpor-
If, for example, professional grade sUAS                  tation, it is impossible to put a marker on “in-
meets feasibility criteria of operations, safety,         trinsic demand” (or core demand), primarily
regulations, and satisfies economics and                  driven by economic and demographic fac-
business principles and enters into the logis-            tors, underlying this sector. Nevertheless, an
tics chain via delivering small packages, the             attempt has been made to capture the low-
growth in this sector will likely be phenome-             range to the projected demand. Hence, we
nal. This growth trajectory may even be fur-              provide the likely or base scenario together
                                                          with the enormous potential embodied in the

16 Because of this wide range in prices between           FAA approved UAS Service Suppliers (USS) are
types of sUAS in commercial activities, start-up          checked against airspace data in the FAA UAS
cost for a business may vary somewhere be-                Data Exchange such as temporary flight re-
tween $2,500 and $25,000.
17 Low Altitude Authorization and Notification Ca-
                                                          strictions, NOTAMS and the UAS Facility Maps
                                                          (UASFM). Approved requests thus provide the
pability [https://www.faa.gov/uas/programs_part-
                                                          FAA ATO visibility into where and when planned
nerships/uas_data_exchange/] or LAANC auto-
                                                          drone operations will take place.
mated the application/approval process for air-
space authorizations. Requests submitted via

                                                     47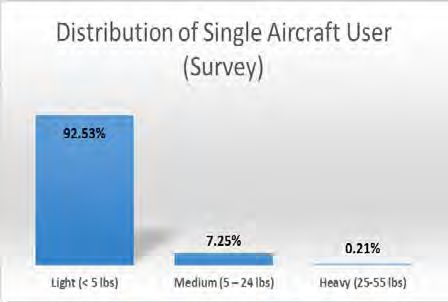
“high” scenario, representing cumulative an-            next. Increasingly, state and local govern-
nual growth rates of 25 percent and 36 per-             ments are using sUAS for emergency ser-
cent, respectively. In the event of unfore-             vices including search-and-rescue opera-
seen slowdown or obstacles, “low” scenario              tions and presently employ around 3 percent
projects a cumulative growth rate of around             of all non-model sUAS. As the sector grows,
17 percent annually.                                    we anticipate there will be many more uses
                                                        of non-model sUAS as they are increasingly
              Total non-Model Fleet                     evident from the participants’ activities, for
              (no. of '000 units)                       example, under the Integration Pilot Program
     year       Low       Base       High               (IPP). In May, 2018 the FAA awarded 10
       2018        277        277        277            communities, among a pool of 149 applica-
       2019        369        400        426            tions,            [https://www.faa.gov/uas/pro-
       2020        460        545        638            grams_partnerships/uas_integration_pi-
       2021        552        711        932            lot_program/awardees/] to participate in the
       2022        588        789      1,112            IPP. IPP applications and preliminary data
       2023        603        835      1,290            indicate that awardees overwhelmingly plan
                                                        to undertake numerous commercial and pub-
Non-model sUAS are presently used for nu-               lic interest activities.
merous purposes. The survey of non-model
                                                        One way of identifying early trends of non-
sUAS aircraft owners reveals their present
                                                        model sUAS uses is to analyze the waiver
uses as follows:
                                                        applications granted to non-model sUAS op-
                                                        erators. Both the magnitude and relative
                                                        composition of waiver types may indicate the
                                                        direction of the non-model sUAS sector as a
                                                        whole. A breakdown of the waiver requests
                                                        granted in December 2018 is shown in the
                                                        chart below:

Non-model sUAS are used extensively in
carrying out research and development
(R&D), and in training-education missions
(21 percent), followed by filming events in-
cluding weddings, entertainment and sports
(21 percent), industrial/utility and in environ-        Beyond what is presently allowed under ex-
mental projects such as aerial inspection (16           isting Part 107, expanding non-model appli-
percent) followed by real estate (13 percent)           cations further would require waivers, to a
and in construction activities (8 percent). Ag-         large extent, for night operations, (1 in 5
riculture (7 percent) including crop inspec-            waivers) and operating limitations of altitude
tion; and press and media (5 percent) come              (1.9 percent). Many of these waivers are
                                                        combined, and hence, total waivers granted

                                                   48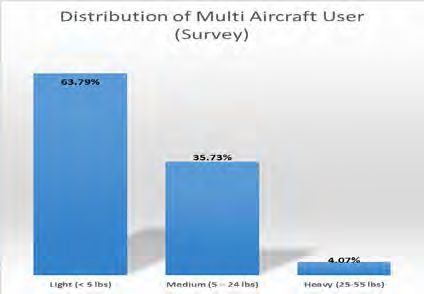
(over 2100 in December 2018) exceed 100
percent. The Agency issues these waivers
to facilitate commercial activities by non-
model sUAS while preparing for the next
round of regulations. New regulations seek
to amend the present waiver requirements.
(See https://www.federalregister.gov/docu-
ments/2019/02/13/2019-00732/operation-of-
small-unmanned-aircraft-systems-over-peo-              Finally, LAANC continues to routinely pro-
                                                       vide auto-approval. It has provided, so far,
ple for current notice of proposed rulemaking
(NPRM) on operations of small unmanned                 over 47,000 auto-approvals for airspace ac-
aircraft over people in certain conditions and         cess requests, while sending over 7,000 for
                                                       further coordination. LAANC authorizations
operations of small UAS at night without ob-
                                                       are facilitated by combining UAS facility
taining a waiver). Analysis of these waiver
applications allows us to understand the in-           maps                                (UASFM)
dustry trends, one of many metrics essential           [https://faa.maps.arcgis.com/apps/webappvi
for understanding and projecting both the tra-         ewer/in-
jectory, course corrections, and growth                dex.html?id=9c2e4406710048e19806ebf6a
                                                       06754ad] that provide maximum allowed al-
trends of the sector.
                                                       titudes around airports where the FAA may
Almost 50 percent of airspace authorizations           authorize Part 107 UAS operations without
and waivers were approved for the controlled           additional safety analysis. The UASFMs are
airspaces at the end of December, 2018.                used to inform requests for Part 107 airspace
While over half of them were for class D air-          authorizations and waivers in controlled air-
space (i.e., smaller airports with control tow-        space.
ers), other classes were also requested and
regularly flown.

Survey responses show that while most of
the respondents routinely fly in Class G air-
space (almost 60 percent), there are quite a
few users, who fly within controlled airspace          Remote Pilot Forecast
facilitated by the airspace waivers.
                                                       An important final metric in non-model sUAS
                                                       is the trend in remote pilot (RP) certifications.
                                                       RPs primarily facilitate non-model sUAS

                                                  49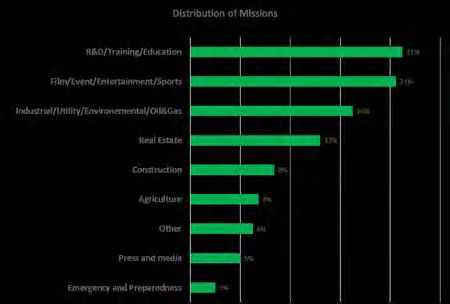
flights for commercial activities. As of De-          the base of 116,027 RPs in 2018, non-model
cember 2018, more than 116,000 RP certifi-            activities may require almost 350,000 RPs in
cations have been issued 18. Over 90 percent          5 years, a three-fold increase, providing tre-
of those who took the exam passed and ob-             mendous opportunities for growth in employ-
tained RP certification. The RP forecasts             ment associated with commercial activities of
presented below are based on using two                UAS. Potential for RPs may enhance even
data sources: (a) trends in total RPs; and (b)        more if larger UAS are used in commercial
trends in non-model sUAS registration and             activities and urban air mobility becomes a
forecasts of fleet. Given the trends in regis-        reality in the near future.
tration and our forecast of non-model fleet,
we assume that one pilot is likely to handle          Urban Air Mobility
2.4 units of non-model sUAS.                          In Sept 2017, NASA launched a market
                                                      study for a segment crossing over some
Using these assumptions and combined with
                                                      functions of UAS discussed above. This seg-
the base scenario of non-model sUAS fore-
                                                      ment of autonomous vehicles broadly called
cast, we project RPs in the graph below. Last
                                                      Urban Air Mobility (UAM) is defined as “a
year, we projected RPs to be around
                                                      safe and efficient system for air passenger
106,000 by the end of 2018; which fell short
                                                      and cargo transportation within an urban
by 10,000 by the end of 2018. However, the
                                                      area, inclusive of small package delivery and
registration of non-model sUAS far ex-
                                                      other urban unmanned aircraft systems
ceeded, as noted earlier, what we projected
                                                      (UAS) services, which supports a mix of
last year.
                                                      onboard/ground-piloted and increasingly au-
                                                      tonomous              operations”           (see
                                                      https://www.nasa.gov/aero/nasa-embraces
                                                      urban-air-mobility). Studies sponsored by
                                                      NASA were undertaken by two consulting
                                                      firms and are presently under review from ex-
                                                      pertise within the government and academia.
                                                      Executive summaries of the two reports sug-
                                                      gest (https://www.nasa.gov/uamgc), broadly
                                                      speaking, the following: (a) UAS may play a
                                                      significant role in transforming short-haul ur-
Given these, we made the adjustment to RPs            ban air transportation, e.g., airport shuttle, air
per non-model aircraft, thus increasing it by         taxi, air ambulance, last-mile parcel delivery,
one more unit than last year. Despite this ad-        etc.; (b) substantial financial and business
justment, RPs are set to experience tremen-           opportunities exist, but there are significant
dous growth following the growth trends of            technological, operational, and regulatory
the non-model sUAS sector. Starting from              challenges including issues involving public

18In our accounting of RPs, we take pilots who        manned pilots who took online training in lieu of
passed the initial knowledge test plus current        the knowledge tests.

                                                 50
perceptions and acceptance; and (c) gradual of GCs, will be to “promote public confidence
integration of sUAS into the overall system in UAM safety and facilitate community-wide
may facilitate integration of UAM by around learning while capturing the public’s imagina-
2030. tion” (see https://www.nasa.gov/uamgc for
more details).
In order to understand and address the chal-
lenges identified by the studies, the new As the sector grows and new initiatives are
Grand Challenge (GC) has been initiated, taken, the Agency is keeping a keen eye on
under which NASA will host UAM ecosys- understanding the overall trends.
tem-wide challenges in 2020. Under GC,
participants will be required to execute sys-
tem level safety and integration within oper-
ationally robust and relevant environments.
The goal of the first GC (GC-1), from a series
51You can also read


