Air quality modelling to inform the Site Allocations Development Plan Document - Mid Sussex ...
←
→
Page content transcription
If your browser does not render page correctly, please read the page content below

Mid Sussex District Council

Air quality modelling to inform the Site Allocations
                      Development Plan Document
        Stonepound Crossroads AQMA - Sites DPD
                               Scenario Results

                                                       Air Quality Assessment

                Wood Environment & Infrastructure Solutions UK Limited – February 2020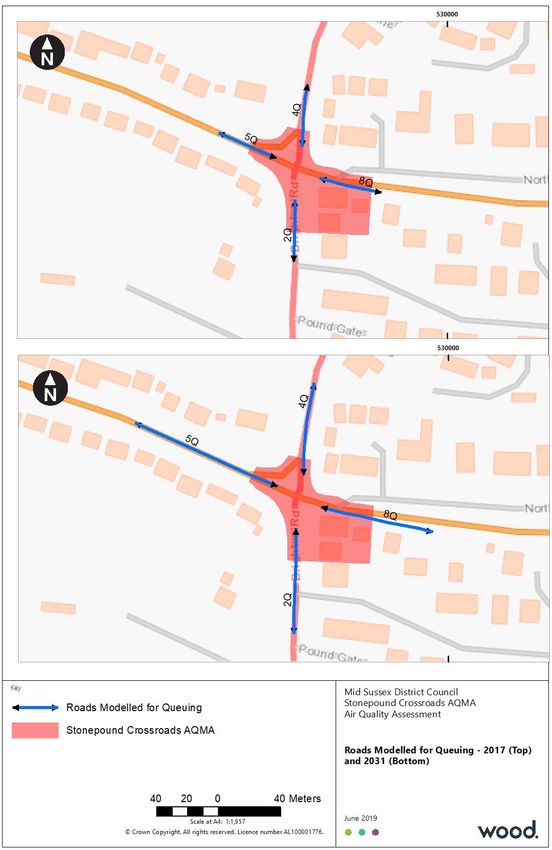
2            © Wood Environment & Infrastructure Solutions UK Limited

Report for                                                                          Copyright and non-disclosure notice
Jennifer Hollingum                                                                  The contents and layout of this report are subject to copyright
Planning Officer                                                                    owned by Wood (© Wood Environment & Infrastructure
Mid Sussex District Council                                                         Solutions UK Limited 2019) save to the extent that copyright
Oaklands Road                                                                       has been legally assigned by us to another party or is used by
Haywards Heath                                                                      Wood under licence. To the extent that we own the copyright
RH16 1SS                                                                            in this report, it may not be copied or used without our prior
                                                                                    written agreement for any purpose other than the purpose
                                                                                    indicated in this report. The methodology (if any) contained in
                                                                                    this report is provided to you in confidence and must not be
Main contributors                                                                   disclosed or copied to third parties without the prior written
Ellénore Calas                                                                      agreement of Wood. Disclosure of that information may
                                                                                    constitute an actionable breach of confidence or may
                                                                                    otherwise prejudice our commercial interests. Any third party
                                                                                    who obtains access to this report by any means will, in any
Issued by                                                                           event, be subject to the Third Party Disclaimer set out below.

.................................................................................
Ellénore Calas
                                                                                    Third party disclaimer
                                                                                    Any disclosure of this report to a third party is subject to this
                                                                                    disclaimer. The report was prepared by Wood at the instruction
Approved by                                                                         of, and for use by, our client named on the front of the report.
                                                                                    It does not in any way constitute advice to any third party who
.................................................................................   is able to access it by any means. Wood excludes to the fullest
Piercarlo Smith                                                                     extent lawfully permitted all liability whatsoever for any loss or
                                                                                    damage howsoever arising from reliance on the contents of
                                                                                    this report. We do not however exclude our liability (if any) for
                                                                                    personal injury or death resulting from our negligence, for
Wood                                                                                fraud or any other matter in relation to which we cannot legally
Floor 23                                                                            exclude liability.
25 Canada Square
Canary Wharf
London E14 5LB
                                                                                    Management systems
United Kingdom
Tel +44 (0) 203 215 1610                                                            This document has been produced by Wood Environment &
                                                                                    Infrastructure Solutions UK Limited in full compliance with our
Doc Ref. 40828-WOOD-XX-XX-RP-OA-0010_A_C01.2                                        management systems, which have been certified to ISO 9001,
                                                                                    ISO 14001 and OHSAS 18001 by LRQA.
"H:\Projects\40828 MSDC AQ Assessment for HRA and
AQMA\D Design\AQMA\Report\Scenario DPD\ Stonepound
AQMA_MSDC Scenario DPD_AQA_40828-WOOD-XX-XX-RP-
                                                                                    Document revisions
OA-0010_A_C01.2.docx"
                                                                                    No.       Details                                 Date

                                                                                    1         Draft                                   05/02/2020

                                                                                    2         Final                                   20/02/2020

                                                                                    3         Final v2                                02/03/2020

March 2020
Doc Ref. 40828-WOOD-XX-XX-RP-OA-0010_A_C01.2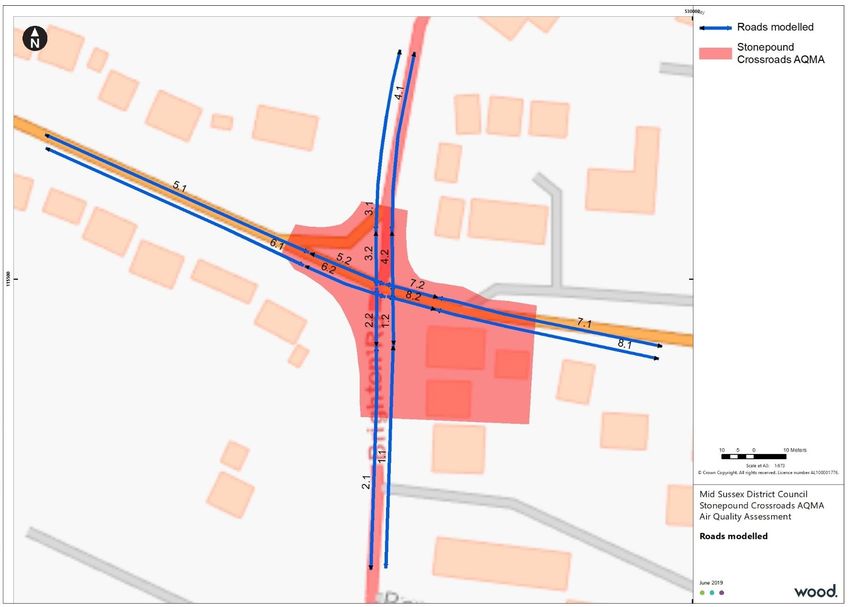
3    © Wood Environment & Infrastructure Solutions UK Limited

Executive summary

Purpose of this report
This report has been produced on behalf of Mid Sussex District Council (MSDC) to determine potential
significant air quality impacts in Stonepound Crossroads Air Quality Management Area (AQMA), to inform
the preparation of the MSDC Site Allocations Development Plan Document (DPD).

Transport modelling was carried out for nine different site allocation scenarios in total. This included both
housing and employment potential allocations. However, as a result of the Transport Assessment and other
evidence, only Scenarios 4, 7 and 8 were brought forward as potential site allocation options to be
considered in terms of impact to air quality at Ashdown Forest and Stonepound Crossroads. These three
scenarios represented the most realistic and deliverable mix of potential site allocations to be considered
further in the site selection process. All other scenarios were developed for internal use to test the transport
model and not taken forward. The Scenarios previously modelled for air quality are as follows:

           ⚫     Scenario 4 comprised 32 housing sites, plus a large site at Haywards Heath Golf Course (33
                 sites in total).

           ⚫     Scenario 7 comprised 26 housing constant sites, plus a large site at Haywards Heath Golf
                 Course (27 sites in total).

           ⚫     Scenario 8 comprised 26 housing constant sites, plus four sites at Folders Lane, Burgess Hill (30
                 sites in total).

More detailed information on the MSDC site allocation scenarios modelled (Scenarios 4, 7 and 8) are
provided in the Transport Assessment1. Scenarios 7 and 8 relate to the refined options developed by the
District Council as informed by a comprehensive site selection process and as considered by Sustainability
Appraisal (SA), transport, air quality and Habitats Regulations Assessment (HRA). These scenarios were taken
forward to the Regulation 18 consultation that was undertaken in autumn 2019.

This air quality assessment considers the site allocations in terms of the impact to air quality in the
Stonepound Crossroads AQMA following the Regulation 18 consultation. The current version of traffic data is
referred to as Sites DPD Scenario.

The Sites DPD Scenario comprised 22 housing sites, all of which are included in Scenario 8; some of the site
yields have been adjusted following further evidence testing.

The impacts of the site allocations on air quality at Ashdown Forest are included in a separate report2.
Similarly, impacts of the Scenarios 4, 7 and 8 site allocations on air quality at Ashdown Forest and
Stonepound Crossroads are included in separate air quality assessments3,4,5,6.

ADMS-Roads dispersion model has been used to model the dispersion of pollutants from traffic emissions at
residential receptors within and near the AQMA. Concentrations of NO2 were predicted without and with

1
  Systra (2019) Mid Sussex Transport Study.
2
  Wood (2020) Air quality modelling to inform the Site Allocations Development Plan Document – Ashdown Forest Sites DPD Scenario
Results.
3
  Wood (2019) Air quality modelling to inform Mid Sussex District Council Site Allocations Development Plan Document – Scenarios 4
results.
4
  Wood (2019) Air quality modelling to inform Mid Sussex District Council Site Allocations Development Plan Document – Scenarios 7
and 8 results.
5
  Wood (2019) Stonepound Crossroads AQMA – Site Allocations Development Plan Document – Scenarios 4 results.
6
  Wood (2019) Stonepound Crossroads AQMA – Site Allocations Development Plan Document – Scenarios 7 and 8 results.

March 2020
Doc Ref. 40828-WOOD-XX-XX-RP-OA-0010_A_C01.2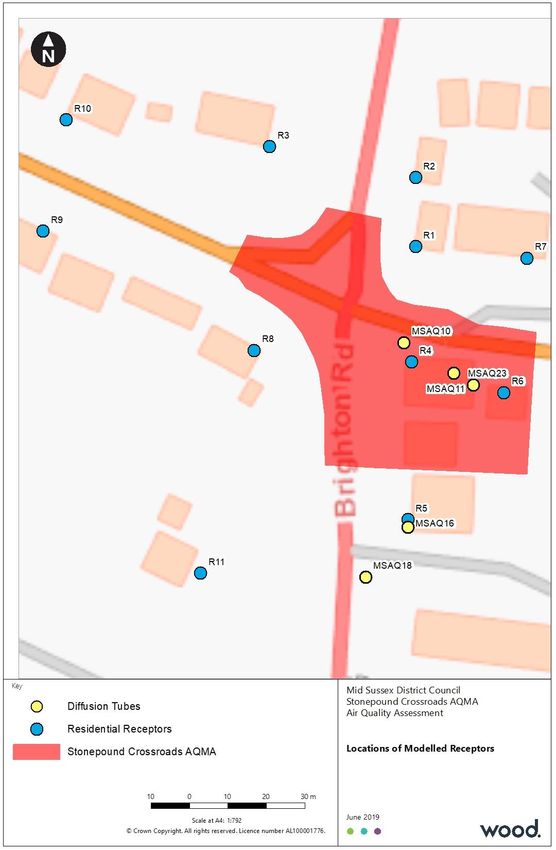
4     © Wood Environment & Infrastructure Solutions UK Limited

traffic flows associated with MSDC site allocations, including consideration of in-combination traffic flows
from adjoining local authorities’ development plans.

It should be noted that a conservative approach has been adopted throughout, including the assumption
that background concentrations will not improve in future years.

The main findings of the assessment include:

           ⚫     No exceedances of the NO2 Air Quality Objective (AQO) of 40 µgm-3 are predicted at any
                 receptor in 2031 in the Sites DPD Scenario, which include the MSDC site allocations together
                 with in-combination traffic flows from adjoining local authorities’ development plans;

           ⚫     With the Sites DPD Scenario, the highest predicted NO2 annual mean concentration at a
                 residential receptor is 29.9 µgm-3; and

           ⚫     Under IAQM/EPUK Guidance16 all residential receptors are predicted to experience ‘negligible
                 impacts’ with the Sites DPD Scenario operational. Therefore, the impact of the Sites DPD
                 Scenario is considered to be not significant.

March 2020
Doc Ref. 40828-WOOD-XX-XX-RP-OA-0010_A_C01.2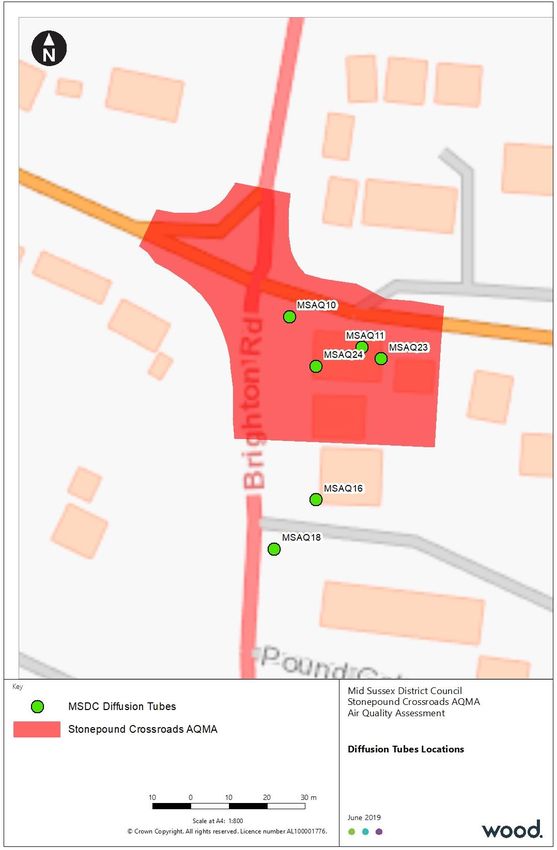
5     © Wood Environment & Infrastructure Solutions UK Limited

Contents

1.         Introduction                                                                                            7

2.         Policy and Legislative Context                                                                          9
2.1        Relevant policy                                                                                          9
2.2        Relevant legislation                                                                                     9
2.3        Relevant guidance                                                                                       10
           The Institute of Air Quality Management (IAQM) and Environmental Protection UK (EPUK)                   10

3.         Scope of the assessment                                                                                 12
3.1        Public exposure                                                                                         12
3.2        Receptor locations                                                                                      13

4.         Assessment methodology                                                                                  15
4.1        Dispersion modelling methodology                                                                        15
           The dispersion model                                                                                    15
           Model Scenarios                                                                                         15
           Meteorology                                                                                             15
           Surface roughness                                                                                       16
           Traffic data                                                                                            16
           Queuing traffic                                                                                         16
           Background concentrations                                                                               17
           Model verification                                                                                      17
           Emissions calculations of oxides of nitrogen (NOX)                                                      18

5.         Baseline air quality                                                                                    19
5.1        Nitrogen dioxide monitoring                                                                             19

6.         Results                                                                                                 22
6.1        Assessment of nitrogen dioxide impacts of the Sites DPD Scenario                                        22

7.         Conclusions                                                                                             24

           Table 2.1        Policy issues relevant to air quality assessment                                        9
           Table 2.2        Summary of relevant air quality standards and objectives                               10
           Table 3.1        Relevant locations of exposure                                                         12
           Table 3.2        Modelled receptors and diffusion tubes locations                                       13
           Table 4.1        Defra mapped interpolated background annual mean NO2 concentrations (µgm-3) for 2017   17
           Table 5.1        Diffusion tube located near the AQMA                                                   20
           Table 6.1        Model predicted annual mean NO2 concentrations (µgm-3)                                 23
           Table B1         ADMS-Roads input data                                                                  B2

March 2020
Doc Ref. 40828-WOOD-XX-XX-RP-OA-0010_A_C01.2
6     © Wood Environment & Infrastructure Solutions UK Limited

           Table B2         Roads parameters                                                                 B3
           Table C1         Local monitoring data suitable for ADMS-Roads model verification                 C3
           Table C2         Verification, modelled versus monitored                                          C3
           Table C3         Comparison of modelled and monitored road NOX to determine verification factor   C4
           Table C4         Comparison of adjusted modelled NO2 and modelled NO2                             C4
           Table C5         Assessment of model uncertainty                                                  C5

           Figure 1.1       Stonepound Crossroads AQMA location                                               8
           Figure 3.1       Modelled receptors and diffusion tubes locations                                 14
           Figure 4.1       Windrose for Gatwick Airport (2017)                                              16
           Figure 5.1       Diffusion tubes located near the AQMA                                            21
           Figure B1        ADMS-Roads input data                                                            B4
           Figure B2        Road links modelled to account for queuing in 2017 (top) and 2031 (bottom).      B5

           Appendix A       ADMS-Roads dispersion model
           Appendix B       Modelled Roads
           Appendix C       ADMS-Roads Model Verification

March 2020
Doc Ref. 40828-WOOD-XX-XX-RP-OA-0010_A_C01.2
7     © Wood Environment & Infrastructure Solutions UK Limited

1.         Introduction

Wood Environment and Infrastructure Solutions Ltd. (‘Wood’) has undertaken an air quality assessment on
behalf of Mid Sussex District Council (MSDC) to inform the preparation of the MSDC Site Allocations
Development Plan Document (DPD). The housing requirement for the MSDC District Plan has been agreed at
876 dwellings per annum (dpa) up to 2023/2024, and 1090 dpa to 2031 thereafter subject to further Habitats
Regulations Assessment work.

Transport modelling was carried out for nine different site allocation scenarios in total. This included both
housing and employment potential allocations. However, only Scenarios 4, 7 and 8 were brought forward as
potential site allocation options to be considered in terms of impact to air quality at Ashdown Forest and
Stonepound Crossroads. These three scenarios represented the most realistic and deliverable mix of potential
site allocations to be considered further in the site selection process. All other scenarios were developed for
internal use to test the transport model and not taken forward. The Scenarios modelled for air quality are as
follows:

           ⚫     Scenario 4 comprised 32 housing sites, plus a large site at Haywards Heath Golf Course (33
                 sites in total).

           ⚫     Scenario 7 comprised 26 housing constant sites, plus a large site at Haywards Heath Golf
                 Course (27 sites in total).

           ⚫     Scenario 8 comprised 26 housing constant sites, plus four sites at Folders Lane, Burgess Hill (30
                 sites in total).

More detailed information on the three MSDC site allocation scenarios modelled (Scenarios 4, 7 and 8) are
provided in the Transport Assessment1. Scenarios 7 and 8 relate to the refined options developed by the
District Council as informed by a comprehensive site selection process and as considered by Sustainability
Appraisal (SA), transport, air quality and Habitats Regulations Assessment (HRA). These scenarios were taken
forward to the Regulation 18 consultation that was undertaken in autumn 2019.

This air quality assessment considers the Sites DPD Scenario in terms of the impact to air quality in the
Stonepound Crossroads AQMA. This is a more refined scenario following the Regulation 18 consultation.

The Sites DPD Scenario comprised 22 housing sites, all of which are included in Scenario 8; some of the site
yields have been adjusted following further evidence testing.

The impacts of the Sites DPD Scenario site allocations on air quality at Ashdown Forest are included in a
separate report2. Similarly, impacts of the Scenarios 7 and 8, and 4 site allocations on air quality at Ashdown
Forest and Stonepound Crossroads are included in separate air quality assessments3,4,5,6.

Figure 1.1 shows the location of the Stonepound Crossroads AQMA in Hassocks.

March 2020
Doc Ref. 40828-WOOD-XX-XX-RP-OA-0010_A_C01.2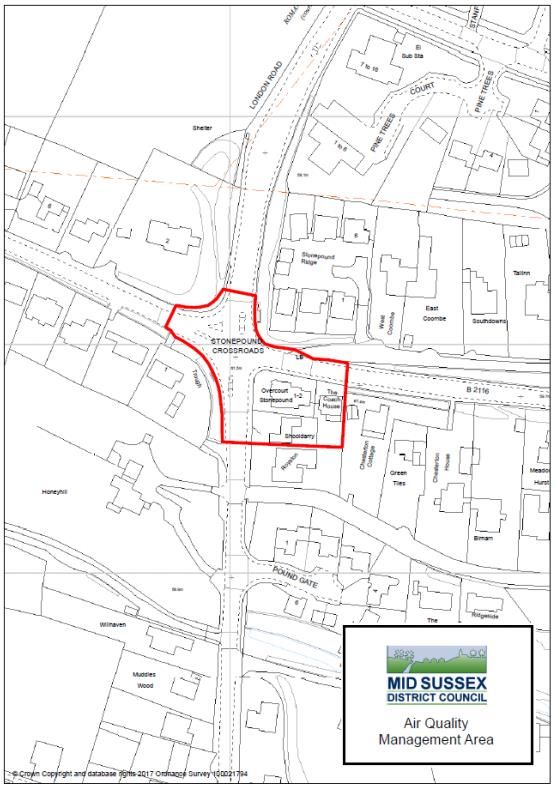
8     © Wood Environment & Infrastructure Solutions UK Limited

Figure 1.1     Stonepound Crossroads AQMA location

March 2020
Doc Ref. 40828-WOOD-XX-XX-RP-OA-0010_A_C01.2

9    © Wood Environment & Infrastructure Solutions UK Limited

2.          Policy and Legislative Context

2.1         Relevant policy
Table 2.1 provides a summary of the key topic-specific policies which have informed the scope of the
assessment and are relevant to the assessment of the effects on air quality.

Table 2.1      Policy issues relevant to air quality assessment

Policy reference           Policy issues

National Policy

National Planning          It is stated in the NPPG (Paragraph: 005 Reference ID: 32-005-20140306) that air quality is relevant to
Practice Guidance          planning applications when the development could “Expose people to existing sources of air pollutants. This
(NPPG) March 20147         could be by building new homes, workplaces or other development in places with poor air quality.”

National Planning          Paragraph 181 of the NPPF states that “Planning policies and decisions should sustain and contribute towards
Policy Framework           compliance with relevant limit values or national objectives for pollutants, taking into account the presence of
(NPPF) February            Air Quality Management Areas and Clean Air Zones, and the cumulative impacts from individual sites in local
20198                      areas” and “Planning decisions should ensure that any new development in Air Quality Management Areas
                           and Clean Air Zones is consistent with the local air quality action plan”.

2.2         Relevant legislation
The legislative framework for air quality consists of legally enforceable EU Limit Values that are transposed
into UK legislation as Air Quality Standards (AQS) that must be at least as challenging as the EU Limit Values.
Action in the UK is then driven by the UK’s Air Quality Strategy 9 that sets the Air Quality Objectives (AQOs).

The EU Limit Values are set by the European directive on air quality and cleaner air for Europe (2008/50/EC) 10
and the European directive relating to arsenic, cadmium, mercury, nickel, and polycyclic aromatic
hydrocarbons in ambient air (2004/107/EC) 11 as the principal instruments governing outdoor ambient air
quality policy in the EU. The Limit Values are legally binding levels for concentrations of pollutants for
outdoor air quality.

The two European directives, as well as the Council’s decision on exchange of information were transposed
into UK Law via the Air Quality Standards Regulations 201012, which came into force in the UK on 11 June
2010, replacing the Air Quality Standards Regulations 2007 13. Air Quality Standards are concentrations
recorded over a given time period, which are considered to be acceptable in terms of what is scientifically
known about the effects of each pollutant on health and on the environment. The Air Quality Strategy sets
the AQOs, which give target dates and some interim target dates to help the UK move towards achievement

7
  Ministry of Housing, Communities and Local Government (2014) National Planning Practice Guidance – Air quality
8
  Ministry of Housing, Communities and Local Government (2019) National Planning Policy Framework
9
  Defra in partnership with the Scottish Executive, Welsh Assembly Government and Department of the Environment Northern Ireland
(2007) The Air Quality Strategy for England, Scotland, Wales and Northern Ireland.
10
   Official Journal of the European Union, (2008) Directive 2008/50/EC of the European Parliament and of The Council of 21 May 2008 on
ambient air quality and cleaner air in Europe.
11
   Official Journal of the European Union, (2004) Directive 2004/107/EC of the European Parliament and of The Council of 15 December
2004 relating to arsenic, cadmium, mercury, nickel and polycyclic aromatic hydrocarbons in ambient air.
12
   The Stationery Office Limited (2010) Statutory Instrument 2010 No. 1001 Environmental Protection – The Air Quality Standards
Regulation 2010.
13
   The Stationery Office Limited (2007) Statutory Instrument 2010 No. 64 Environmental Protection – The Air Quality Standards
Regulation 2007.

March 2020
Doc Ref. 40828-WOOD-XX-XX-RP-OA-0010_A_C01.2
10   © Wood Environment & Infrastructure Solutions UK Limited

of the EU Limit Values. The AQOs are a statement of policy intentions or policy targets and as such, there is
no legal requirement to meet these objectives except in as far as they mirror any equivalent legally binding
Limit Values in EU legislation. The most recent UK Air Quality Strategy for England, Scotland, Wales and
Northern Ireland was published in July 2007.

Since Part IV of the Environment Act 1995 14 came into force, local authorities have been required periodically
to review concentrations of the UK Air Quality Strategy pollutants within their areas and to identify areas
where the AQOs may not be achieved by their relevant target dates. This process of Local Air Quality
Management (LAQM) is an integral part of delivering the Government’s AQOs detailed in the Strategy. When
areas are identified where some or all of the AQOs might potentially be exceeded and where there is relevant
public exposure, i.e. where members of the public would regularly be exposed over the appropriate
averaging period, the local authority has a duty to declare an AQMA and to implement an Air Quality Action
Plan (AQAP) to reduce air pollution levels towards the AQOs. The latest guidance on the LAQM process is
given in Defra’s 2016 Local Air Quality Management Technical Guidance (LAQM TG (16))15.

The UK Government and the Devolved Administrations have set national AQOs for particulate matter smaller
than 2.5 µm in diameter (PM2.5). These objectives have not been incorporated into the LAQM Regime, and
authorities have no statutory obligation to review and assess air quality against them.

Emissions of nitrogen oxides (NOX), have been modelled in this assessment in order to assess concentrations
of NO2, as this is the pollutant relevant to the Stonepound Crossroads AQMA. The NOX (NO and NO2)
emitted from vehicle exhausts and other combustion sources undergoes photochemical oxidation in the
atmosphere, with NO2 being formed by oxidation of NO to NO2 and, conversely, NO2 undergoing photolysis
(in the presence of sunlight) to create NO and ozone.

For NO2, it is the annual mean objective that is the more stringent AQO; it is generally considered that the 1-
hour mean NO2 AQO will not be exceeded if the annual mean objective is not exceeded. Table 2.2 sets out
the AQOs that are relevant to this assessment, and the dates by which they are to be achieved.

Table 2.2       Summary of relevant air quality standards and objectives

Pollutant                Objective (UK)                              Averaging       Date to be Achieved by and Maintained
                                                                     Period          thereafter (UK)

Nitrogen dioxide -       200 µgm-3 not to be exceeded more than      1-hour mean     31 Dec 2005
NO2                      18 times a year

                         40 µgm-3                                    Annual mean     31 Dec 2005

The likelihood of exceeding the NO2 and PM10 short-term AQOs can be assessed with reference to the
predicted annual means and the relationships recommended by LAQM.TG(16):

The 1-hour mean NO2 objective is unlikely to be exceeded15 if the annual mean is less than 60 µgm-3.

2.3         Relevant guidance

The Institute of Air Quality Management (IAQM) and Environmental Protection UK (EPUK)
The IAQM and Environmental Protection UK (EPUK) has produced guidance16 regarding the assessment of air
quality issues within planning applications, which includes a summary of relevant legislation and the
assessment of significance. Using this guidance, the magnitude of change due to an increase/decrease in the

14
   HMSO (1995) Environment Act 1995.
15
   Defra (2016) Local Air Quality Management Technical Guidance LAQM.TG (16).
16
   IAQM and EPUK (2017) Land-Use Planning & Development Control: Planning For Air Quality

March 2020
Doc Ref. 40828-WOOD-XX-XX-RP-OA-0010_A_C01.2
11 © Wood Environment & Infrastructure Solutions UK Limited annual mean concentration of NO2 and PM10 and other pollutants due to the development is described using specified criteria. The overall significance of the development is then determined using professional judgement. March 2020 Doc Ref. 40828-WOOD-XX-XX-RP-OA-0010_A_C01.2
12     © Wood Environment & Infrastructure Solutions UK Limited

3.          Scope of the assessment

The Stonepound Crossroads AQMA was declared in 2012 due to high levels of NO 2 (annual mean) for which
source apportionment showed that traffic sources were the main contributor. Therefore, the potential impact
of an increase in traffic flows due to the housing requirement outlined in the Mid Sussex District Plan is an
important consideration. NO2, PM10 and PM2.5 are the pollutants most associated with traffic emissions. As an
AQMA was declared for NO2 concentration and PM10 and PM2.5 are comfortably within the related AQS, the
assessment focuses on NO2 only.

3.1          Public exposure
Guidance from the UK Government and Devolved Administrations makes clear that exceedance of the health
based objectives should be assessed at outdoor locations where members of the general public are regularly
present over the averaging time of the objective. Workplaces are excluded, as explained in Table 3.1 which
provides an indication of those locations that may or may not be relevant for each averaging period.

Table 3.1       Relevant locations of exposure

Averaging            Objectives should apply at:                                       Objectives should generally not apply at:
Period

Annual mean          All locations where members of the public might be                Building facades of offices or other places of work
                     regularly exposed                                                 where members of the public do not have regular
                                                                                       access.

                     Building facades of residential properties, schools, hospitals,   Hotels, unless people live there as their permanent
                     care homes etc.                                                   residence.

                                                                                       Gardens of residential properties.

                                                                                       Kerbside sites (as opposed to locations at the
                                                                                       building façade), or any other location where
                                                                                       public exposure is expected to be short term.

24-hour mean         All locations where the annual mean objectives would apply,       Kerbside sites (as opposed to locations at the
and 8-hour mean      together with hotels                                              building façade), or any other location where
                                                                                       public exposure is expected to be short term.

                     Gardens or residential properties1

1-hour mean          All locations where the annual mean and 24 and 8-hour             Kerbside sites where the public would not be
                     mean objectives would apply.                                      expected to have regular access.

                     Kerbside sites (e.g. pavements of busy shopping streets).

                     Those parts of car parks, bus stations and railway stations
                     etc. which are not fully enclosed, where the public might
                     reasonably be expected to spend one hour or more.

                     Any outdoor locations at which the public may be expected
                     to spend one hour or longer.

Note: 1 For gardens and playgrounds, such locations should represent parts of the garden where relevant public exposure is likely, for
example where there is seating or play areas. It is unlikely that relevant public exposure would occur at the extremities of the garden
boundary, or in front gardens, although local judgement should always be applied.

March 2020
Doc Ref. 40828-WOOD-XX-XX-RP-OA-0010_A_C01.2
13 © Wood Environment & Infrastructure Solutions UK Limited 3.2 Receptor locations Local receptors have been identified, focusing on residential properties within and near the Stonepound Crossroads AQMA, alongside roads potentially affected by the development. These receptors represent ‘worst-case’ locations where people are likely to be regularly exposed (i.e. where the annual mean objective is applicable). Pollutant concentrations have been predicted at existing building façades within and near the AQMA boundary. Pollutant concentrations have also been predicted at five diffusion tubes located within and near the AQMA for the model verification purpose. A height of 1.5m was used for the residential receptors to represent an average human inhalation height. Table 3.2 and Figure 3.1 shows the proposed and existing receptor locations. Table 3.2 Modelled receptors and diffusion tubes locations Receptor Receptor Type X (m) Y (m) Height (m) R1 Residential 529920 115514 1.5 R2 Residential 529920 115532 1.5 R3 Residential 529882 115540 1.5 R4 Residential 529919 115484 1.5 R5 Residential 529918 115443 1.5 R6 Residential 529943 115476 1.5 R7 Residential 529949 115511 1.5 R8 Residential 529878 115487 1.5 R9 Residential 529823 115518 1.5 R10 Residential 529829 115547 1.5 R11 Residential 529864 115429 1.5 MSAQ10 Diffusion tube 529917 115489 1.7 MSAQ11 Diffusion tube 529930 115481 2.5 MSAQ16 Diffusion tube 529918 115441 2.4 MSAQ18 Diffusion tube 529907 115428 2.5 MSAQ23 Diffusion tube 529935 115478 2 March 2020 Doc Ref. 40828-WOOD-XX-XX-RP-OA-0010_A_C01.2
14     © Wood Environment & Infrastructure Solutions UK Limited

Figure 3.1          Modelled receptors and diffusion tubes locations

March 2020
Doc Ref. 40828-WOOD-XX-XX-RP-OA-0010_A_C01.2
15   © Wood Environment & Infrastructure Solutions UK Limited

4.          Assessment methodology

4.1         Dispersion modelling methodology

The dispersion model
ADMS-Roads (v4.1) has been used to predict annual mean and daily mean concentrations of NO2 at
modelled residential receptor locations. Full details of the ADMS-Roads model used are provided in
Appendix A.

Annual mean concentrations of NO2 were derived from the model-predicted NOX concentrations, through
application of the NOX to NO2 conversion tool version 7.1 developed for LAQM purposes 17.

The modelling assessment requires source, emissions, meteorological and other site-specific data. For
modelling traffic impacts, one year of hourly sequential meteorological data is used and model verification is
carried out following Defra guidance18.

Model Scenarios
The modelled scenarios include:

            ⚫     Model verification: using 2017 background concentrations, emissions factors, monitoring data,
                  and traffic flows (which is the year in which the traffic counts were carried out and the baseline
                  traffic model is validated for);

            ⚫     2017 Baseline: using 2017 background concentrations, emissions factors and traffic flows;

            ⚫     Reference Case: 2031 Baseline + in-combination – using 2017 background concentrations, 2030
                  emission factors and predicted traffic flows; and

            ⚫     Sites DPD Scenario: 2031 Baseline + in-combination + MSDC Sites DPD Scenario impact –
                  using 2017 background concentrations, 2030 emissions factors and predicted traffic flows.

Meteorology
Detailed dispersion modelling requires hourly sequential meteorological data from a representative synoptic
observing station. Hourly sequential meteorological data was obtained for the year 2017 for Gatwick Airport,
which is considered to provide representative data for the area of interest.

Figure 4.1 summarises the hourly wind speed and direction for the meteorological data used in this
assessment.

17
   AEA Technology (2019). NOx to NO2 Calculator version 7.1. http://laqm.defra.gov.uk/review-and-assessment/tools/background-
maps.html#NOxNO2calc
18
   Defra (2016) Local Air Quality Management Technical Guidance (LAQM.TG(16)).

March 2020
Doc Ref. 40828-WOOD-XX-XX-RP-OA-0010_A_C01.2
16 © Wood Environment & Infrastructure Solutions UK Limited
Figure 4.1 Windrose for Gatwick Airport (2017)
Surface roughness
Surface roughness is determined based on land use within the assessment area and at the appropriate
weather station. For this assessment, a surface roughness of 0.5 m was selected for the assessment area and
a surface roughness of 0.2 m was used for Gatwick Airport Weather Station 19.
Traffic data
Systra developed the Mid Sussex Strategic Highway Model (MSSHM) in accordance with Department for
Transport (DfT) transport analysis guidance (TAG). The modelling has been undertaken in collaboration with
West Sussex County Council (WSCC) and Highways England (HE) and is considered to be suitable for the
purposes of the Transport Study, and for providing inputs to wider work including air quality modelling.
Annual Average Daily Traffic (AADT) flows for 2031 were provided by Systra, Transport Consultants for the
project based on traffic counts outlined in the model validation report 20. Systra provided the traffic data for
Scenario DPD by email21. Traffic data for modelled links are provided in Appendix B.
Queuing traffic
As information regarding queuing traffic at the junction was provided, emission from queuing traffic was also
included in the assessment. Queue lengths were estimated using the expected number of vehicles in the
queues and an assumption of vehicle length (4m for a car). Queuing vehicles were modelled at the lowest
possible speed in ADMS-Roads, 5 kph. To account for the variation in queueing traffic throughout the day, a
time-varying (.fac) file that modelled queuing traffic between 0600 and 2000 was applied to the model.
Estimated queue lengths were provided by Systra22. The length of the queue links modelled were as follows.
⚫ 2017: 40m; and
19
Gatwick Airport (2014) A Second Runway for Gatwick.
20
Systra (2018) Local Model Validation Report – Mid Sussex Strategic Highway Model - Draft.
21
Email from Systra dated 10 January 2020.
22
Email from Systra dated 18 December 2019.
March 2020
Doc Ref. 40828-WOOD-XX-XX-RP-OA-0010_A_C01.217 © Wood Environment & Infrastructure Solutions UK Limited
⚫ 2031: 100m.
Background concentrations
Defra has made estimates of background pollution concentrations on a 1 km 2 grid for the UK for seven of the
main pollutants, including NOX and NO2, using data for a base year of 2017, making projections for years
from 2017 to 2030 inclusive23. Interpolation was carried out using ArcGIS to provide a better representation
of background concentration at each receptor point.
Due to uncertainty in future predicted concentrations, background concentrations for 2017 will be used in all
modelled scenarios.
Table 4.1 shows the estimated background concentrations of NO2 for 2017 for the receptor modelled.
Table 4.1 Defra mapped interpolated background annual mean NO2 concentrations (µgm-3) for 2017
Receptors modelled Receptor Type NO2 concentrations (µgm-3)
R1 Residential 10.2
R2 Residential 10.2
R3 Residential 10.2
R4 Residential 10.2
R5 Residential 10.2
R6 Residential 10.3
R7 Residential 10.3
R8 Residential 10.2
R9 Residential 10.2
R10 Residential 10.2
R11 Residential 10.2
MSAQ10 Diffusion tube 10.2
MSAQ11 Diffusion tube 10.3
MSAQ16 Diffusion tube 10.2
MSAQ18 Diffusion tube 10.2
MSAQ23 Diffusion tube 10.3
Model verification
Model verification is a process by which modelled concentrations of air pollutants from road traffic emissions
are adjusted based on actual measurement data. It enables an estimation of uncertainty and systematic
errors associated with the dispersion modelling components of the air quality assessment to be considered.
There are many explanations for these errors, which may stem from uncertainty in the modelled number of
23
https://uk-air.defra.gov.uk/data/laqm-background-home
March 2020
Doc Ref. 40828-WOOD-XX-XX-RP-OA-0010_A_C01.218 © Wood Environment & Infrastructure Solutions UK Limited vehicles, speeds and vehicle fleet composition, as well as uncertainty associated with the emission factors. Defra has provided guidance in terms of preferred methods for undertaking dispersion model verification in LAQM.TG(16). Model verification involves the comparison of modelled concentrations and local monitoring data. Suitable local monitoring data for the purpose of verification is available for annual mean NO X/NO2 concentrations as shown in Table C1 below. Monitoring sites MSAQ10, MSAQ11, MSAQ16, MSAQ18 and MSAQ23 were used for verification purposes as they are located on modelled roads for this assessment. Diffusion tube MSAQ24 was not used in the verification. The tube is located behind a hedge, which is likely to affect dispersion in a way that cannot be replicated by the model. Full details of the model verification procedure are provided in Appendix C. In summary, the verification process led to the use of a modelled Road-NOX adjustment factor of 1.495. Emissions calculations of oxides of nitrogen (NOX) Air Quality Consultants’ Calculator Using Realistic Emissions for Diesels24 (CURED V3A) was used to predict emissions to be imported into ADMS-Roads. This tool was originally developed to overcome the disparity between future emissions factors predicted using Defra’s Emissions factor Toolkit (EFT) and real-world emissions testing and is considered to be a more conservative approach. Road-NOX concentrations were adjusted using the above factor. 24 Air Quality Consultants (2018) Calculator Using Realistic Emissions for Diesels (CURED V3A). http://www.aqconsultants.co.uk/News/January-2018/UPDATED-CURED-TO-V3A.aspx March 2020 Doc Ref. 40828-WOOD-XX-XX-RP-OA-0010_A_C01.2
19   © Wood Environment & Infrastructure Solutions UK Limited

5.          Baseline air quality

MSDC carry out monitoring as part of their LAQM duties within and near Stonepound Crossroads. The 2019
Annual Status Report (ASR)25 states that the main source of air pollution in the district is road traffic
emissions mostly from major roads, notably the HGV traffic on the A2300 link from the A23 and the A273
north and south of Hassocks. Air quality monitoring and modelling carried out by MSDC indicated that,
despite good air quality within most of the District, the NO2 AQO were not being met at the Stonepound
Crossroads. Therefore, in March 2012 an AQMA was declared at Stonepound Crossroads in Hassocks. Within
the AQMA the main pollutant (NO2) is from road traffic emissions. Exceedances are due to the topography
and volume of road traffic. Monitoring results near the AQMA in 2018 show a slight increase in NO2 levels
across the district compared to those recorded in 2017, but the long-term trend since 2013 appears to be
downwards.

For the model verification, monitoring data from 2017 was used in order to be aligned with the traffic data
base year.

5.1         Nitrogen dioxide monitoring
Diffusion tubes were deployed by Mid Sussex District Council at a number of locations within and near the
AQMA. Table 5.1 presents annual average NO2 concentrations obtained from diffusion tubes located near
Stonepound Crossroads AQMA, as reported in the MSDC 2019 ASR.

25
  Mid Sussex District Council (2019). 2019 Air Quality Annual Status Report (ASR). https://www.midsussex.gov.uk/media/4551/2019-air-
quality-annual-statement-status-report.pdf

March 2020
Doc Ref. 40828-WOOD-XX-XX-RP-OA-0010_A_C01.2
20     © Wood Environment & Infrastructure Solutions UK Limited

Figure 5.1 shows the location of monitors included in this section.

Table 5.1      Diffusion tube located near the AQMA

                                                                                    Annual mean concentration of NO2 (µgm-3)

Monitor ID          X (m)         Y (m)          Distance from road (m)      2013       2014     2015     2016     2017    2018

MSAQ10             529911        115489                      1.5             48.2       41.1     40.4     43.4     38.8        41.2

MSAQ11             529930        115481                      5.5             43.4       42.7     40.5     43.2     38.5        40.1

MSAQ16             529918        115441                     11.5             24.4       20.4     19.2     20.7     19.8        19.9

MSAQ18             529907        115428                      2.0             35.2       33.3     32.2     33.4     29.5        28.1

MSAQ23             529935        115478                      5.8             35.4       33.3     31.8     35.3     33.9        34.5

Exceedances of the NO2 annual mean objective of 40µg/m3 are shown in bold.

The above diffusion tubes were all used in the model verification, except MSAQ24. The tube is located behind
a hedge, which is likely to affect dispersion in a way that cannot be replicated by the model. Full details are
included in Appendix C.

March 2020
Doc Ref. 40828-WOOD-XX-XX-RP-OA-0010_A_C01.2
21 © Wood Environment & Infrastructure Solutions UK Limited Figure 5.1 Diffusion tubes located near the AQMA March 2020 Doc Ref. 40828-WOOD-XX-XX-RP-OA-0010_A_C01.2
22     © Wood Environment & Infrastructure Solutions UK Limited

6.         Results

6.1        Assessment of nitrogen dioxide impacts of the Sites DPD Scenario
Table 6.1 presents the annual mean NO2 concentrations predicted for the 2017 baseline, the 2031 Reference
Case and the 2031 Sites DPD Scenario. In 2031, all concentrations are predicted to be below the NO2 AQO of
40 µgm-3.

The 1-hour mean NO2 objective is unlikely to be exceeded as the annual mean is less than 60 µgm -3 at all
modelled receptor locations.

With the Sites DPD Scenario operational, the highest annual mean concentration predicted at a residential
receptor is 29.9 µgm-3 at receptor R1 located to the northeast of the Stonepound Crossroads on Keymer
Road. This concentration is below the AQO of 40 µgm-3 and under IAQM/EPUK Guidance on “Planning for Air
Quality” 16, an increase of
23     © Wood Environment & Infrastructure Solutions UK Limited

Table 6.1      Model predicted annual mean NO2 concentrations (µgm-3)

Receptors    2017 Baseline      Reference           Sites DPD       Difference   Change   Assessment Concentration   Impact16
             (µgm-3)            Case – 2031         Scenario –      (µgm-3)      (%)      in percentage of AQS (%)
                                (µgm-3)             2031 (µgm-3)

R1                 40.5               28.8                29.9         1.0         3%               75%              Negligible

R2                 37.7               28.6                29.5         0.9         2%               74%              Negligible

R3                 26.5               20.6                21.5         0.9         2%               54%              Negligible

R4                 37.1               27.2                27.9         0.7         2%               70%              Negligible

R5                 25.0               21.3                21.6         0.3         1%               54%              Negligible

R6                 25.2               20.7                21.2         0.5         1%               53%              Negligible

R7                 26.2               20.9                21.5         0.6         2%               54%              Negligible

R8                 23.6               17.8                18.3         0.4         1%               46%              Negligible

R9                 18.1               15.7                16.2         0.6         1%               41%              Negligible

R10                22.0               19.2                20.5         1.2         3%               51%              Negligible

R11                14.0               12.8                12.9         0.1         0%               32%              Negligible

Notes: Bold denotes exceedance of the 40 µgm-3 annual mean NO2 AQO.

March 2020
Doc Ref. 40828-WOOD-XX-XX-RP-OA-0010_A_C01.2
24 © Wood Environment & Infrastructure Solutions UK Limited
7. Conclusions
Wood Environment and Infrastructure Solutions Ltd. (Wood) has prepared an air quality assessment on
behalf of Mid Sussex District Council (MSDC) for preparation of the MSDC Site Allocations Development Plan
Document. This assessment is based on the Sites DPD Scenario site allocations and considers the potential air
quality impact in Stonepound Crossroads AQMA in Hassocks.
ADMS-Roads dispersion model has been used to model pollutants from traffic emissions in Stonepound
Crossroads AQMA. Concentrations of NO2 were predicted without and with traffic flows associated with
MSDC Sites DPD Scenario site allocations, including consideration of in-combination traffic flows from
adjoining local authorities’ development plans. It should be noted that a conservative approach has been
adopted throughout, including the assumption that background concentrations will not improve in future
years.
The main findings of the assessment include:
⚫ No exceedances of the NO2 Air Quality Objective (AQO) of 40 µgm-3 are predicted at any
receptor in 2031 in the Sites DPD Scenario, which include the MSDC site allocations together
with in-combination traffic flows from adjoining local authorities’ development plans;
⚫ With the Sites DPD Scenario, the highest predicted NO2 annual mean concentration at a
residential receptor is 29.9 µgm-3; and
⚫ Under IAQM/EPUK Guidance16 all residential receptors are predicted to experience ‘negligible
impacts’ with the Sites DPD Scenario operational. Therefore, the impact of the Sites DPD
Scenario is considered to be not significant.
March 2020
Doc Ref. 40828-WOOD-XX-XX-RP-OA-0010_A_C01.2A1 © Wood Environment & Infrastructure Solutions UK Limited Appendix A ADMS-Roads dispersion model March 2020 Doc Ref. 40828-WOOD-XX-XX-RP-OA-0010_A_C01.2
A2   © Wood Environment & Infrastructure Solutions UK Limited

Introduction
The ADMS-Roads dispersion model, developed by CERC6, is a tool for investigating air pollution problems
due to small networks of roads that may be in combination with industrial sites, for instance small towns or
rural road networks. It calculates pollutant concentrations over specified domains at high spatial resolution
(street scale) and in a format suitable for direct comparison with a wide variety of air quality standards for the
UK and other countries. The latest version of the model, version 4.1, was used in this study.

ADMS-Roads is referred to as an advanced Gaussian or, new generation, dispersion model as it incorporates
the latest understanding of the boundary layer structure. It differs from old generation models such as ISC,
R91 and CALINE in two main respects:

            ⚫   It characterises the boundary layer structure and stability using the boundary layer depth and
                Monin-Obukhov length to calculate height-dependent wind speed and turbulence, rather than
                using the simpler Pasquill-Gifford stability category approach; and

            ⚫   It uses a skewed-Gaussian vertical concentration profile in convective meteorological conditions
                to represent the effect of thermally generated turbulence.

Model features
A description of the science used in ADMS-Roads and the supporting technical references can be found in
the model’s User Guide26. The main features of ADMS-Roads are:

            ⚫   It is an advanced Gaussian, “new generation” dispersion model;

            ⚫   Includes a meteorological pre-processor which calculates boundary layer parameters from a
                variety of input data e.g. wind speed, day, time, cloud cover and air temperature;

            ⚫   Models the full range of source types encountered in urban areas including industrial sources
                (up to 3 point sources, up to 3 lines sources, up to 4 area sources, up to 25 volume sources) and
                road sources (up to 150 roads, each with 50 vertices);

            ⚫   Generates output in terms of average concentrations for averaging times from 15minutes to 1
                year, percentile values and exceedances of threshold values. Averages can be specified as rolling
                (running) averages or maximum daily values;

            ⚫   The option to calculate emissions from traffic count data, speed and fleet split (light duty/ heavy
                duty vehicles) using UK emission factors. Alternatively, road emissions may be entered directly
                as user specified values;

            ⚫   Models plume rise by solving the integral conservation equations for mass, momentum and
                heat;

            ⚫   Models the effect of street canyons on concentrations within the canyon and vehicle–induced
                turbulence using a formulation based on the Danish OSPM model. It is usually only important to
                model street canyons when the aspect ratio (ratio of the height of buildings along the road to
                the width of the road) is greater than 0.5;

            ⚫   Models the effects of noise barriers on concentrations outside the road;

            ⚫   Models NOX chemistry using the 8 reaction Generic Reaction Set plus transformation of SO 2 to
                sulphate particles, which are added to the PM10 concentration;

26
  CERC (2011) ADMS-Roads, an Air Quality Management System, Version 3.1 User Guide, http://www.cerc.co.uk/environmental-
software/assets/data/doc_userguides/CERC_ADMS-Roads3.1_User_Guide.pdf Date of access: 19th October 2012.

March 2020
Doc Ref: 40828-WOOD-XX-XX-RP-OA-0010_A_C01.2
A3 © Wood Environment & Infrastructure Solutions UK Limited
⚫ Models the effect of a small number of buildings on dispersion from point sources;
⚫ Models the effect of complex terrain (hills) and spatially varying surface roughness. Terrain
effects only become noticeable for gradients greater than 1:10, but for ground level sources in a
built up area, such as urban roads, low gradients will have a negligible effect;
⚫ Models concentrations in units of ouEm-3 for odour studies;
⚫ Link to MapInfo and ArcGIS for input of source geometry, display of sources, aggregation of
emissions and plotting of contours; and
⚫ Link to an emissions inventory in Microsoft Access for input and export of source and emissions
data.
In this study, street canyons, noise barriers, buildings and complex terrain were not modelled.
Validation
ADMS-Roads has been validated using UK and US data and has been compared with the DMRB spreadsheet
model and the US model, CALINE. Validation of the ADMS and ADMS-Urban models are also applicable to
the performance of ADMS-Roads as they test common features: basic dispersion, modelling of roads and
street canyons, the effect of buildings and the effect of complex terrain. These validation studies are all
reported on the CERC web site27. In addition, ADMS-Urban has been validated during its use in modelling
many urban areas in the UK for local authorities as part of LAQM, Heathrow Airport for the Department for
Transport28 and all of Greater London for a Defra model inter-comparison exercise29.
27 http://www.cerc.co.uk/environmental-software/model-documentation.html#validation Date of access: 19 October 2012
28 CERC (2007) Air Quality Studies for Heathrow: Base Case, Segregated Mode, Mixed Mode and Third Runway Scenarios Modelled Using
ADMS-Airport, prepared for the Department for Transport, HMSO Product code 78APD02904CERC
29 Carslaw, D. (2011), Defra urban model evaluation analysis – Phase 1, a report to Defra and the Devolved Authorities. http://uk-
air.defra.gov.uk/library/reports?report_id=654 Date of access: 19 October 2012
March 2020
Doc Ref: 40828-WOOD-XX-XX-RP-OA-0010_A_C01.2B1 © Wood Environment & Infrastructure Solutions UK Limited Appendix B Modelled Roads March 2020 Doc Ref. 40828-WOOD-XX-XX-RP-OA-0010_A_C01.2
B2     © Wood Environment & Infrastructure Solutions UK Limited

Tables B1 shows the traffic data supplied by Systra based on traffic surveys. Data includes AADT, the
proportion of Heavy Goods Vehicles (HGV), and speeds averaged over AM and PM peak hours.

Table B2 shows the road names and their relevant link index numbers as provided by Systra. Each road
modelled was split into two links to account for a lower speed (5kph) approaching a junction.

Queuing traffic was also included in the model and the queuing road links are included in Table B1 and B2.

The roads modelled are represented in Figure B1, and the road links modelled to represent queuing are
represented in Figure B2.

Table B1       ADMS-Roads input data

                                                                2031                            2031
Source ID             2017 Baseline
                                                           Reference Case                Sites DPD Scenario

            AADT      %HDV       Speed (kph)      AADT      %HDV    Speed (kph)   AADT     %HDV     Speed (kph)

1.1          6096       2.2           32.0         7813       1.8       32.0      9110       1.4        32.0

1.2          6096       2.2           5.0          7813       1.8       32.0      9110       1.4        32.0

2.1          6626       7.0           12.1         7064       6.7           8.7   6153       7.5         7.4

2.2          6626       7.0           5.0          7064       6.7           8.7   6153       7.5         7.4

3.1          9620       3.6           32.0        11185       3.0       30.3      11434      3.0        30.3

3.2          9620       3.6           5.0         11185       3.0       30.3      11434      3.0        30.3

4.1          7160       2.7           4.7          9765       1.8           5.0   10724      1.5         5.0

4.2          7160       2.7           5.0          9765       1.8           5.0   10724      1.5         5.0

5.1          6107       1.5           22.2         6028       1.7       16.2      7779       1.4        15.7

5.2          6107       1.5           5.0          6028       1.7       16.2      7779       1.4        15.7

6.1          7026       4.0           31.4         6704       4.0       31.4      6280       4.2        31.4

6.2          7026       4.0           5.0          6704       4.0       31.4      6280       4.2        31.4

7.1          3066       2.2           31.6         4335       2.0       31.6      5211       1.7        31.6

7.2          3066       2.2           5.0          4335       2.0       31.6      5211       1.7        31.6

8.1          5781       1.5           11.6         7030       1.4       10.2      7124       1.4         9.4

8.2          5781       1.5           5.0          7030       1.4       10.2      7124       1.4         9.4

2Q           6626       7.0           5.0          7064       6.7           5.0   6153       7.5         5.0

8Q           5781       1.5           5.0          7030       1.4           5.0   7124       1.4         5.0

4Q           7160       2.7           5.0          9765       1.8           5.0   10724      1.5         5.0

5Q           6107       1.5           5.0          6028       1.7           5.0   7779       1.4         5.0

March 2020
Doc Ref. 40828-WOOD-XX-XX-RP-OA-0010_A_C01.2
B3 © Wood Environment & Infrastructure Solutions UK Limited Table B2 Roads parameters ADMS Source ID Road name Link Index 1.1 A273 Brighton Road (southbound) 21102_12814 1.2 A273 Brighton Road (southbound) 21102_12814 2.1 A273 Brighton Road junction approach (northbound) 12814_21102 2.2 A273 Brighton Road junction approach (northbound) 12814_21102 3.1 A273 London Road (northbound) 21102_21117 3.2 A273 London Road (northbound) 21102_21117 4.1 A273 London Road junction approach (southbound) 21117_21102 4.2 A273 London Road junction approach (southbound) 21117_21102 5.1 Hurst Road junction approach (eastbound) 21224_21102 5.2 Hurst Road junction approach (eastbound) 21224_21102 6.1 Hurst Road (westbound) 21102_21224 6.2 Hurst Road (westbound) 21102_21224 7.1 Keymer Road (eastbound) 21102_21230 7.2 Keymer Road (eastbound) 21102_21230 8.1 Keymer Road junction approach (westbound) 21230_21102 8.2 Keymer Road junction approach (westbound) 21230_21102 2Q A273 Brighton Road junction approach (northbound) 12814_21102 8Q Keymer Road junction approach (westbound) 21230_21102 4Q A273 London Road junction approach (southbound) 21117_21102 5Q Hurst Road junction approach (eastbound) 21224_21102 March 2020 Doc Ref. 40828-WOOD-XX-XX-RP-OA-0010_A_C01.2
B4     © Wood Environment & Infrastructure Solutions UK Limited

Figure B1      ADMS-Roads input data

March 2020
Doc Ref. 40828-WOOD-XX-XX-RP-OA-0010_A_C01.2
B5     © Wood Environment & Infrastructure Solutions UK Limited

Figure B2      Road links modelled to account for queuing in 2017 (top) and 2031 (bottom).

March 2020
Doc Ref. 40828-WOOD-XX-XX-RP-OA-0010_A_C01.2
C1     © Wood Environment & Infrastructure Solutions UK Limited

Appendix C
ADMS-Roads Model Verification

March 2020
Doc Ref. 40828-WOOD-XX-XX-RP-OA-0010_A_C01.2
C2     © Wood Environment & Infrastructure Solutions UK Limited

The ADMS-Roads dispersion model has been widely validated for this type of assessment and is specifically
listed in Defra’s LAQM.TG(16)15 guidance as an accepted dispersion model.

It is necessary to perform a comparison of modelled results with local monitoring data at relevant locations.
This process of verification attempts to minimise modelling uncertainty and systematic error by correcting
modelled results by an adjustment factor to gain greater confidence in the final results.

The predicted results from a dispersion model may differ from measured concentrations for a large number
of reasons, including uncertainties associated with:

                  ⚫    Background concentration estimates;

                  ⚫    Meteorological data;

                  ⚫    Source activity data such as traffic flows and emissions factors;

                  ⚫    Model input parameters such as surface roughness length, minimum Monin-Obukhov
                       length;

                  ⚫    Monitoring data, including locations; and

                  ⚫    Overall model limitations.

Model verification is the process by which these and other uncertainties are investigated and where possible
minimised. In reality, the differences between modelled and monitored results are likely to be a combination
of all of these aspects.

Model setup parameters and input data were checked prior to running the models in order to reduce these
uncertainties. The following were checked to the extent possible to ensure accuracy:

                  ⚫    Traffic data;

                  ⚫    Road widths;

                  ⚫    Distance between sources and monitoring as represented in the model;

                  ⚫    Speed estimates on roads;

                  ⚫    Source types, such as elevated roads and street canyons;

                  ⚫    Selection of representative meteorological data;

                  ⚫    Background monitoring and background estimates; and

                  ⚫    Monitoring data.

Suitable local monitoring data for the purpose of verification is available for annual mean NOX/NO2
concentrations as shown in Table C1 below. Monitoring sites MSAQ10, MSAQ11, MSAQ16, MSAQ18 and
MSAQ23 were used for verification purposes as they are located on modelled roads for this assessment.
Diffusion tube MSAQ24 was not used in the verification. The tube is located behind a hedge, which is likely to
affect dispersion in a way that cannot be replicated by the model.

March 2020
Doc Ref. 40828-WOOD-XX-XX-RP-OA-0010_A_C01.2
C3 © Wood Environment & Infrastructure Solutions UK Limited
Table C1 Local monitoring data suitable for ADMS-Roads model verification
Location 2017 Annual Mean NO2 X (m) Y (m)
(µgm-3)
MSAQ10 38.8 529917* 115489*
MSAQ11 38.5 529930 115481
MSAQ16 19.8 529918 115441
MSAQ18 29.5 529907 115428
MSAQ23 33.9 529935 115478
*Coordinates for MSAQ10 cited in MSDC 2019 ASR were “529911, 115489”. They were adjusted to “529917, 115489” after verification of
the exact location using Google Street View 30.
Verification Calculations
The verification of the modelling output was performed in accordance with the methodology provided in Box
7.16 of LAQM.TG(16)15. Table C2 shows that the model was under-predicting NO2 annual concentrations at
the monitoring sites.
Table C2 Verification, modelled versus monitored
Site 2017 Unadjusted Modelled 2017 Monitored Annual % (Modelled-
Annual Mean NO2 (µgm-3) Mean NO2 (µgm-3) Monitored)/ Monitored
MSAQ10 35.6 38.8 -8%
MSAQ11 22.8 38.5 -41%
MSAQ16 19.0 19.8 -4%
MSAQ18 21.4 29.5 -28%
MSAQ23 22.3 33.9 -34%
Table C3 shows the comparison of modelled road-NOX, a direct output from the ADMS-Roads modelling,
with the monitored road-NOX, determined from the LAQM NOX to NO2 conversion tool (Diffusion Tube
calculator tab).
30
https://www.google.co.uk/maps
March 2020
Doc Ref. 40828-WOOD-XX-XX-RP-OA-0010_A_C01.2C4 © Wood Environment & Infrastructure Solutions UK Limited
Table C3 Comparison of modelled and monitored road NOX to determine verification factor
Site 2017 Unadjusted Modelled
2017 Monitored Annual
Annual Mean Road NOX Ratio
Mean Road NOX (µgm-3)
(µgm-3)
MSAQ10 51.9 60.0 1.2
MSAQ11 24.2 59.2 2.4
MSAQ16 16.7 18.3 1.1
MSAQ18 21.3 38.6 1.8
MSAQ23 23.0 48.4 2.1
Table C4 shows the comparison of the modelled NO 2 concentration calculated by multiplying the modelled
road NOX by the average adjustment factor of 1.495 and using the LAQM’s NOX to NO2 conversion tool to
calculate the total adjusted modelled NO 2.
Table C4 Comparison of adjusted modelled NO2 and modelled NO2
Site 2017 Background NO2 2017 Adjusted Modelled 2017 Monitored Annual % (Modelled-
Concentration Annual Mean NO2 (µgm-3) Mean NO2 (µgm-3) Monitored)/ Monitored
MSAQ10 10.2 43.4 38.8 12%
MSAQ11 10.3 27.0 38.5 -30%
MSAQ16 10.2 22.1 19.8 11%
MSAQ18 10.2 25.1 29.5 -15%
MSAQ23 10.3 26.3 33.9 -23%
The majority of modelled NO2 concentrations are within 25% of monitored concentrations as specified by
LAQM.TG(16), which is considered acceptable given the high number of monitoring sites used in verification
and broad area covered, therefore NO2 concentrations have been amended using this adjustment factor of
1.495.
Model uncertainty
In line with LAQM.TG(16) , statistical procedures have been carried out to assess the uncertainties within the
model as shown in Table C5.
March 2020
Doc Ref. 40828-WOOD-XX-XX-RP-OA-0010_A_C01.2C5 © Wood Environment & Infrastructure Solutions UK Limited
Table C5 Assessment of model uncertainty
Statistical parameter Ideal value Calculated value Comment
Correlation coefficient 1 0.7 Model shows a relationship between monitored and
modelled concentrations.
Root mean square error 0 6.9 Within the 10 µgm-3 value indicated by LAQM.TG(16) to
(RMSE) revisit model inputs and verification, so no further action
taken.
Fractional bias 0 0.1 Model shows no overall tendency to over or under
predict after adjustment
March 2020
Doc Ref. 40828-WOOD-XX-XX-RP-OA-0010_A_C01.2You can also read


