ANSYS FLUENT USAGE IN PRODUCT DEVELOPMENT - DIVA PORTAL
←
→
Page content transcription
If your browser does not render page correctly, please read the page content below
EXAMENSARBETE INOM MASKINTEKNIK,
 Innovation och Design , högskoleingenjör 15 hp
 SÖDERTÄLJE, SVERIGE 2021

ANSYS Fluent usage in product
development
A qualitative analysis of Volume of Fluid
simulations in the internal design of a dry toilet

   Daniele Origuella

 SKOLAN FÖR INDUSTRIELL TEKNIK OCH MANAGEMENT
 INSTITUTIONEN FÖR HÅLLBAR PRODUKTIONSUTVECKLING
2
ANSYS Fluent usage in product development
 A qualitative analysis of Volume of Fluid simulations in the internal
                         design of a dry toilet

                                 by

                     Daniele Origuella

                 Examensarbete TRITA-ITM-EX 2021:431
                  KTH Industriell teknik och management
                      Hållbar produktionsutveckling
                  Kvarnbergagatan 12, 151 81 Södertälje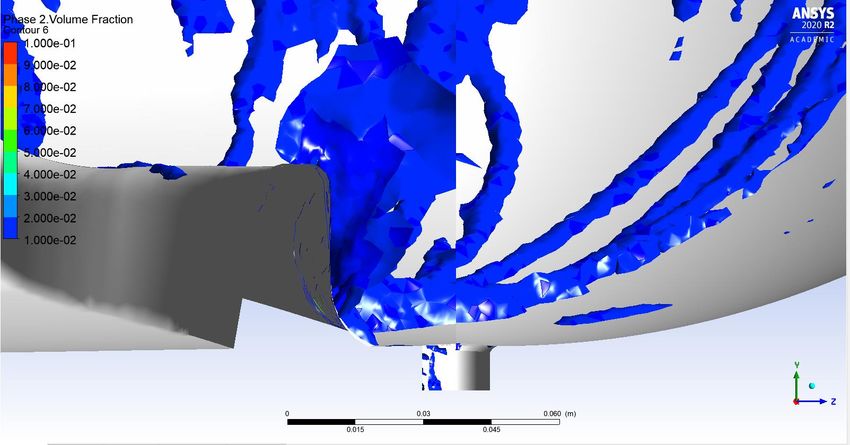
12
Examensarbete TRITA-ITM-EX 2021:431

                                          ANSYS Fluent usage in product development- A
                                              qualitative analysis of Volume of Fluid
                                          simulations in the internal design of a dry toilet

                                                               Daniele Origuella

Godkänt                        Examinator KTH                          Handledare KTH
2021-06-19                     Mark W Lange                            Mark W Lange
                               Uppdragsgivare                          Företagskontakt/handledare
                               Pierre Friberg                          Pierre Friberg

Sammanfattning
Världshälsoorganisationen, WHO, beräknar att mer än två miljarder människor inte hade tillgång till
toaletter 2017. Avföringen från dessa människor hamnade ofta i sjöar och floder och det vattnet
användes sedan i sin tur för bevattning av grödor. Detta beräknas vara orsaken till en halv miljard
dödsfall per år. Det finns för tillfället många initiativ att uppnå det globala målet för rent vatten och
sanitet för alla, däribland arbetar Bill Gates och projekt så som “Solar Project”. “Solar Project” har sin
bas i Sydafrika och är ett samarbete mellan flera företag som tillhandahåller olika komponenter som
krävs för att skapa resurscenter, som kan användas för att producera gödsel av mänsklig avföring.
En av komponenterna för dessa resurscenter är torrtoaletter som är försedda av
SUPERFUNKYFUTURE.

Denna tes handlar om att analysera en toalettmodell, bygga ett funktionsträd, utföra en 2D “Volume
of Fluid”-simulering för att upptäcka kritiska geometrier. Varje sådan geometri fick en ändring
designad. Dessa förändringar kombinerades till olika modeller som sedan blev testade med både
2D- och 3D-simuleringar.

Resultaten från simuleringarna blev sedan bearbetade i CFD-Post och blev animerade, detta för att
möjliggöra en kvalitativ analys genom en konceptviktningsmatris. Från Konceptviktningsmatrisen
kunde man välja mellan designerna och rekommendera en förbättrad intern geometri till
SUPERFUNKYFUTURE.

Nyckelord
ANSYS Fluent; Produktframtagning; VOF

13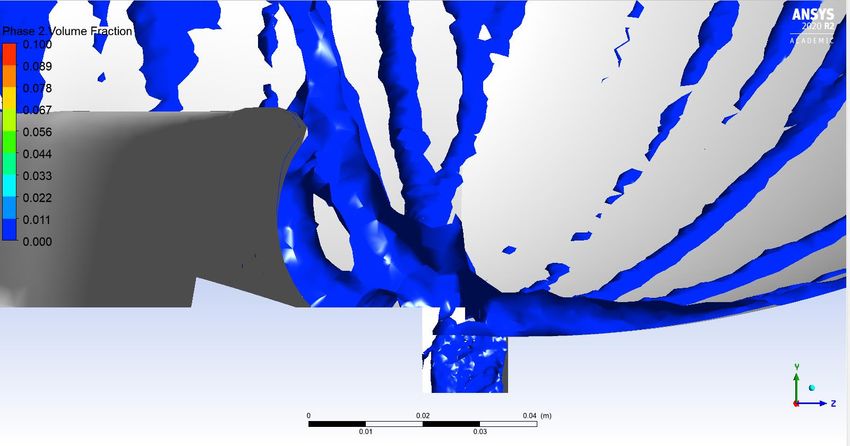
14
Bachelor of Science Thesis
                                                TRITA-ITM-EX 2021:431

                                    ANSYS Fluent usage in product development- A
                                        qualitative analysis of Volume of Fluid
                                    simulations in the internal design of a dry toilet

                                                     Daniele Origuella

Approved                  Examiner KTH                       Supervisor KTH
2021-06-19                Mark W Lange                       Mark W Lange
                          Commissioner                       Contact person at company
                          Pierre Friberg                     Pierre Friberg

Abstract
The World Health Organization estimates that over two billion people did not have
access to a toilet in 2017. The dejects produced often end up in bodies of water and, as
one in every ten crops is watered with wastewater, this is estimated to cause half a
billion deaths per year. There are currently many initiatives to reach this sanitation
Global Goal, including those from people such as Bill Gates and projects such as The
Solar Project. The Solar Project is based in South Africa and is based on cooperation
between various companies which provides them with the different components for the
installation of Resource Centers, that produce fertilizers of human waste. One of the
components of these Resource centers are dry-toilets, which are provided by
SUPERFUNKYFUTURE.

This thesis is about an analysis of a toilet model and building a function tree, performing
a 2D Volume of Fluid simulation on it to see even more critical geometries. Each one of
those geometries had one alteration designed. These alterations were also combined
into different models and they were all tested in both 2D and 3D simulations.

The results from the simulations were then post-processed in CFD-Post and animated,
to allow the qualitative analysis to be performed through a Pugh Matrix and decide
between designs to recommend an improved internal geometry to
SUPERFUNKYFUTURE.

Key-words
ANSYS Fluent; product development; VOF

15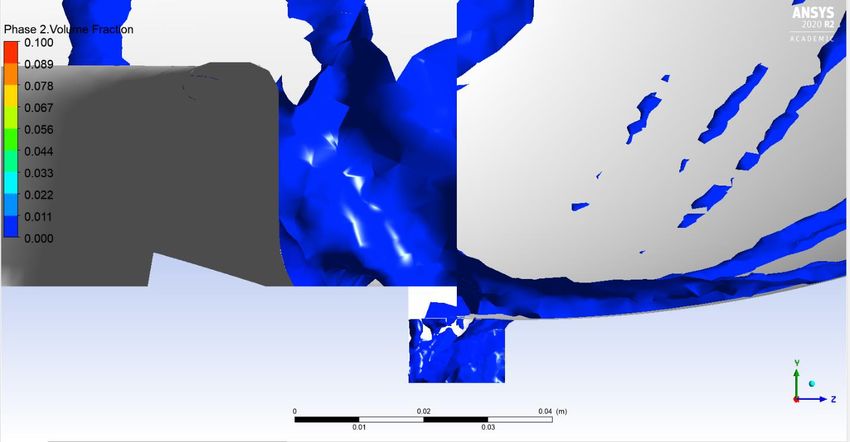
16
Abstract
The World Health Organization estimates that over two billion people did not have access
to a toilet in 2017. The dejects produced often end up in bodies of water and, as one in
every ten crops is watered with wastewater, this is estimated to cause half a billion deaths
per year. There are currently many initiatives to reach this sanitation Global Goal, including
those from people such as Bill Gates and projects such as The Solar Project. The Solar
Project is based in South Africa and is based on cooperation between various companies
which provides them with the different components for the installation of Resource
Centers, that produce fertilizers of human waste. One of the components of these Resource
centers are dry-toilets, which are provided by SUPERFUNKYFUTURE.

This thesis is about an analysis of a toilet model and building a function tree, performing a
2D Volume of Fluid simulation on it to see even more critical geometries. Each one of those
geometries had one alteration designed. These alterations were also combined into
different models and they were all tested in both 2D and 3D simulations.

The results from the simulations were then post-processed in CFD-Post and animated, to
allow the qualitative analysis to be performed through a Pugh Matrix and decide between
designs to recommend an improved internal geometry to SUPERFUNKYFUTURE.
Contents
1.        Introduction ...................................................................................................... 1
1.1.      Background ............................................................................................ 1
1.2.      Purpose .................................................................................................. 2
1.3.      Objective ................................................................................................ 2
1.4.      Limitations ........................................................................................... 2
1.5.      Solution Method................................................................................... 3
2.        Current state ........................................................................................ 3
3.        Theoretical Background ..................................................................... 4
3.1       Function tree ..................................................................................................... 4
3.2       Tests ..................................................................................................................... 4
3.2.1 Volume of Fluid Simulations on ANSYS® Fluent® ............................... 4
4.        Implementation ............................................................................................... 6
4.1       Gathering of information .............................................................................. 6
4.2       Requirement analysis .................................................................................... 6
4.3       Brainstorming .................................................................................................. 6
4.4       Modelling............................................................................................................ 6
4.4.1 Toilet Modelling ............................................................................................... 7
4.4.2 Modelling for Simulating .............................................................................. 7
4.5       Simulation .......................................................................................................... 7
4.5.1 Volume of Fluid Simulation and Post processing ................................. 7
4.5.2 Prototype simulation ..................................................................................... 7
5.        Discussion .......................................................................................................... 8
6.        Results ................................................................................................................. 9
6.1       Gathering of Data ............................................................................................. 9
6.2       Requirement analysis ..................................................................................11
6.3       Brainstorming ................................................................................................12
6.4       Models ...............................................................................................................13
6.4.1 Toilet Modeling ..............................................................................................13
6.4.2 Modeling for Simulation..............................................................................13
6.5       Simulation and Post Processing ...............................................................14
6.5.1 Volume of Fluid Simulation........................................................................14
6.5.2 Prototype Simulation ...................................................................................15
7.        Conclusion........................................................................................................16
8.    Further studies ...............................................................................................16
References
Appendix A – Function Tree
Appendix B – Brainstorming
Appendix C – 2D Solutions
Appendix D – 3D Results
Appendix E – Pugh Matrix
1. Introduction

   This report is about the usage of Volume of Fluid Simulation from ANSYS® Fluent® to
simulate the water flow inside a modified toilet geometry to improve the water flow inside
a dry toilet.

   1.1.         Background

   In 2017, two billion people did not have access to any kind of toilet or latrine (WHO,
2017). The absence of a toilet does not infer in the absence of urine or fecal matter, which
in this case means that millions of people are forced to evacuate in the open and those
excrements often end up in bodies of water. The presence of human waste in the water
turns it into breeding ground for diseases such as cholera, diarrhea, dysentery, hepatitis A,
typhoid and polio cholera. The cycle continues as about ten percent of the world population
is believed to consume food irrigated by wastewater and it is estimated that inadequate
sanitation leads to the death of almost half a million people per year (WHO, 2017). This
situation is even referred to as a sub goal in the Global Goals (UN, 2015).
   This problem caught the interest of people such as Bill Gates, who, in 2012, hosted a
two-day Reinvent the Toilet Fair in Washington (Gates Foundation, 2021) and has ever
since sponsored many different approaches to solve the sanitation problem.
   Two years ago, inspired by both the initiative and the sanitation problem, The
Scandinavian Water Company started a project driven by private initiative, The Solar Toilet
(Lundgren, 2019). This project installs dry toilets in schools and, from the collected matter,
produces fertilizers to start a circular economy in South Africa.
   A dry toilet, as pictured below, is a toilet which separates urine from fecal matter and
does not require water to function. The toilets used by this project are hybrid and have a
flushing system that uses only a fraction of the usual amount of water per flush although it
can be used without any water. In South Africa, the material is then collected and processed
into fertilizers to promote a circular economy and economic growth in the regions it is
installed in (Lundgren, 2019).

                                                                                                1
Figure 1 : top(left) and side view(right) of a dry toilet. The toilet bowl is then divided into
two sections by a barrier and has two different pipes, one for urine and the other for fecal
matter, which is illustrated by the side view.
The Swedish company SUPERFUNKYFUTURE ™(SFF) is one of the companies involved
in the Solar Project, providing them with dry toilets made of porcelain.
1.2. Purpose
This project had the purpose of developing an internal toilet geometry through
applying and deepening previously learned methods, as well as acquiring new ones and
techniques from further research in the subject.
1.3. Objective
This project had as an objective simulating in 2D and 3D the water flow inside a toilet
bowl to determine critical points in the geometry, alternative designs were then be
proposed and simulated so they could then be compared. The simulations were performed
with ANSYS® Fluent® software.
1.4. Limitations
There are many limiting aspects which include technique, from manufacturing to
simulation, as well as constraints from the education. Time wise, this project should not
exceed the ten weeks limit with all the required time for writing this final report.
2Software wise this project used the Fluent® software from ANSYS® Student 2020 R2,
which allows only 512 thousand nodes per simulation. This might be an issue for the
meshing in the 3D simulations.
Design wise, the alterations must not alter the exterior in any way, maintaining the
minimum thickness of 8 mm of the walls. The only area to be altered is the frontal internal
area of the bowl, which is the urine side of the toilet.
The draining hole’s oval shape and size must remain unaltered, however its rim may be
chamfered or filleted as deemed fit.
The barrier between the front and back areas may be altered as deemed fit.
Due to differences in ceramic materials and even glazing methods, which leads to
unevenness, this project will not simulate the friction between water and the bowl, and
will, instead, focus only on the geometry.
1.5. Solution Method
This project analyzed the functions of the different components of the toilet’s urine
bowl to conceive critical points in the 2D geometry, which was then simulated in ANSYS®
Fluent® and the two results were then compared.
3D prototypes of the original models were printed to compare the flow with the
simulations.
From that analysis, a brainstorming session took place to shape new models, which
were then simulated in both 2D and 3D on the same software.
A final analysis of all the models was then performed and a conclusion drawn.
2. Current state
SUPERFUNKYFUTURE ™ is a Swedish consulting company started by Pierre Friberg five
years ago.
It is a small company without their own factory, opting for producing their products
abroad in porcelain factories that use traditional methods. While the modern methods are
more dependent on the 3D model, the traditional factories produce the toilets by hand and
things may be adjusted on site.
3Not owning a factory also makes it easier to relocate the production to the different
countries they sell to. However, this also implies complying with the minimum quantity of
each factory and storing the unsold goods.
SFF currently does not have dry toilets in stock, which also makes it a good timing for
designing a new toilet.
3. Theoretical Background
This section details the methods used on this project.
3.1 Function tree
This is a method to give background and even ground to a project. It is built as a tree for
visual analysis of the main objective with the project, without the need to provide a clear
solution.
The main branch is then parted in smaller branches representing the partial functions
in the project all the way to possible solutions (Wikberg Nilsson et al., 2015, 70).
3.2 Tests
The testing in this project was performed with both prototypes and simulations to
adapt the boundary conditions in the simulations so the end results were compatible with
those observed in the prototypes.
3.2.1 Volume of Fluid Simulations on ANSYS® Fluent®
A Volume of Fluid model simulates two or more immiscible fluids through solving
momentum equations. It then tracks the volume fraction from each phase through the
domain.
This model is applicable in various settings, from predicting jet breakup, the liquid
motion after a breakage in a dam and even the movements of a large oil bubble in water
(ANSYS® FLUENT® 12.0 Theory Guide, 2020).
43.2.2 3D Printed scaled prototype
A 3D scaled prototype was printed from the original model to compare and adjust the
flow in the simulation. This was performed to ensure there was no large discrepancy in
between the simulation and a prototype.
The prototypes were modelled so the water canal would more easily be filled in with
water, which in the 2D prototype comes as a small hole on the top of the water canal and on
the 3D prototype means the removal of the seat area as seen on the pictures.
By using the same boundary conditions as well as the same equations to simulate flow,
the different iterations could then be tested without the need to print out new models.
The 3D prints would then be assembled with transparent acrylic so the tests could be
conducted by filling the water canal with colored water and watching the liquid run down
the walls of the bowl.
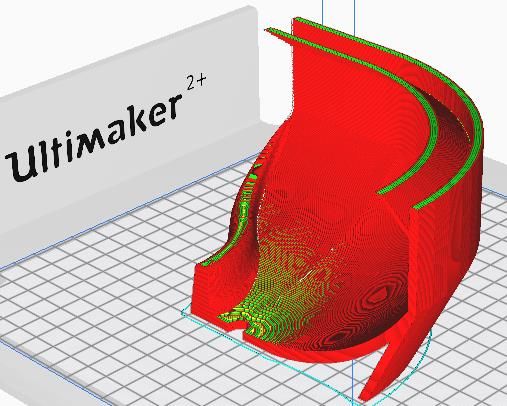
Figure 2 shows the 3D printer plate of the 2D prototype printing preview on it(left) and the 3D
printer plate with the frontal-left quarter section of the toilet as a 3D prototype printing
preview on the printing plate (right).
3.2.3 Pugh Matrix
In the concept development phase it is important to create several solution models that
attempt to solve the problem through different ways. However, it can be complicated to
choose in between many creative and good solution models. It was then proposed the Pugh
Concept Selection by Stuart Pugh in 1990.
The proposed method is a matrix with the qualities wished in the product in one of the
axis and the other has listed the different models. Each model is then attributed symbols in
each criteria depending if it is superior (+), inferior (-) or if there are no changes (S) when
compared to the original idea. (Bergman and Klefsjö, 2019)
54. Implementation
This section details the implementation on the project in all the steps necessary for the
execution of this project.
4.1 Gathering of information
During the two years that The Solar Project was implemented, there was constant
feedback from the on-site testing. A market research was also conducted by SFF on the
recent trends in the industry to update the design to that which is currently considered in
style. From the gathered feedback from both users and technicians involved in installing
the toilets, SFF condensed the information into a prototype made of polystyrene.
The information required for the simulation was obtained from other sources, varying
from books such as “An Introduction to ANSYS® Fluent® 2020” by John E. Matsson, to the
ANSYS® Fluent® User Guide.
4.2 Requirement analysis
The main functions for the project were stablished from the limitations of this project
and the company’s needs. The product characteristics which influence the water flow in the
project were then identified during this phase.
A function tree was made of the most important requirements and product
characteristics.
4.3 Brainstorming
An analysis was performed after the VOF simulation of the 2D geometry to determine
the critical points in the geometry that have influence over the water flow. These critical
points were listed and to each one of them a solution was proposed, those solutions were
then combined and mixed in between themselves to broaden the possibilities and generate
more data to compare.
4.4 Modelling
This project was built through many iterations of both models for prototyping and
manufacturing of a dry toilet as well as the models used for the volume of fluid simulation.
64.4.1 Toilet Modelling
A model was designed by following the guidelines from the company, based on both on
the feedback from users and on their previous model. It then went many iterations until it
filled all the company needs.
4.4.2 Modelling for Simulating
A Volume of Fluid simulation requires a different model than the one for the toilet. It is
comparable to a photo and its negative, where the model used for a simulation is made of
the internal area of the toilet bowl.
4.5 Simulation
This section discusses the simulations performed both with prototypes as the ones
performed on the simulation software.
4.5.1 Volume of Fluid Simulation and Post processing
The Volume of Fluid simulation required a lot of care for things such as the mesh
quality and care for the boundary conditions (identifying inlets and outlets). The Mesh
conditions were obtained through meshing the critical parts in a tighter mesh, as well as
altering some critical parts that did not have a meaning in the simulation, such as small
corners.
4.5.2 Prototype simulation
The prototypes were printed in a 1:2 scale in plastic, being the 2D model 5mm thick to
enable a better view of the flow. A small hole was added to the top of the water canal so the
tests were conducted more easily.
As for the 3D prototype, it was expected to take over eight hours of printing during the
slicing in Ultimaker Cura 4.9.0 so it was then opted to section the prototype in three pieces.
During the printing there were many times when the piece was dragged by the printing
head, which continued printing and by doing so there was the need to reprint a few times,
and what should take only five hours to print took instead eight hours to print.
The prototypes were then cased with acrylic plaques with a glue gun to allow a better
view of the water flow in the prototypes as shown in Figure 3.
7Figure 3: the printed 2D prototype encased in acrylic plaques (left) and the 3D prototype
encased in acrylic plates (right).
5. Discussion
The different viscous models in Fluent
The model that was analyzed in this project had no changes in pressure or temperature,
being therefore a simple model to be analyzed. Fluent has several viscous models to even
these kinds of flow, however, when comparing the two equation models the k-ε and k-ω
models, it was then decided to use k-ω SST (refer to section 6.1), as it is an improved
version of the two previously named methods and it is the most stable with 2D and 3D
simulations (Acharya, 2016.).
Mesh
The ANSYS® Fluent® Student 2020 R2 allows only 512 thousand elements to be
simulated. This demanded creativity in the 3D simulations, whereas it was easily
obtainable in 2D simulations. In practical terms, this meant doing a rougher mesh in the
interior of the solids and a finer mesh where the water would run down.
This compromise worked simulation wise, however it brought uncertainty to the volumes
of fluid that became airborne.
Processing time Explicit and Implicit formulation
By opting for an Implicit formulation in the Volume fraction parameter, this project
could be performed in only two weeks longer than the planned time. This made what
would be a weeklong test in the Explicit Formulation into a 5 hour long Implicit
formulation.
8This time saving approach might have decreased accuracy in the model, and it was not
feasible to compare with an Explicit formulation test, even partially, to attain
confirmation.
Testing of the prototypes
The 2D tests with the colored water were not as easy to refill as the ones in the 3D
prototype and as they were scaled down to fit the printer, it also became hard to see if the
water was going down through all the tubes or if there were printing errors that sealed
those shut.
6. Results
This section shows the results from the phases described during the implementation phase.
6.1 Gathering of Data
The gathering of data brought in knowledge of the crucial areas for a Volume of Fluid
simulation, such as:
- Volume of Fluid restrictions demand that there cannot be a void region in the
simulation, which means that all areas must be filled with one of the phases or a
mixture of them.
There can only be one phase composed of a compressible ideal gas, whereas there is
no limitation on using compressible liquids.
The model is also not compatible with combustion models.
Specified mass flow rate or specified pressure drop cannot be modeled when the
VOF model is used.
Only pressure-based solver can be used for this model.
- Two-equation models are the most widely used models in ANSYS® Fluent® as it
provides a balance between accuracy and numerical effort.
• Standard k-ε model is a common and widely used two-equation model. The two
transport variables solved for in this model are the turbulent kinetic energy, k,
and the turbulent dissipation, ε. The model was implemented to improve the
mixing-length model and proposing turbulent length scales in moderate to
complex flows. This model has proven useful for free-shear layer flow when the
pressure gradient is small. (Bardina et al., 1997)
9• Standard k-ω model solves for the variables: turbulence kinetic energy, k, and
turbulence dissipation rate, ω. It is a more accurate version of the standard k-ε
model which provides near-wall treatment for low-Reynolds number without
involving complex nonlinear damping functions (Acharya, 2016.).
• k-ω Shear Stress Transport (SST) model is a blend of the previous models and as
a result is better at predicting the onset and flow separation under adverse
pressure gradients (Acharya, 2016.).
- Mesh is meaningful in the accuracy and stability of the numerical computation.
Early simulation attempts showed the need for a higher Mesh quality, which is
measured through criteria such as Skewness, Aspect ratio and Orthogonal quality.
• Skewness is calculated as the difference between the shape of a cell and the
shape of an equilateral cell of equivalent volume. This directly affects the
calculations and can lead to destabilization of the solution if the cell is highly
skewed. The recommended value for this feature is to keep it below 0.95, with
an average value that is significantly lower (ANSYS® Fluent® User Guide, 2020).
• Aspect ratio is a measure of the stretching of the cell, it is recommended to avoid
sudden or large increments in cell aspect ratios in areas where the flow field
exhibits large changes or strong gradients (ANSYS® Fluent® User Guide, 2020).
• Orthogonal quality varies depending on the cell type:
o for hexahedral and polyhedral cells, it is the same as orthogonality.
o for tetrahedral, prism and pyramid cells, it is the minimum of the
orthogonality and (1-cell skewness).
The User Guide recommends the minimum orthogonal quality for all types of
cells to be above 0.01, with an average value that is significantly higher (ANSYS®
Fluent® User Guide, 2020).
- Volume Fraction Parameters in the Volume of Fluid simulation: Explicit and Implicit
Formulations:
• The Implicit scheme is used for time discretization of the finite-difference
interpolation schemes to obtain the face fluxes for all cells, specially those near
10the surface. As it requires an iterative solution of the transport equation during
each time step, this formulation is most applicable when the intermediate
transient flow behavior is not to be analyzed. Therefore, this formulation is best
used for simulations such as determining the shape of the liquid interface in a
centrifuge (ANSYS® Fluent® User Guide, 2020).
• The Explicit scheme uses the standard finite-difference interpolation schemes
from ANSYS® Fluent® to the volume fraction values computed in the previous
time step (ANSYS® Fluent® User Guide, 2020).
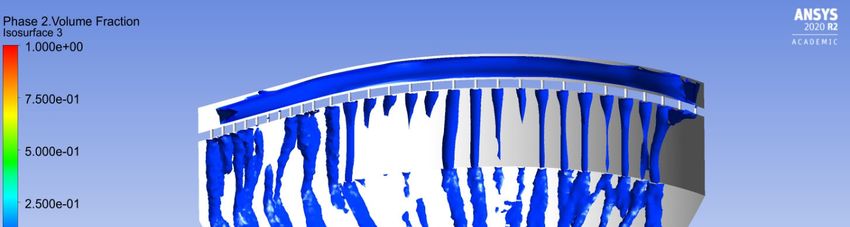
- CFD-post: different techniques for post processing of the simulations for 2D and 3D
simulations. The 2D simulations were animated into volume of phase contours
showing both fluids, whereas the 3D tests had isosurfaces that show the water
surface.
• A Contour plot is based on many points of one and the same value that are then
connected in between themselves to form shapes with gradients. It is
comparable to height contours on geographic maps (ANSYS® CFD-Post® User’s
Guide, 2020).
• An Isosurface is a surface placed upon a variable of constant value, called a level.
When used on volume fraction it is comparable to a membrane, showing the
fluid’s movement without showing the interior (ANSYS® CFD-Post® User’s
Guide, 2020).
6.2 Requirement analysis
The functions observed during the requirement analysis were used to build a function
tree (refer to Appendix A). As different parts of the toilet were named, there were also
ideas to how those could influence the water flow in the bowl.
The critical geometric parts identified are marked in the figure below where:
11Figure 4: side view of the quarter section of the 3D model. There are three areas marked on
the image where (1) represents the barrier, (2) the urine drain and (3) the drop height.
6.3 Brainstorming
The idea generating produced one alternative to each critical function observed in the
Requirement Analysis, as observed on Figure 5.
Figure 5: side view of the quarter section of the toilet’s quarter section where four ideas are
proposed for the critical geometries, those are named from A to D.
12The ideas A to C listed above were then combined into different models that were also
simulated to broaden the possibilities with this project. This generated seven different
scenarios to be simulated, refer to Appendix B for the details of each model.
The ideas listed in D were discarded due to manufacturing and design needs as the
vertical wall is a single porcelain layer.
6.4 Models
The models went through many iterations to fill up the simulation criteria, both the 2D
and 3D models were made with AutoDesk Inventor Professional 2021. In this section the
models of the toilet as well as the ones for the simulation are presented.
6.4.1 Toilet Modeling
After several iterations, the toilet design was approved and it was then sectioned in
ways deemed necessary for the simulation as showed below.
Figure 6: the frontal-left quarter section of the toilet model(left) and the cross section of the
toilet model (right).
6.4.2 Modeling for Simulation
The models were obtained with AutoDesk Inventor by using different techniques while
sectioning the geometry in smaller parts to improve mesh quality. The drain geometry was
modelled as straight instead of curved as in the original model to simplify the simulation by
making the toilet geometry symmetric.
13Figure 7: the 3D model used for VOF simulation (left) and the 2D model used for VOF
simulation (right).
6.5 Simulation and Post Processing
In this part the results of the simulation in both the prototype and the VOF simulation
are described.
6.5.1 Volume of Fluid Simulation
The gathered information was sufficient to perform a simulation of the water canal
completely full as to observe how the water interacted with the other system elements at
its highest pressure.
After the simulation was performed, the data was exported to CFD-Post software. The
scale of the Volume of Phase was then adjusted to show higher contrast in the water in the
bowl, which ranged from 0 to 0.1 in volume fraction. This is shown in the images through
adding an Isosurface to the water surface and then adding Contour to the Isosurface to
show the layers with a higher volume of fluid rate.
The results from the 2D simulation (refer to Appendix C) showed that:
• The combinations involving the A model had the same water behavior as in the A
model, where the water followed closely the geometry and ran down the drain.
• Model B showed the fluid meeting the geometry at high speed, consequently
splitting the droplets, which went into the drain as up in the air in the opposite
direction.
• Model C showed similar water behavior as the original geometry, changing only the
angle in which the droplets leave the barrier geometry.
14In the 3D simulation (refer to Appendix D), the results were broader and not as
depending on a specific geometry:
• Model A: the curved barrier gathered the fluid with highest efficiency, sinking the
height of the wave that goes over the barrier.
• Model B and C: the geometries on the drain pipe were effective in draining the flow
in the z direction, and the perpendicular flow then goes over the barrier, it is
noticeable that on Model C more fluid goes over the barrier.
• Model A+B: produced the smallest airborne mass when compared to models A+C
and B+C. The fluid goes over the barrier as much as it did in the 2D analysis.
• Model A+C: produced the highest wave in between all the analyzed models and even
an airborne mass that reached the higher boundary.
• Model B+C: the fluid that came from the left-perpendicular to the YZ plane area was
faster than the other models and did not go down the drain, an airborne mass hit the
superior wall (smaller than the one produced by model A+C).
• Model ABC: showed the most controlled flow between the alternatives, as in the
analyzed time it did not have any airborne mass or tall wave over the geometry.
The results were then compared through a Pugh Matrix (Appendix E).
6.5.2 Prototype Simulation
The tests were performed with colored water for higher contrast with the white 3D
printed prototypes. The information gathered from the flow was used to compare with the
simulation and later used to establish the pressure outlets in the simulation as shown in
the picture below.
Figure 8: the pressure inlet(blue) and the outlets(red) in a pressure based VOF simulation
used for both 2D and 3D simulations.
157. Conclusion
The node limitation from the software limited how well the volume fraction was
tracked from the walls into the solid. This raises the uncertainty of the results.
However, as all the models went through the same meshing process and simulation, it is
possible to draw a conclusion by using a Pugh Matrix (refer to Appendix E).
Without considering the cleaning aspect, it is possible to affirm that between all the
models, model A shows itself as the one that improves the most the original product.
The second bests were models C and ABC.
Model C was very promising during the 2D tests, but in the 3D simulation did not show
as smooth of a flow and even generated a larger wave over the barrier than the one from
the original model.
Model ABC showed the most positive water behavior as it did not show an airborne
mass as the other models. However, since it contained the B geometry, the ABC model was
then considered more difficult to clean when compared to the original.
For the reasons mentioned before was model A decided as the best in between the
simulated models and recommended to the company as a geometric improvement.
8. Further studies
In further studies it is recommended to add complexity to the model. This can be in the
form of Idea generating more geometries for the testing or even by testing small variations
of the ones simulated in this report.
Another way of adding complexity to the model would be through adding friction
between the fluid and the walls, as to simulate the interaction of the water with the
porcelain of the toilet.
ANSYS® Fluent® offers many viscous models that can be tested and compared while
also further studying the differences between them.
With a longer timeframe, or usage of a cluster for the simulations, Explicit formulation
could be used to compare the results with the Implicit formulation used in this report.
The prototypes used for comparison can also be printed on a larger scale if sectioned in
more parts or by having access to a larger 3D printer.
16References -WHO (2017). Sanitation [Online]. Available at: www.who.int/news-room/fact- sheets/detail/sanitation (Accessed: 17 May 2021). -UN(2015). Goal 6: Clean Water and Sanitation [Online]. The Global Goals. Available at: www.globalgoals.org/6-clean-water-and-sanitation (Accessed: 17 May 2021). -Gates Foundation, 2021. Reinvent the Toilet Challenge & Expo | [Online]. Bill & Melinda Gates Foundation. Available at: www.gatesfoundation.org/our-work/programs/global- growth-and-opportunity/water-sanitation-and-hygiene/reinvent-the-toilet-challenge-and- expo (Accessed: 17 May 2021). -Lundgren, B. (2019) From Pit Latrines to the Throne for Kings. Scandinavian Water & sanitation. -Wikberg Nilsson, Å., Ericson, Å., Törlind, P. (2016) Design, Process och Metod. Studentlitteratur AB. -ANSYS® FLUENT® 12.0 Fluent’s User Guide. (2020) 16.3.1 Overview and Limitations of the VOF Model. -Bergman, B., Klefsjö, B. (2019) Kvalitet från behöv till användning, Studentlitteratur AB. -Matsson, John (2020) An Introduction to ANSYS® Fluent® 2020. SDC Publications. -Acharya, Rutvika. (2016). Investigation of Differences in Ansys Solvers CFX and Fluent, Master Thesis, KTH. -Bardina, J.E., Huang, P.G., Coakley, T.J. (1997), "Turbulence Modeling Validation, Testing, and Development", NASA Technical Memorandum 110446 -ANSYS® FLUENT® 12.0 Fluent’s User Guide. (2020) 24.2.4. Quality Measure -ANSYS® FLUENT® 12.0 Fluent’s User Guide. (2020) 6.2.2 Mesh Quality -ANSYS® FLUENT® 12.0 Fluent’s User Guide. (2020) - 24.2.2 Choosing a Volume Fraction Formulation. -ANSYS CFD-Post User’s Guide (2020) 12.3. Contour Command -ANSYS CFD-Post User’s Guide. (2020) 12.1.6. Isosurface Command 1
Appendix A – Function Tree

                             2
Appendix B – Brainstorming 3
Appendix C – 2D Solutions

Figure 1 depicts the 2D solution to the VOF simulation on the original model.

    Figure 2 depicts the 2D solution to the VOF simulation on model A.

                                                                                4
Figure 3 depicts the 2D solution to the VOF simulation on model B.
Figure 4 depicts the 2D solution to the VOF simulation on model C.
5Figure 5 depicts the 2D solution to the VOF simulation on model A+B.
Figure 6 depicts the 2D solution to the VOF simulation on model A+C.
6Figure 7 depicts the 2D solution to the VOF simulation on model B+C.
Figure 8 depicts the 2D solution to the VOF simulation on model A+B+C.
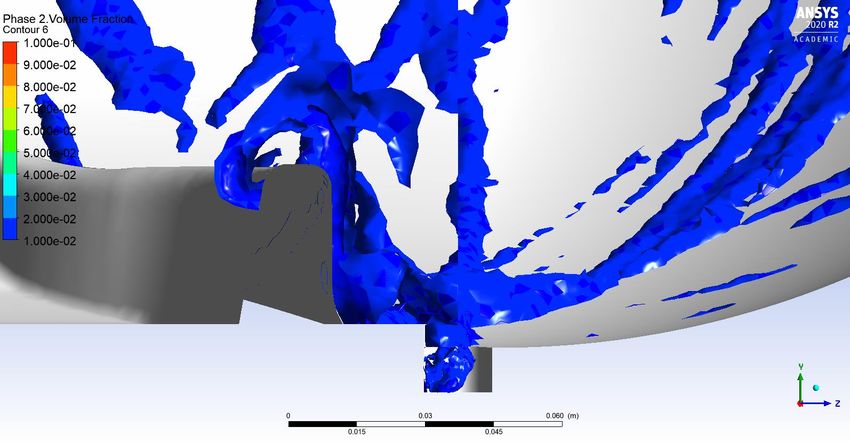
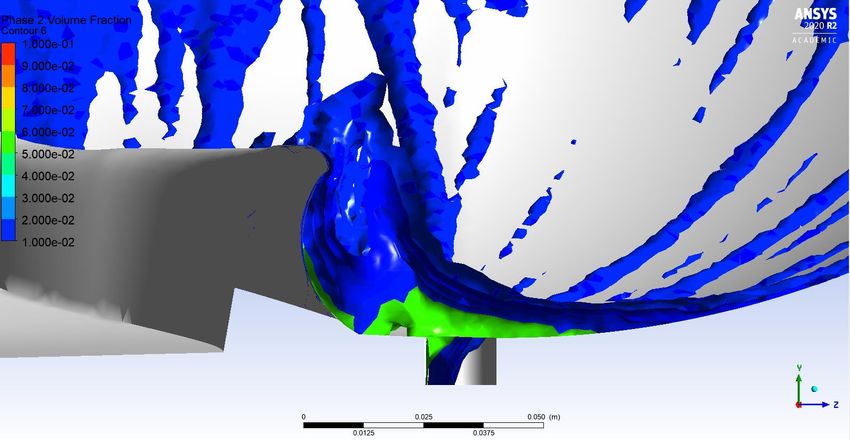
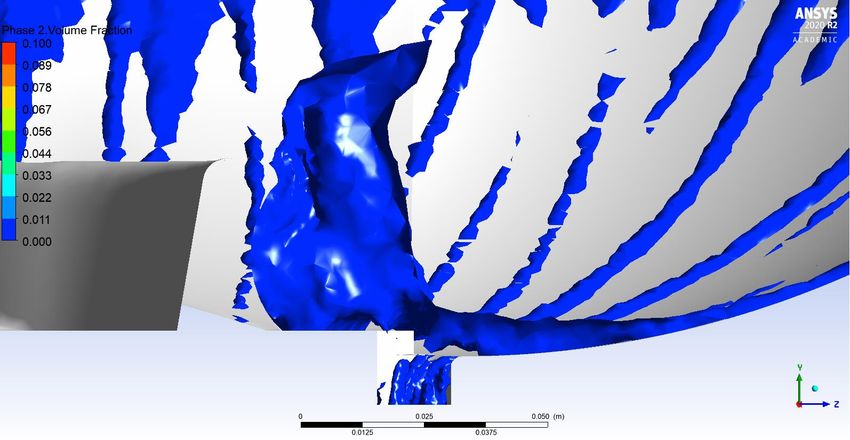
7Appendix D – 3D Results
Figure 1 depicts the result for the original geometry of the VOF simulation.
Figure 2 depicts the result for the Model A geometry of the VOF simulation.
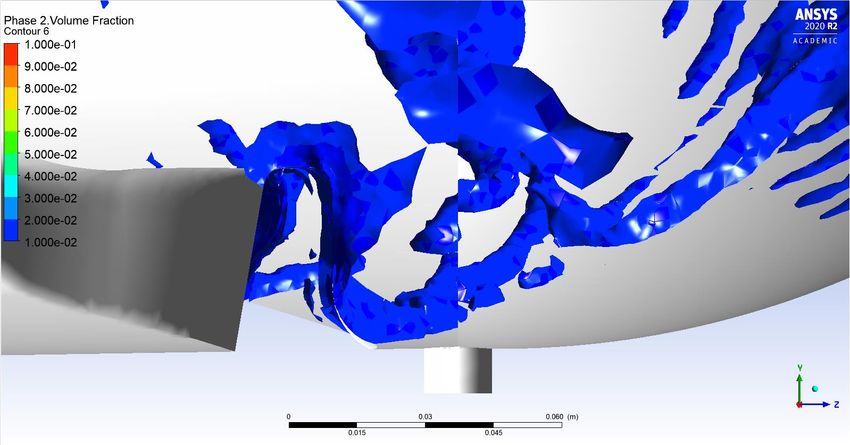
8Figure 3 depicts the result for the Model B geometry of the VOF simulation.
Figure 4 depicts the result for the Model C geometry of the VOF simulation.
9Figure 5 depicts the result for the Model A+C geometry of the VOF simulation.
Figure 6 depicts the result for the Model A+B geometry of the VOF simulation.
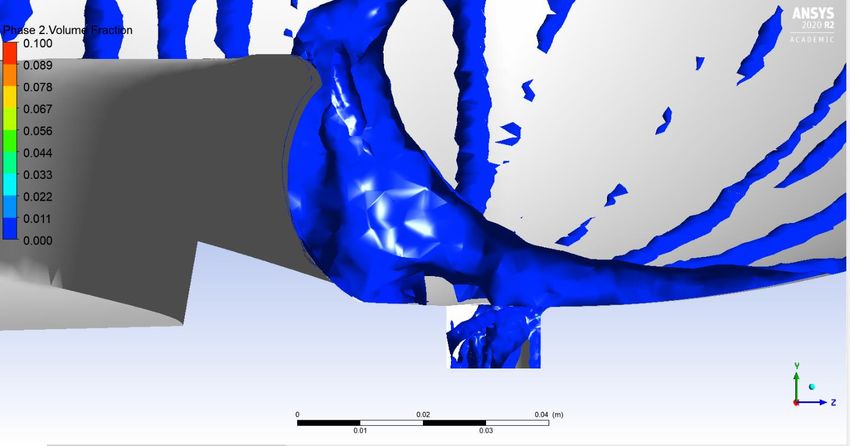
10Figure 7 depicts the result for the Model B+C geometry of the VOF simulation.
Figure 8 depicts the result for the Model A+B+C geometry of the VOF simulation.
11Appendix E – Pugh Matrix
12You can also read