LANXESS - Q1 2019 Conference Presentation - Stable performance despite weakening economy

Page created by Pedro Hale
 
CONTINUE READING
LANXESS - Q1 2019 Conference Presentation - Stable performance despite weakening economy
LANXESS – Q1 2019 Conference Presentation
Stable performance despite weakening economy

Investor Relations
LANXESS - Q1 2019 Conference Presentation - Stable performance despite weakening economy
Safe harbor statement

The information included in this presentation is being provided for informational purposes only and does not constitute
an offer to sell, or a solicitation of an offer to purchase, securities of LANXESS AG. No public market exists for the securities
of LANXESS AG in the United States.

This presentation contains certain forward-looking statements, including assumptions, opinions, expectations and views of
the company or cited from third party sources. Various known and unknown risks, uncertainties and other factors
could cause the actual results, financial position, development or performance of LANXESS AG to differ materially from the
estimations expressed or implied herein. LANXESS AG does not guarantee that the assumptions underlying such forward-
looking statements are free from errors nor does it accept any responsibility for the future accuracy of the opinions expressed
in this presentation or the actual occurrence of the forecast developments. No representation
or warranty (expressed or implied) is made as to, and no reliance should be placed on, any information, estimates, targets
and opinions, contained herein, and no liability whatsoever is accepted as to any errors, omissions or misstatements
contained herein, and accordingly, no representative of LANXESS AG or any of its affiliated companies
or any of such person's officers, directors or employees accept any liability whatsoever arising directly or indirectly
from the use of this document.

2
LANXESS - Q1 2019 Conference Presentation - Stable performance despite weakening economy
Agenda

    1    Resilient in challenging times
    2    Q1 – a solid start to 2019
    3    Back-up

3
LANXESS - Q1 2019 Conference Presentation - Stable performance despite weakening economy
Q1 2019: Resilience proven again

          EBITDA pre [€ m]                   EPS pre [€]

                    +2%                           +10%

            270               275        1.16               1.28

          Q1 2018           Q1 2019     Q1 2018            Q1 2019

         EBITDA pre margin            Net financial debt [€ m]

                    +20bp
                                                  +21%

           14.9%             15.1%                          1,675
                                         1,381

          Q1 2018           Q1 2019     Q4 2018            Q1 2019
4
LANXESS - Q1 2019 Conference Presentation - Stable performance despite weakening economy
More diversified and resilient end market exposure
and…
                                End market split by sales

               Others    15%                                20%
    Construction, E&E,
                         15%
               Leather
                                                            20%
      Agro Chemicals     10%

                         15%                                10%
            Chemicals

                                                            30%
           Automotive
                         45%

                                                            20%

                         2014                               2018

5
LANXESS - Q1 2019 Conference Presentation - Stable performance despite weakening economy
…substantially reduced dependency on volatile raw
materials
    LANXESS global raw materials index*   Total raw material expenses (2018)
                                          1,3-Butadiene
    200                                     Isobutylene
                                           Cyclohexane
    180
                                               Toluene
    160                                      Raffinate I
                                               Ethylene
    140
                                              Ammonia
    120                                      Propylene
                                               Styrene
    100
                                               Chlorine
    80                                    Cyclohexanon
                                            Acrylonitrile
    60
                                               Benzene
    40                                         4-ADPA
                                                 Aniline
    20

     0
                                                       LANXESS no longer dependent on
                                                             few raw materials
          * Average 2013 = 100%
6
LANXESS - Q1 2019 Conference Presentation - Stable performance despite weakening economy
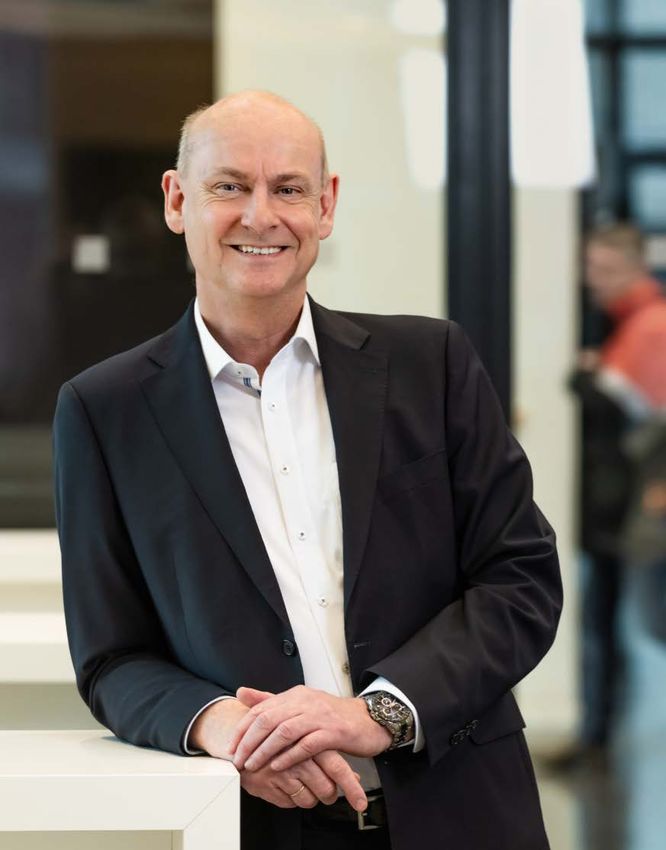
LANXESS with track record of organic growth…

    Visible organic EBITDA pre growth in all segments                                           LANXESS EBITDA pre*
[€ m]                       CAGR                                  CAGR                         [€ m]
                             ~4%                                   ~8%
                                                                                                              CAGR
                                                                                                               ~8%
Adv.                                            Spec.
Intermed.                                       Add.

                  2014               LTM 2019           2014             LTM 2019

                            CAGR                                  CAGR
                             ~2%                                  ~23%

Perf.                                           Eng.
Chem.                                           Mat.
                                                                                                       2014      Consensus 2019

                  2014               LTM 2019           2014             LTM 2019

                                                        Organic growth      Portfolio effect
7       * LANXESS without ARLANXEO
LANXESS - Q1 2019 Conference Presentation - Stable performance despite weakening economy
…and EBITDA-margin in targeted corridor

                                      Trajectory to mid-term target
    [EBITDA pre margin]

     18%

                                                                                       Ø14-18%*
                                                                        14.1%
     14%
                                                      12.9%    13.3%

                                        11.2%
                         10.1%
     10%
           8.9%

      6%
             2013
            2013            2014
                           2014            2015
                                          2015          2016
                                                       2016      2017
                                                                2017      2018
                                                                         2018    […]   2021 onwards

        Figures until 2017 incl. ARLANXEO
8
        * Group EBITDA pre margin through the cycle
LANXESS - Q1 2019 Conference Presentation - Stable performance despite weakening economy
Sustainability as core element of our strategy
Corporate Responsibility – Material topics and goals*

                                                         LANXESS: Leading, stable, sustainable and profitable

                                                                    Climate           Motivated
                                  Safe and                                                             Business-         Sustainable    Valuing
    Resilient                                                    protection and     employees and
                                 sustainable                                                             driven           product      customer
    sourcing                                                         energy          performing
                                    sites                                                              innovation         portfolio    relations
                                                                   efficiency          teams

                                                                              Good Corporate Governance

           Permanently
                                                         Reduction of                  -25% Energy                                     Keeping
           increase the                                                                                             20% women in
                                                         occupational                  consumption                                     customer
           proportion of                                                                                            management
                                                         accidents by                  and emissions                                   loyalty at a
           evaluated                                                                                                by 2020
                                                         >50% by 2025                  until 2025**                                    high level
           suppliers

     * Selection from all goals shown ** Specific emissions, base year 2015

9
LANXESS - Q1 2019 Conference Presentation - Stable performance despite weakening economy
Improving portfolio of businesses

                  Organic growth                                    Portfolio management

  Several projects of manageable size underway        Acquisitions executed at reasonable prices
                                                        strengthen portfolio and add resilience
  Attractive, return-improving project ROCE (~20%)
                                                       Divestments prove diligent approach to portfolio
                                                        management

10
Continuous enhancement of business set-up

                       Restructuring                                         Synergies

      Site closures where restructuring is necessary     Realization of Chemtura synergies ahead of plan
      Continuous evaluation of businesses                Sales synergies not included, providing further
                                                           cushion in softening environment

                                   Solid foundation for the LANXESS platform

11
Self-help measures in place to achieve goals

                       Self-help measures                      On track to reach financial goals for 2021

      Debottlenecking and brownfield growth
                                                                EBITDA pre
       capex (ROCE of ~20%)
      Implementation of remaining €30 m
                                                                  margin
                                                               (group, Ø through
                                                                                   14-18%
                                                                   the cycle)
       synergies from Chemtura until 2020
      Saltigo improvement
                                                                Cash con-
      Take Organometallics' margin to industry                  version*            >60%
       level (~15%)
      Further portfolio alignment                              EBITDA pre
                                                                  margin
                                                                 volatility
                                                                                   L2-3%pts
                                                                                     OW
12      * Cash conversion: (EBITDA pre – capex) / EBITDA pre
Agenda

     1   Resilient in challenging times
     2   Q1 – a solid start to 2019
     3   Back-up

13
Q1 2019: EBITDA pre robust despite economic
headwinds
                                Highlights                           Challenges

      EBITDA pre (€275 m) 2% above strong         Volume decline due to softer end markets (e.g.
       previous year                                automotive industry) and termination of low
                                                    margin contracts and site closures (ADD)
      EBITDA pre margin increase to 15.1%
                                                   Further increase of freight and energy prices
      €111 m* of €200 m share buy-back program
       already executed
      Three out of four segments with improved
       performance

14     * Status 31 March 2019
Q1 2019: Again evidence of resilience

                                                                                     1
     [€ m]                                                         Q1 2018                                Q1 2019       yoy in %
                                                                                                                                              Stable sales: positive pricing and
 Sales                                                                   1,816                              1,822                  0%          FX effect offset by lower volumes
                                                                                                                                              EBITDA pre and margin reflect
 EBITDA pre                                                                    270                            275                  2%
                                                                                                                                               successful pricing and favorable
               margin                                                     14.9%                             15.1%                              FX, partly offset by lower volumes
                                                                                                                                               and higher energy and freight costs
 EPS                                                                        0.89                             0.93                 4%
                                                                                                                                              Share buy-back supports EPS
 EPS pre          2                                                         1.16                             1.28               10%            increase
                                                                                                                                              Higher capex resulting from
 Capex                                                                          60                            72                20%            investments in debottleneckings
                                                                                                                                              Net debt impacted by ongoing
                                                                                                                                                                        4
                                                                                                                                               share buy-back (~€111 m) and
     [€ m]                                                          2
                                                             31.12.2018                             31.03.2019                   Δ%            IFRS 16 effect (~€130 m)
                                                                                                                                              Seasonally higher working capital
 Net financial debt 3                                                    1,381                              1,675               21%

 Net working capital                                                     1,455                              1,636               12%

        1 2018 applies to continuing operations                                                                     4 Status 31 March 2019
15      2 Net of exceptionals and amortization of intangible assets as well as attributable tax effects
        3 After deduction of time deposits and securities available for sale
Q1 2019: Positive price and FX mitigated by lower
volumes
     Q1 yoy sales variances           Price     Volume            FX       Portfolio   Total    Stable sales:
                                                                                                 Price increase and positive FX
     Advanced Intermediates            0%           +1%           +2%            0%    +4%       effect offset by lower volumes in
                                                                                                 BUs with auto exposure
     Specialty Additives              +1%           -9%           +5%         +1%      -3%

     Performance Chemicals             0%           0%            +4%            0%    +3%

     Engineering Materials            +1%           -6%           +3%            0%    -3%

     LANXESS                          +1%           -4%           +3%            0%    0%

     Q1 yoy LANXESS EBITDA pre bridge [€ m]                                                     EBITDA pre increases as lower
                                                                                                 volumes are offset by positive FX
                                                                                                 and pricing effects
         270                                                            275                     “Other“ include IFRS 16 and FX
                                                                                                 effects
       Q1 2018    Volume      Price   Input costs         Other        Q1 2019

16
Q1 2019: Advanced Intermediates very strong;
Specialty Additives again with improved margins
     Advanced Intermediates                                     Specialty Additives
         Price        Volume           FX           Portfolio       Price         Volume           FX           Portfolio

         +0%           +1%             +2%             0%           +1%            -9%             +5%            +1%

                                            Total     +4%                                               Total     -3%

      Solid volume growth with improved product mix in BU       Sales decline driven by lower volumes
       AII and in BU SGO despite still weak agro market          Volume drop due to termination of margin-dilutive
      Considerably improved EBITDA pre and margin versus         tolling agreements, closure of sites and lower auto
       already high previous-year level due to recovering BU      demand (especially BU RCH)
       SGO and strong performance in BU AII                      Portfolio reflects Solvay’s U.S. phosphorus additives
                                                                 Rising EBITDA pre and margin driven by pricing, FX
                                                                  and synergies

      [€ m]                    Q1'18                 Q1'19       [€ m]                     Q1'18                 Q1'19
      Sales                     565                   586        Sales                      500                   485
      EBITDA pre                102                   114        EBITDA pre                 81                    83
      Margin                   18.1%                 19.5%       Margin                    16.2%                 17.1%

17
Q1 2019: Performance Chemicals stabilizing,
Engineering Materials softer due to lower auto demand
     Performance Chemicals                                       Engineering Materials
         Price         Volume           FX           Portfolio       Price         Volume           FX           Portfolio

          0%             0%             +4%             0%           +1%            -6%             +3%             0%

                                             Total     +3%                                               Total     -3%

      Higher sales driven by positive currency effects           Sales decline resulting from lower volumes, mitigated
      Price increases in BU MPP and BU LPT offset by slightly     by USD tailwind and pricing
       lower prices in BU IPG and BU LEA                          Lower volumes mainly in BU HPM due to weaker auto
                                                                   demand
      Improved volumes in all BUs Text
                                   but LEA due to strikes
                                                                  EBITDA pre burdened by volumes despite favorable
      EBITDA pre and margin reflect good performance of BUs
                                                                   pricing and FX                 Text
       MPP and LPT and positive FX
                                                                  Margin remains on good level despite end market
                                                                   weakness
      [€ m]                     Q1'18                 Q1'19       [€ m]                     Q1'18                 Q1'19
      Sales                      336                   347        Sales                      392                   382
      EBITDA pre                 52                    54         EBITDA pre                 73                    65
      Margin                    15.5%                 15.6%       Margin                    18.6%                 17.0%

18
Q1 2019: Solid performance on high comparable base

                                                                                                   1
     [€ m]                                                                       Q1 2018                         Q1 2019         yoy in %    Increase in selling expenses driven
                                                                                                                                              by higher freight costs
     Sales                                                                  1,816           (100%)            1,822    (100%)        0%
                                                                                                                                             Reduced G&A costs due to lower
     Cost of sales                                                         -1,342            (-74%)           -1,351    (-74%)      -1%       provisions for var. compensation
     Selling                                                                  -199           (-11%)            -216     (-12%)      -9%       and lower costs of the former
     G&A                                                                         -77           (-4%)            -66      (-4%)      14%       Chemtura businesses
                                                                                                                                             Improved net income driven by
     R&D                                                                         -30           (-2%)            -28      (-2%)       7%
                                                                                                                                              better financial result and tax rate
     EBIT                                                                       154              (8%)           139      (8%)      -10%
                                                                                                                                             Increased EPS pre also reflects
     Net Income                                                                   81             (4%)            84      (5%)        4%       share buy-back
                  2
     EPS pre                                                                  1.16                             1.28                 10%      Higher exceptionals due to M&A
                                                                                                                                              projects, adjustment of production
     EBITDA                                                                     255           (14%)             253     (14%)       -1%
                                                                                                                                              network and digitalization
     thereof exceptionals                                                       -15            (-1%)            -22      (-1%)      47%

     EBITDA pre exceptionals                                                    270        (14.9%)              275    (15.1%)       2%

                                                                                       Figures reflect higher resilience

           1) 2018 applies to continuing operations
19         2) Net of exceptionals and amortization of intangible assets as well as attributable tax effects
Proven stability of portfolio – EBITDA pre decline in
Engineering Materials offset by other segments
     [€ m] Q1 2019 Sales                                                                                                        [€ m] Q1 2019 EBITDA pre

                                                                                                                                                     +2%
                                   +0%
                                                                       AII                                     SGO                       270                   275
                 1,816*                            1,822*
                                                                                                                                          102                   114
                                                                                                                                                      +12%
 Advanced
                    565               +4%               586
                                                                       ADD                                     RCH
 Intermediates

                                                                                                                                          81            +2%     83
 Specialty          500                -3%              485
 Additives                                                             IPG               LEA         MPP       LPT
                                                                                                                                          52            +4%     54
 Performance        336               +3%               347
 Chemicals

 Engineering        392                -3%              382
                                                                       HPM                                     URE                        73           -11%     65
 Materials

                 Q1 2018                          Q1 2019                                                                                 -38                   -41
                                                                                                                                        Q1 2018               Q1 2019

                                        Advanced Intermediates   Specialty Additives   Performance Chemicals    Engineering Materials      Reconciliation

         * Total group sales including reconciliation
20
Q1 2019: FX driven sales growth in Americas and Asia
offset by decline in EMEA and Germany
     Q1 2019 sales by region [%]                             Regional development of sales [€ m]
                                                                                                             Operational
                                                                                  1,816            1,822    development*
 North
 America                                         LatAm
                                                               Asia/Pacific        391     +2%      399          -3%
                                       5
                   22                              Asia/
                                                                     LatAm         89      +3%      91           -4%
                                                   Pacific
                                             22
                                                             North America         373     +6%      396
                                                                                                                 -3%

                                                                                   603     -2%      591          -3%
                                            19                       EMEA
                   32                                           (excl. Germany)

 EMEA                                            Germany         Germany           360     -4%      345          -5%
 (excl. Germany)

                                                                                  Q1 '18           Q1 '19

        * Currency and portfolio adjusted
21
Cash flow Q1 2019: Stable operating cash flow

                                                              1
     [€ m]                                         Q1 2018        Q1 2019     Higher depreciation due to IFRS
                                                                               16 effect
 Profit before tax                                     120            118
                                                                              Changes in other assets and
 Depreciation & amortization                           101            114      liabilities driven by lower
                                                                               provisions for variable
 Financial (gain) losses                                17             15
                                                                               compensation and utilization of
 Income taxes paid                                      -31            -39     provisions, e.g. restructuring

 Changes in other assets and liabilities                27             -14    Changes in working capital
                                                                               reflects normal seasonal pattern
 Operating cash flow before changes in WC              234            194
                                                                              Investing cash flow comprises
 Changes in working capital                            -206           -162     investment of liquidity after
                                                                               ARLANXEO divestment
 Operating cash flow                                    28             32
                                                                              Capex increase driven by
 Investing cash flow                                   -113           -239     debottlenecking investment
                                                                               program
      Thereof capex                                     -60            -72
                                                                              Share buy-back reflected in
 Financing cash flow                                    11            -157     financing CF

         1 2018 applies to continuing operations
22
Balance Sheet: Solid!

                                                                      1
 [€ m]                                     *                          31.12.2018    31.03.2019    Stable total assets and equity
                                                                                                   ratio
Total assets                                                                8,687        8,837
                                                                                                  Net debt impacted by ongoing
Equity (incl. non-controlling interest)                                     2,773        2,813     share buy-back (€111 m)3and
                                                                                                   IFRS 16 effect (~€130 m)
Equity ratio                                                                 32%          32%
                                                                                                  Cash proceeds from sale of 50%
                                                                                                   share in ARLANXEO partly
Net financial debt                                                          1,381        1,675
                                                                                                   included in treasury financial
(including cash and near cash assets)
                                                                                                   assets
Near cash, cash & cash equivalents                                           797           434    Higher pension provisions due to
Pension provisions                                                          1,083        1,110     declining underlying interest rate
                                                                                                   in Germany

Net working capital                                                         1,455        1,636    Seasonal increase in net working
                                                                                                   capital
                    1
DSI (in days)                                                                 69            69
                        2
DSO (in days)                                                                 46            48

       1 Days of sales in inventory calculated from quarterly sales
23     2 Days of sales outstanding calculated from quarterly sales
       3 Status 31 March 2019
Stable and solid balance sheet

     [€
      [€ m]
         m]                              Dec 2018       Mar 2019                                        Dec 2018     Mar 2019
     Non-current assets                        4,786        4,977    Stockholders' equity                    2,773       2,813
      Intangible assets                         1,764        1,786    attrib. to non-contr. interests           -7           -8
      Property, plant & equipment               2,577        2,717   Non-current liabilities                 4,395       4,546
      Equity investments                            0            0    Pension & post empl. provis.           1,083        1,110
      Other investments                             2            2    Other provisions                         337          351
      Other financial assets                       25           25    Other financial liabilities            2,686        2,783
      Tax receivables                              14           14    Tax liabilities                          117          129
      Other non-current assets                    404          433    Other liabilities                         83           79
     Current assets                            3,901        3,860     Deferred taxes                            89           94
      Inventories                               1,347        1,386   Current liabilities                     1,519       1,478
      Trade account receivables                   903          975    Other provisions                         465         479
      Other current financial assets              598          789    Other financial liabilities               59          78
      Other current assets                        256          276    Trade accounts payable                   795         725
      Near cash assets                              0            0    Tax liabilities                           44          48
      Cash and cash equivalents                   797          434    Other liabilities                        156         148
     Total assets                              8,687        8,837    Total equity & liabilities              8,687       8,837

                                 IFRS 16 effect of ~€130 m impacts PP&E and other financial liabilities

24
FY 2019 EBITDA pre guidance between
€1,000 m and €1,050 m

                     General trading environment softer, but not deteriorating
     Current view    Auto: Expected to remain weak, especially in Asia
     on economy      Agro: Recovery not yet visible
                     China: No impulse from governmental stimuli yet

                                    FY 2019 EBITDA pre expected
     LANXESS
                                   between €1,000 m and €1,050 m
     FY 2019

25
Agenda

     1   Resilient in challenging times
     2   Q1 – a solid start to 2019
     3   Back-up

26
Housekeeping items

     LANXESS financial expectations

      Capex 2019:                      ~€500 m
      Operational D&A 2019:            ~€450 m
      Reconciliation 2019:             ~€150 m - €160 m including remnant costs
      Tax rate:                        Around 30%
      Exceptionals 2019:               €30 m - €60 m based on current initiatives
      FX sensitivity:                  one cent change of USD/EUR resulting in
                                        ~€7 m EBITDA pre impact before hedging

      IFRS 16 effects 2019:
       Reclassification of ~€35 m from operating result to depreciation and interest expense (low single-digit € millions)
        leading to EBITDA pre improvement
       Rise in fair value of leasing liabilities by ~€130 m burdening net debt

27
FY 2018: Improved results in three segments drive
performance in tougher environment
                      EBITDA pre
                                                  Strong performance despite
     Advanced                                           Agro weakness
                     335           359    +7%
     Intermediates                                      Organometallics not being fixed yet
                     2017          2018

                                                  Substantial increase despite
     Specialty                     343                  Synergies not yet fully realized
                                          +28%
     Additives       267
                                                        Weakness in BU RCH
                     2017          2018

                                                  Very tough chrome ore value chain
     Performance                                  Difficult market in relevant construction applications
                     252                  -26%
     Chemicals                     187
                     2017          2018

                                                  Significant development despite
     Engineering                   267                  Softening demand in auto industry
                     219                  +22%
     Materials                                          Raw material price headwind in BU URE (TDI / MDI)
                     2017          2018

28
EBITDA pre and margin continuously improve

     [€ m] EBITDA pre and margin development first quarter*                                                           Q1 EBITDA pre and margin
                                                                                                                       continue to grow
                                                                                                                      Improvement - even in more
      20.0%                                                                                                    300     challenging environment -
                                                                                                                       reflects increasing resilience of
                                                                                                               250
      15.0%
                                                                                                                       LANXESS‘ business setup
                                                                                                               200    Q1 2017 margin development
                                                                                                                       held back by lagging raw
      10.0%                                                                                                    150     material price pass-through
                                                                                                               100    Significant increase in Q1 2018
       5.0%                                                                                                            due to acquisition of Chemtura
                                                                                                               50      and synergies
       0.0%                                                                                                    0
                   Q1 13            Q1 14            Q1 15            Q1 16       Q1 17        Q1 18   Q1 19
                                                 EBITDA pre                EBITDA pre Margin

        * LANXESS without ARLANXEO, figures 2013 – 2016 indicative / unaudited
29
LANXESS EBITDA pre increases versus strong prior
year despite challenging environment
     EBITDA pre Q1 2018 vs. Q1 2019 [€ m]

                                                      2%
 Peer A
                                                      2%
 Peer B                                         -2%
 Peer C                                       -3%
 Peer D                                       -3%
 Peer F                                -11%
 Peer E                             -12%
 Peer G                -31%
                        -31%
 Peer H         -58%

30
New Board member responsible for additives business

     Anno Borkowsky

      Responsibility for all businesses in the Specialty Additives segment
      New position underpins importance of additives business at LANXESS
      Start on June 1, 2019
      Roughly 30 years of experience in the chemical industry
       − Since 1990: working at Bayer / LANXESS
       − 2004-2017: Head of RheinChemie (additives) business unit
       − 2017-2019 Head of Additives business unit

31
Reorganization of Specialty Additives segment

     Advanced                Specialty                            Performance                      Engineering
     Intermediates           Additives                            Chemicals                        Materials

      Advanced Industrial    Polymer Additives (new)             Material Protection Products    High Performance Materials
       Intermediates         − Flame retardants /
                               other plastics additives            Inorganic Pigments              Urethane Systems
      Saltigo               − Head of BU: Karsten Job             Leather
                              Lubricant Additives                 Liquid Purification
                               Business (new)                       Technologies
                             − Lubricants / lubricant additives
                             − Head of BU: Martin Saewe

                              Rhein Chemie
                             − Rubber additives / colorants
                             − Head of BU: Philipp Junge

32
Advanced Intermediates: Solid backbone with focus
on organic growth
                                                               AII                    SGO

     Market positions1                                      TOP 3                      #1

     Expected growth                                        ~3-4%              Recovery in 2019

       Development
                                                     Rather organic            Organic & External
          focus

                                               Invest €100 m into            Best prepared for agro
                                                 debottleneckings              recovery

                                               Ramp up profitability of      Expand fine chemicals
      Growth drivers                             Organometallics to peer       business
                                                 level (around 15%)

        1) Position in global market (LANXESS internal market analysis)
33
        Growth assumption on existing asset base
Specialty Additives: Leading additives platform with
broad expansion opportunities
                                                             ADD                        RCH

     Market positions1                                      TOP 3                        #1

     Expected growth                                          ~4%                       ~3%

       Development
                                                  Organic & External             Organic & External
          focus

                                               Generate synergies until        Use unique global scale
                                                 2020                            to penetrate market

                                               Leverage position in            Leverage innovations
      Growth drivers                             dynamic markets
                                                                                Streamline product
                                               Push product innovations         portfolio
                                                 (next generation FR) and
                                                 synthetic base lubricants

        1) Position in global market (LANXESS internal market analysis)
34
        Growth assumption on existing asset base
Performance Chemicals: Expect structural changes!

                                                           IPG                     LEA                        MPP                     LPT

     Market positions1                                      #1                    TOP 2                      TOP 3                   TOP 3

     Expected growth                                      ~ 2%                    1 - 2%                       3%                   4 - 10%

       Development
                                                        Organic               Restructuring           Organic & external      Organic & External
          focus

                                             Benefit from industry        Trimmed chrome            Expand and enrich      Option to build-up
                                                consolidation               value chain                regulatory              production footprint
                                                                                                       organization to         (new assets) in North
                                             Further penetrate and        Potential partnerships     penetrate global        America or China
      Growth drivers                            develop North                                          markets
                                                American market                                                               Further develop
                                                                                                      Benefit from            high-value market
                                                                                                       disinfection trends     applications

        1) Position in global market (LANXESS internal market analysis)
35
        Growth assumption on existing asset base
Engineering Materials: Leading players with clear
strategy for market independent growth
                                                             HPM                       URE

     Market positions1                                  # 2 Europe                      #1

     Expected growth                                          ~5%                      ~3%

       Development
                                                           Organic             Organic & external
          focus

                                             Lightweight trend and          Expand market share in
                                                e-mobility                    Europe and Asia

                                             Capital light compounding      Leverage further product
      Growth drivers                            investments                   innovations (esp. on
                                                                              low-free isocyanate
                                             Continuous consumer             products)
                                                product innovation in E&E
                                                                             Benefit from automation
                                                                              trends

        1) Position in global market (LANXESS internal market analysis)
36
        Growth assumption on existing asset base
LANXESS delivers on organic growth –
upcoming capacity expansions
     Organic investment program well on track                                          Capex

 BU AII:   Expansion of hexandiol production, Krefeld-Uerdingen (Germany)              not discl.

           Menthol expansion, Krefeld-Uerdingen (Germany)                              not discl.

           Expansion for benzyl alcohol, Krefeld-Uerdingen (Germany)                   small double-digit €m

 BU RCH:   Capacity expansion for Macrolex brand dyes, Leverkusen                      ~€5m
           (Germany), available Q2 2019

 BU LPT:   Ion exchange resigns production, Leverkusen (Germany),                      single-digit €m
           available mid 2019

 BU IPG:   Planned capacity increase for iron oxides pigments, Krefeld-                not discl.
           Uerdingen (Germany) and Porto Feliz (Brazil), available in 2019

 BU HPM:   New compounding facility in Changzhou (China), available Q2 2019            ~€20m

           New compounding facility, Krefeld-Uerdingen (Germany)                       mid double-digit €m

           Capacity expansion for continuous fiber-reinforced thermoplastic            single-digit €m
           composites at Bond-Laminates, Brilon (Germany), available Q3 2019

 BU URE:   Additional prepolymers capacity, Porto Feliz (Brazil), available mid 2019   single-digit €m

37
Capital allocation priorities after ARL exit: Focus on
deleveraging and building a superior growth platform
                                                        Capital allocation after receipt of cash

                Attractive growth                                       Deleveraging                            Share buy-back

      M&A following our communicated                        Funding of German pension liabilities    Share buy-back to be executed
       financial matrix                                                                                 between January and year end 2019
                                                             New funding ratio improved to ~57%*
      Investments into new and already
       announced brownfield &
       debottlenecking projects (until ~2021)

                     €400 – €X m                            €200 m     of ~ €400 m - €500 m                     up to €200 m

                                           Use of proceeds in line with investment grade commitment

38       * based on pensions at 31st of December 2018
Chemtura synergies realized ahead of plan

             Implementation of synergies faster than predicted                                                                                               Key Messages

                                                                                                                                              Synergies confirmed
                                                                                                                                                 − €100 m of “hard” costs
     [€ m]                                 2017             2018            2019             2020            Total
                                                                                                                                                 − Earlier realization

                  Synergies                 ~30             ~40
                                                                            ~20              ~10            ~100
                                                                                                                                                − Topline synergies not included
                                                                       ~10                                                                    OTCs and cash-outs confirmed
              Expense
      (one-time costs)*
                                            ~80              ~30             ~20              ~10            ~ 140
                                                                                                                                             Capex confirmed, mainly
                                                                                                                                               related to Manufacturing
                   Cash
                    Cashout*
                         out                ~40              ~50             ~40              ~10            ~ 140
                                                                                                                                              Excellence

                         Capex              ~20              ~20             ~10                              ~50
                                                                                                                         

     * Does not include ~€65 m PPA charges from inventory step-up in opening balance sheet. Transaction related charges were recognized in opening balance
39     sheet
Business Unit Additives with strong focus on
 high value-add industrial lubricant solutions
              Well diversified and specialized lubricants portfolio     A leading specialties player

     Sales of Business Unit Additives
     - illustrative                                 Commodities        Highly diversified end-market
                                                       ~20%             split with focus on industrial
                                                                        lubricants

            Bromine                                                    Strong expertise in high
            Solutions                                        Auto-      value-add specialty lubricants
                           Lubricant                         motive
                                                                       Leading positions in mid-sized
                           Additives
                                                  General               and niche markets
            Plastic                               Industry
            Additives                                                  Automotive exposure well
                                                                        balanced with additives and
                                                                        base stocks only for high
                                                    Specialities        grade specialty engine oils
                                                      ~80%              (highest category 4 & 5)

40
Maturity profile actively managed and well balanced

     Long-term financing secured                                                       Liquidity and maturity profile as per March 2019

      Diversified financing sources                                                          [€ m]

       − Bonds & private placements                                                    1500

       − Syndicated credit facility                                                    1000
                                                                                                                            Bond         Bond        Hybrid                     Bond         Bond                    Hybrid
                                                                                                                            2021         2022        1st call*                  2025          2026                    2076*
                                                                                                                           0.250%       2.625%        4.50%                    1.125%        1.00%                   4.50%
      Average interest rate of financial                                                500
                                                                                                  Cash & cash
                                                                                                                                                                                                        Private
                                                                                                                                                                                                      placement
       liabilities ~2%                                                                            equivalents                                                                                        3.95% (2027)
                                                                                            0                                            Private
      Next bond maturity in 2021                                                                                                      placement
                                                                                                                                      3.50% (2022)
                                                                                        -500

      All group financing executed                                                   -1000
       without financial covenants                                                                Financial
                                                                                                                                            Syndicated revolving credit
                                                                                      -1500        assets
                                                                                                                                                      facility
                                                                                                                                                     €1.25 bn
                                                                                      -2000
                                                                                                        2019        2020   2021          2022         2023         2024         2025         2026       2027         2028+

                                                                                                Financial liabilities             Cash & cash equivalents                 Financial assets                  Credit facility

         * Hybrid bond with contractual maturity date in 2076 has a first optional call date in 2023.
41
Climate protection: Target of specific CO2 emissions
(scope 1+2)1 of -25% by 2025
     Greenhouse gas emissions (Scope 1) on track for 2025 targets                                                                                                               2018 development
 [t CO2e/t of product]                                                                                                                                                 ARLANXEO divestment and linked
                                                                                                                                                                        changes to portfolio led to higher
             -44%                             -17% (target: -10%2)                                                Target: -25%                                        specific Scope 1 emissions
                                                                                                                                                                        (generation and use in ongoing
                                                                                                                                                                        operations comparatively more energy
 0.55
                                                                                                                                                                        from primary energy sources)
                                                                                                                                                                       Chemtura akquisition (2018 FY full
           0.40                                                                                                                                                         contribution) with impact on scope 1
                      0.32 0.30 0.30                                                                                                                                    emissions whereas positive on scope
                                     0.29 0.29 0.29
                                                                                          0.25 0.26 0.25 0.27                                                           2+3
                                                                                                                                                   0.19                Mitigating effect from reduced use of
                                                                                                                                                                        coal (China) and higher use of
                                                                                                                                                                        biomass (India & Brazil)
                                                                                                                                         …

         2007–2010                                          2011–2015                                                2016–2025

        1 Reduction of specific CO emission (scope 1) by 25% until 2025; reduction of specific energy consumptions (scope 2) by 25% until 2025; Reduction of volatile organic
                                  2

42      compounds (NMVOC3, scope 3) emissions by 25% until 2025; 2 Reduction of specific greenhouse gas emissions (scope 1) by 10% per reporting segment achieved
Awards in ratings and indices reflect high
sustainability standards
     Commitment and entitlement    Awards in ratings and indices

                                    Member DJSI World and Europe   EcoVadis „Gold Recognition Level“

                                           Klimascore A-                     Index Member

43
LANXESS products enable sustainable solutions in
key areas of application
          Quality you can drink                     Lightweight solutions                 Protection against diseases

     With its Lewabrane® membrane             High-performance plastics from            Saltidin® is an insect repellent
     elements and Lewatit® ion exchange       LANXESS, such as Durethan®,               proprietary to LANXESS subsidiary
     resins, the Liquid Purification          Pocan® and Tepex®, can replace            Saltigo. It is used in insect repellents
     Technologies business unit offers a      many of the metal parts in cars to help   and lowers the risk of contracting
     high-performance solution for ensuring   reduce weight and fuel consumption,       malaria, dengue fever, Zika virus,
     a reliable supply of drinking and        without compromising on vehicle           borreliosis or encephalitis.
     purified water.                          safety.

44
…and LANXESS keeps innovating to meet present
and future sustainability demands
             ULP membranes                     Components for e-scooters                  Circular leather production

     LANXESS’ new ultra-low pressure         Pocan AF 4110 enables light housing        With the X-Biomer INSITU technology,
     (ULP) membranes have the ability to     components for bike and scooter            retanning agents can be produced
     remove trace elements originating for   batteries and combines low warpage         from by-products on site in the tannery.
     instance from drugs, chemicals,         with excellent mechanical properties –     This means less chemical use, less
     cosmetic products and crop protection   only one example of the wide-ranging       logistics costs, less waste and less
     agents almost entirely even at low      product portfolio for electric mobility.   CO2 emissions.
     operating pressures.

45
Adding value to business and society – various
concepts to asses and measure our impacts
                                     Societal Added Value

       Sustainability profile and   The quantified impact of our   Our contribution to the Agenda
        societal impacts of our        gate-to-gate business       2030 goals to overcome society
               products                operations on society                 challenges

                                                                   Sustainable Development Goals
     Product Portfolio Assessment    Impact Valuation Concept
                                                                              Analysis

46
Management compensation

                                                          Fixed annual base salary
     Fix         Annual base salary
                                                          Compensation in kind (mainly tax value of perquisites)

                                                          Based on: Targets for EBITDA pre exceptionals
                 Annual Performance
                                                          Cap: 200% of individual budget
                 Payment (APP)
                                                          Deduction in case of serious safety and/or environmental problems

                Long-term orientation
                 Long-Term                                Based on: Individual APP target for 2 successive fiscal years
                 Performance Bonus
 Variable        (LTPB)                                   Cap: 45% of annual base salary (Ø APP target attainment of 100%)

                                                          Based on: LXS stock performance vs. MSCI World Chemicals Index*
                                                          Cap: 30% of annual base salary
                 Long-Term
                                                          Vesting period: 4 years**
                 Stock Performance
                 Plan (LTSP)*                             Until 2017: Personal investment in LXS shares (5% of annual base salary)
                                                          Since 2018: Share performance rights plus share ownership guidelines
                                                            (investment in LXS shares: CEO 1.5x and board members 1x of base salary)

      *LTSP 2014–2017; Dow Jones STOXX 600 ChemicalsSM serves as a reference index for the LTSP 2010–2013
      ** Five year vesting period applies to LTSP 2010–2013
47
Slightly higher exceptional items (on EBIT) due to
plant closure in Jinshan and projects
 [€ m]                              Q1 2018              Q1 2019              FY 2018              FY 2019
                                         Thereof              Thereof              Thereof              Thereof
                              Excep.               Excep.               Excep.               Excep.
                                          D&A                  D&A                  D&A                  D&A

     Advanced Intermediates     0             0      0             0      0             0      0             0

     Specialty Additives        0             0      1             0      0             0      1             0

     Performance Chemicals      1             0      4             0      1             0      4             0

     Engineering Materials      0             0      0             0      0             0      0             0

     Reconciliation            14             0     17             0     14             0     17             0

     Total                     15             0     22             0     15             0     22             0

48
Upcoming events 2019 / 2020

     Proactive capital market communication
        mBank Chemicals Day                                     June 4            Warsaw
        dbAccess Berlin Conference                              June 5/6          Berlin
        Exane BNP Paribas 21st CEO Conference                   June 11/12        Paris
        J.P. Morgan Cazenove European Materials Conference      June 12           London
        Morgan Stanley Cannon Ball Run                          June 25           Cologne
        Q2 2019 results                                         August 2
        Goldman Sachs & Berenberg German Corporate Conference   September 23-25   Munich
        Q3 2019 results                                         November 13
        Meeting the Management                                  November 15       Cologne
        Annual Stockholders’ Meeting 2020                       May 13            Cologne

49
Contact details Investor Relations

           Oliver Stratmann                        Katharina Forster
           Head of Treasury & Investor Relations
                                                   Institutional Investors / Analysts / AGM
           Tel.: +49-221 8885 9611
                                                   Tel.: +49-221 8885 1035
           Fax.: +49-221 8885 5400
                                                   Mobile: +49-151 7461 2789
           Mobile: +49-175 30 49611
                                                   Email: Katharina.Forster@lanxess.com
           Email: Oliver.Stratmann@lanxess.com

           André Simon                             Eva Frerker
                                                   Institutional Investors / Analysts
           Head of Investor Relations

           Tel.: +49-221 8885 3494
                                                   Tel.: +49-221 8885 5249
           Mobile: +49-175 30 23494
                                                   Mobile: +49 151 74612789
           Email: Andre.Simon@lanxess.com
                                                   Email: Eva.Frerker@lanxess.com

                                                   Janna Günther
           Laura Stankowski                        Private Investors / AGM
           Assistant to André Simon
           Tel.: +49-221 8885 3262
           Fax.: +49-221 8885 4944                 Tel.: +49-221 8885 1989
           Email: Laura.Stankowski@lanxess.com     Mobile: +49 151 7461 2615
                                                   Email: Janna.Guenther@lanxess.com

                                                   Jens Ussler
                                                   Institutional Investors / Analysts

                                                   Tel.: +49-221 8885 7344                    Visit the IR
                                                   Mobile: +49 151 74612913
                                                   Email: Jens.Ussler@lanxess.com                website

50
Abbreviations

     Advanced Intermediates                      Performance Chemicals
      AII   Advanced Industrial Intermediates    IPG   Inorganic Pigments
      SGO   Saltigo                              LEA   Leather
                                                  MPP   Material Protection Products
                                                  LPT   Liquid Purification Technologies

     Specialty Additives                         Engineering Materials
      LAB   Lubricant Additives Business         HPM   High Performance Materials
      PLA   Polymer Additives                    URE   Urethane Systems
      RCH   Rhein Chemie

51
You can also read