Investor Presentation February 2021 - Satin Creditcare ...
←
→
Page content transcription
If your browser does not render page correctly, please read the page content below
Investor Presentation February 2021

Content

                       03 - 08                                                            09 - 13                                                            14 - 28
           COVID – 19 Business Update & New                                     Overview and Key Performance                                          What makes Satin a Compelling
                       Initiatives                                                        Highlights                                                        Investment Story

                                                         29 - 42                                                            43 - 49
                                                   Key Financial & Operational
                                                            Metrices                                                      Company Background

Cautionary Statement

Any forward-looking statements about expected future events, financial and operating results of the Company are based on certain assumptions which the Company does not guarantee the fulfilment of.
These statements are subject to risks and uncertainties. Actual results might differ substantially or materially from those expressed or implied. Important developments that could affect the Company’s
operations include a downtrend in the industry, global or domestic or both, significant changes in political and economic environment in India or key markets abroad, tax laws, litigation, labour relations,
exchange rate fluctuations, technological changes, investment and business income, cash flow projections, interest and other costs. The Company does not undertake any obligation to update forward-
looking statements to reflect events or circumstances after the date thereof. Based on revised returns filed by the company, some items for the year ended Mar31, 2020 have been regrouped.
COVID-19 Business Update
    New Initiatives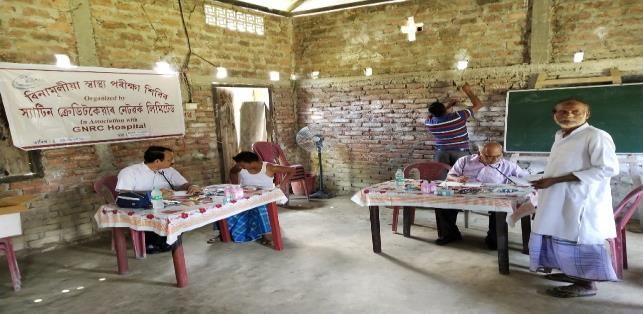
Witnessed Significant Improvement in Collection Efficiency
Backed by Substantial Reduction in % of Non-Paying Customers

      •    98% clients have paid all instalments in Jan’21 as against 68% in Sep’20

      •    Significant improvement in number of non-paying clients from 11% in Sep’20 to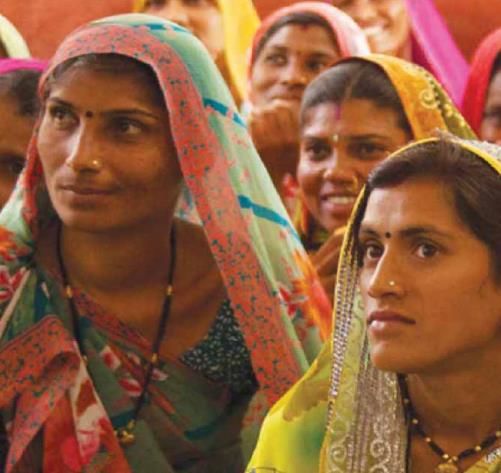
AUM & Disbursement Approaching Pre- COVID levels
                              Disbursement Approaching Pre-COVID Levels While Displaying Healthy Asset Quality

                                                   914

                731                                227
                                                                                                                                                     607
                289                                         Reaching Pre-COVID Level
                                                                                                                                                     198

                                               2,516                                                                   239
               1,904
                                                                                       22                              85                            1,624

                                                                                       13                              632
                                                                                       54
              Q3 FY20                        Q4 FY20                               Q1 FY21                           Q2 FY21                       Q3 FY21
                  Standalone Disbursments (Rs. Crs.)                       Disbursements by Subsdiaries (Rs. Crs.)                        Avg Monthly Disbursement (Rs. Crs.)

                                                            AUM Growth Resumes from Q3FY21 Onwards

                            8,174                   8,119
                                                                            7,667                 7,880
      7,284                                                                                                                  • Consolidated AUM grew by 2.8% QoQ and 8.2%
                             954                     939                                                                       YoY to reach Rs 7,880 crore in Q3FY21
                                                                             923                   972
      894
                                                                                                                                   o Standalone: Q3FY21 AUM grew by 2.4%
                                                                                                                                     QoQ and 8.1% YoY to Rs 6,907 crore
                            7,220                   7,181                   6,744                 6,907
      6,390
                                                                                                                                   o Subsidiaries (TFSL, SHFL & SFL): Q3FY21
                                                                                                                                     AUM grew by 5.4% QoQ and 8.8% YoY to Rs
                                                                                                                                     972 crore
     Q3 FY20               Q4 FY20                 Q1 FY21                 Q2 FY21              Q3 FY21
                       Standalone AUM (Rs. Crs.)           AUM of Subsdiaries (Rs. Crs.)                                                                                        5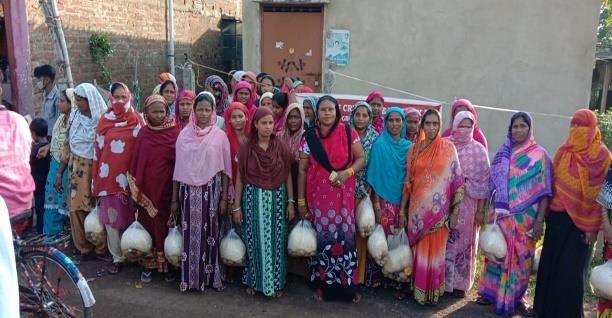
COVID-19 Business Update: Collections, Capitalization & Liquidity
Provisioning and Asset Quality
    • Prudently recognized provisions of Rs 305 crore in 9MFY21
    • Adequate Provisioning: Cumulative Provisions stood at 5.7% of the on-book AUM as of 31st Dec’20, on account of potential COVID related asset quality risks
    • GNPA stands at 1.5%* (without Assam at 0.5%), while Pro forma GNPA at 9.6% (without Assam at 7.6%)
    • Addition of 747 employees as support staff for collections

Healthy Capitalization & Comfortable Liquidity Position
    •      CRAR of 25.31% as of 31st Dec 2020 (leverage ratio stood at 4.4x)
    •      Net worth of the company stood at Rs 1,371 crore on 31st Dec’20 (BVPS: Rs 203**)
    •      Continue to maintain a healthy balance sheet liquidity with Rs. 1,831 crore of surplus funds as on 31st Dec 2020. Furthermore, the company has undrawn sanctions worth Rs. 881 crore
    •      Bolstered Capital position by successfully raising Rs. 120 crore via Rights Issue of partly paid equity shares in 9MFY21 (Ratio of 48:125). The issue was oversubscribed at 123%
               o      Share application money of Rs. 15 per share is received by the Company. Balance amount would be called via one or more subsequent calls as determined by the Board

Customers Connect During COVID-19

    •      New “Customer Service App” launched to increase digital and financial awareness among clients and to connect with brand “SATIN”
    •      Payment option at Satin website also started along with UPI 2.0 (auto debit option)

Socially Responsible at The Time of COVID - 19
    •      Contribution to PM Cares Fund and CM Relief Fund in Assam
    •      Distribution of ration kits and other essential items for COVID and flood affected districts in Bihar and West Bengal
    •      Distribution of masks and other safety items

*The company has not recognized any NPAs since August 31, 2020, in line with the interim order of Hon. Supreme Court. However, the company has identified such accounts as stage 3 and made provisions accordingly   6
**on a fully diluted basis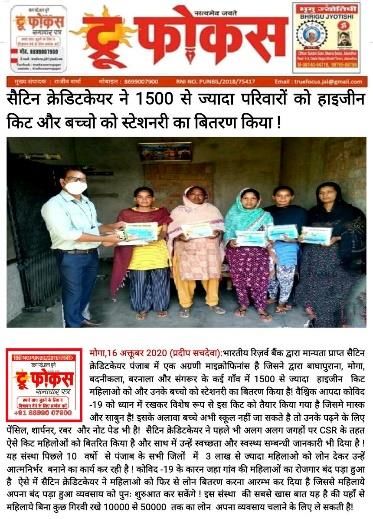
Update on Subsidiaries

                                     Satin Housing Finance Limited

                  SHFL had a profitable quarter despite challenging business environment

                       No restructuring of any loan

                          Cumulative collection efficiency for 9MFY21 stood at 99.3%

                          As of 31st Aug’20, ~20% of clients have availed for the moratorium

                         Amount under moratorium stood at ~21% of the total AUM

                   Monthly disbursement has picked up from FY20 levels

                                                                                               7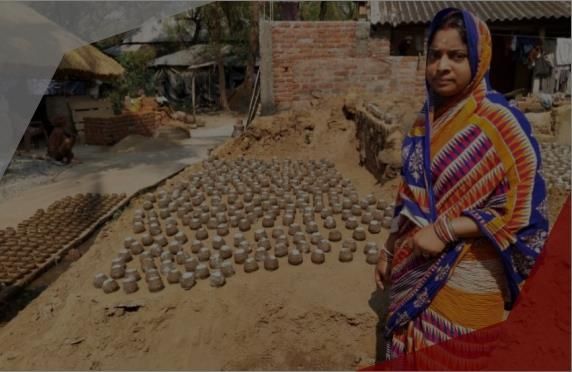
Update on Subsidiaries

           Taraashna Financial Services Limited                                   Satin Finserv Limited

                                                                ✓ ~7% cases were restructured
   ✓ Collection Efficiency for Dec’20 stood at 91%
                                                                ✓ ~3% clients availed complete moratorium
   ✓ Cumulative Collection Efficiency for Q3FY21 stood at 84%
                                                                ✓ Non-paying clients amount to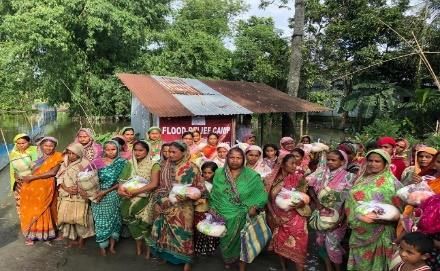
Overview and Key
Performance Highlights
Key Highlights

            Bolstered Capital Position by successfully closing the Rights Issue of Rs. 120 crores in Aug’20 with an overwhelming response
                                                          (Issue was oversubscribed by 123%)

                                                                                  Share of New Disbursement in FY21 as % of Total AUM

   New disbursement made in FY21 (post-COVID) contribute 49% of
                                                                                     Pre-Covid Portfolio
    the total loan portfolio as on 31st Jan’21 with PAR1 at 0.47%                                               49%              51%
                                                                                     Post-Covid Portfolio

                                                                                      Share of Secured Loan Portfolio % in Total AUM

                                                                                                                            8%
    Share of Secured Portfolio (%) increased to ~8% of total AUM as
     on 31st Dec’20, in-line with the company’s stated strategy of                    Secured Portfolio

    moving towards a balanced mix of secured & unsecured lending                      Unsecured Portfolio
                                                                                                                      92%
Business Performance Highlights
India’s leading NBFC-MFI with Assets Under Management (AUM) of Rs. 7,880 crore, having 30.1 lacs clients, 1252 branches, 382 districts and 23 states as on Dec’20.
Implemented cashless disbursement across Percentage of Promoter pledge has
Awarded Certificate of Excellence in gone down from 52.88% in Dec’18 to
Clean Energy Finance, in line with our 100% branches
- 9% of collection via cashless mode, adopted 5.08% on fully diluted basis as on
commitment towards a better tomorrow date
website payment option and UPI auto debit
Satin Housing Finance Ltd (SHFL), AUM of Rs. 200 crore, Standalone credit rating of CARE BBB (Stable). 10 active lenders including refinance facility from NHB. DA of Rs.
4.8 crore during 9MFY21. Equity infusion of Rs. 15 crore during Q3FY21.
Taraashna Financial Services Ltd (TFSL), AUM at Rs. 646 crore, added two new BC partners during 9MFY21.
Satin Finserv Ltd, Satin’s MSME arm, AUM of Rs. 127 crore, Standalone credit rating of CARE BBB- (Stable). SFL has migrated to our in-house software now.
11Corporate Overview Standalone – 9MFY21
Rs. 2,310 crore 30.3 Lacs 23 1,021
DISBURSEMENT LOAN ACCOUNTS STATES & UT’s
BRANCHES
OUTSTANDING
7.4 Lacs Rs. 6,907 crore Rs. (56 crore)
NO. OF LOANS DISBURSED GROSS LOAN PORTFOLIO PROFIT AFTER TAX
25.31% (1.0%) Rs. 31,000 (5.3%)
CAPITAL ADEQUACY RETURN ON ASSETS AVERAGE TICKET SIZE RETURN ON EQUITY
12
Above Data is for 9MFY21. RoA and RoE are calculated on annualized basisCorporate Overview Consolidated – 9MFY21
Rs. 972 crore 30.1 Lacs 1,252
REVENUES CLIENTS BRANCHES
Rs. 497 crore Rs. 7,880 crore 23
NET INTEREST INCOME GROSS LOAN PORTFOLIO STATES & UT’s
(0.9%) (4.9%) Rs. (52) crore
RETURN ON ASSETS RETURN ON EQUITY PROFIT AFTER TAX
13
Above Data is for 9MFY21. RoA and RoE are calculated on annualized basisWhat makes Satin a
Compelling Investment Story
14What makes Satin a Compelling Investment Story
Leading MFI Player With Differentiated Product Offerings
01 Diversified Geographical Reach
02
03 Technology Prowess
04 Robust Underwriting Processes
05 Well-diversified Liability Profile
06 Ample Liquidity & Positive ALM
07 Strong & Experienced Management Team
08
Successfully Navigated Crisis During Legacy of 30 Years
151. Differentiated Product Offerings
Business Correspondent
SCNL Housing Finance SME
Services
Product features Taraashna Financial Services
MFI(1) Satin Housing Finance Limited(3) Satin Finserv Limited (SFL)(4)
as on Dec’20 Limited(2)
Start Date May’08 (JLG) May’12 Feb’18 Mar’19
Upto Rs. 50,000
Ticket Size Range Upto Rs. 50,000 Rs. 100,000 – 4,000,000 Rs. 100,000 – 100,000,000
(JLG - Microfinance)
Tenure 6 - 24 months 12 - 24 months 24 - 240 months 12 - 120 months
Frequency of Collection Bi-Weekly Bi-Weekly Monthly Monthly/Quarterly
No. of States/UTs 23 7 4 8
No. of Branches 1,018* 202 14 15
AUM (Rs. crore) 6,627(5) 646 200 127
No. of loan accounts 2,859,980 361,338 2,067 1,429
Avg. Ticket Size for Q3FY21 Rs. 36,000** (JLG) Rs. 32,400 Rs. 1,170,000 Rs. 395,000 (Retail)(6)
Notes
(1) As on Dec’20, included MFI Lending (loans under JLG model, IndusInd BC and water & sanitation) and Product Financing (Loans for solar lamps, cycles)
(2) TFSL acquisition is effective Sep 1, 2016
(3) Satin Housing Finance Ltd was incorporated on April 17, 2017
(4) SFL was incorporated on August 10, 2018
(5) SCNL also has MSME portfolio of Rs. 280 crore other than MFI portfolio
(6) Average Ticket Size of Retail Financing is 3.95 lacs. Overall, the average ticket size of SFL is Rs. 8.87 lacs
*As of Q3FY21, there were 1,018 branches with Microfinance operations & 27 branches with MSME operations. Out of the 27 MSME branches, 24 of them also had microfinance operations & 3 were unique
16
**Focus on repeat clients with established credit history… With opportunities to leverage our client reach
Satin finances product purchase of solar lamps, bicycles etc. and grants loan for safe water and
sanitation facilities
Financing ~Rs. 100 crore during FY20, Rs. ~14 crore during 9M FY21
Product Financing Benefits
Bicycle Loan Solar Products ▪ Enhances the productivity and income
generating potential of its clients
3,325 loans disbursed 3,599 loans disbursed
▪ Enables company to leverage its rural
outreach
Home Appliances Consumer Durables
▪ Capitalizes on company’s existing network and
775 loans disbursed 4,886 loans disbursed client base
▪ No incremental cost, thus the income directly
Water & Sanitation adds up to the bottom line
4,213 loans disbursed
Note: No. of loans disbursed during 9MFY21 172. Diversified Geographical Presence
…serving ~31 lacs clients across India
59% 30 Lacs+ ~34 lacs
Clients with Satin as Only
No. of Active Clients No. of Loan Accounts
Lender*
382 ~84,000
No. of Districts No. of Villages
73 2.5 lacs
No. of Regional Offices No. of Centres
34% 7,597 11,411
No. of First Cycle Clients* No. of Loan Officers No. of Employees
On Consolidated basis
The pictorial representation of Map of India does not purport to be the Political Map of India *at the time of disbursement, data is for JLG Standalone only. Focus on existing clients with established credit history
18… Leading to increasing footprints
% of total GLP GLP (Rs. crore)
States
FY16 Q3FY21 Q3FY21
Uttar Pradesh 40.9% 21.3% 1,675
Bihar 17.7% 15.7% 1,236
Punjab 12.7% 8.9% 699
2. Reducing exposure to traditional regions Madhya Pradesh 15.5% 8.5% 669
Uttarakhand 3.2% 1.4% 113
Maharashtra 1.6% 1.0% 82
Total 91.7% 56.8% 4,474
% of total GLP GLP (Rs. crore)
States
FY16 Q3FY21 Q3FY21
West Bengal 0.1% 6.8% 536
1. Increasing exposure to Newer
Rajasthan 2.3% 5.2% 410
Delhi & NCR 2.0% 4.0% 317
Haryana 1.9% 3.7% 295
% of total GLP GLP (Rs.
Gujarat 0.5% 3.7% 291 States crore)
Jharkhand 0.7% 2.2% 173 FY16 Q3FY21 Q3FY21
Chhattisgarh 0.6% 1.2% 96 Assam 0.0% 5.2% 409
states
J&K 0.1% 0.1% 6
Orrisa 0.0% 4.1% 323
Total 8.2% 27.0% 2,125
Tamil Nadu 0.0% 4.0% 312
Karnataka 0.0% 1.8% 141
Tripura 0.0% 0.9% 72
3. Foraying into New Geographies
Pondicherry 0.0% 0.1% 10
Himachal Pradesh 0.0% 0.1% 7
Meghalaya 0.0% 0.1% 5
Sikkim 0.0% 0.0% 1
Total 0.0% 16.3% 1,281
19… And de-risking geographical concentration
To have become a PAN India Player
Share of Top 4 States Reduced from 77% to 54% Limiting Exposure per district
Average exposure per district % % of Top 10 Districts to AUM
77.3 -30%
10.1 67.7
56.3 58.6
10.2 54.3 0.45
19.2 21
12.9 8.4 9.6
8.9 0.35 19
8.8 9.3 8.5
18.1 18.3 15 15
16.5 0.28 0.26 14
17.5 15.7 0.25
29.9 26.3 23.2
21.6 21.3
FY17 FY18 FY19 FY20 9MFY21 FY17 FY18 FY19 FY20 9MFY21
FY17 FY18 FY19 FY20 9MFY21
UP Bihar MP Punjab Particulars FY17 FY18 FY19 FY20 9MFY21
No. of Districts - JLG 236 306 359 397 382
Number of States contributing more than 1% to Total AUM % of Districts with 2% 2.1% 1.0% 0.6% 0.5% 0.3%
16 17
% of Top 10 Districts to Net-worth
188
10 120
7 88 79 74
2015 2017 2019 2020 FY17 FY18 FY19 FY20 9MFY21
Data on consolidated basis 203. A Difference Powered by Technological Prowess & Processes…
Turn Around Time of Customer Acquisition
Game Changing Help us to be ahead of the curve to better
to disbursement journey
Digital Transformation Technology respond to the ever-changing business
Reduced from 18 days to a few
(LMS) scenarios
minutes
LMS Technology Footprint Gold Standard Information Security
▪ Online real-time system ▪ BC subsidiary also using the same ▪ Our company is the first MFI to be
▪ Last Mile Connectivity on Tabs technology & leveraging the same certified with ISO 27001:2013, which
benefits affirms the prevalence of robust ISMS
▪ Greener (paperless environment) specifying the requirements for
▪ Centralized Shared Service centre
▪ Event based mapping of Geo Location establishing, implementing,
introduced within SATIN; to create
& Tracking Penetration maintaining and continually improving
unified support model across Business
ISMS within the organisation
▪ Instant Bank Account Verification Reporting / End User Applications
Support & Managed Infrastructure ▪ This certification indicates SATIN has
▪ Core Accounting & Financial System integrated a robust ISMS in its business
▪ Developed in-house software for
▪ Cashless Disbursement @100% subsidiaries like Housing & MSME too
processes & exemplifies that
branches information security and client
▪ In-house Customer Service App confidentiality are part of the
▪ Real-time Dashboards
cornerstones of SATIN’s strategic
▪ Real-time CB Checks objectives
▪ Features enabling brand recall
value (SMS, OTP, QR Code)
21… Leading to Operating Efficiency & Scalability
New initiatives… ...leading to improved processes
Centralized processes Reduced TAT
KYC Compliance & Real-
time Credit Bureau checks Real-time Decision Making
Auto bank reconciliation Faster Book Closing
using API
Enhanced Productivity
Penny drop verification
Cash less disbursement Improved Data
& collection Quality
Geotagging Brand image
224. Robust Underwriting & Full-fledged in-house Internal Audit
Robust Underwriting Full-fledged in-house Internal Audit
Real-time Credit Bureau checks
to track loan history of the prospective clients, also created
own Credit Bureau scorecard for individual clients for better
screening
96 Feedback based
Zonal Auditors & Compliance Audit
Regional Auditors
Rotating Responsibility
Shuffling CSOs every 9 months and transferring every 18
months to reduce human biases. Risk Officers visit clients
regularly
100% Digital 872 Audits
Centralized Share Services on Audit Reports and Findings completed in Q3FY21
KYC verification, IVR, TVR, ensuring uniform processes
Geo-tagging
of 100% branches and centers and 89% clients’ houses Quarterly Audit
Regional Office, Branch & Social
18 man-days
Performance Management field audit per auditor per month
Account Verification & Cashless Disbursement
via penny drop verification along with strict KYC compliance,
also cashless disbursement eliminates the cash handling risk
235. We have a well-diversified Liability Profile…
… insulated from Capital Market Turbulence
Product-wise Dec’20 Large Lender Base
3% 61 Active Lenders
0%
17% Top 10 Lending Partners % Share as on 31st Dec’20
Term Loan
NABARD 14%
NCD
53% Buyout Indian Bank 9%
Commercial paper State Bank of India 8%
27%
ECB
Bank of Baroda 7%
Blue Orchard Microfinance Fund 5%
Lender-wise Dec’20
IDFC First Bank 4%
1%
17% AAV S.A.R.L. 4%
SIDBI 4%
Banks
NBFC Standard Chartered Bank 4%
19% 57%
Domestic Financial Institution HSBC 3%
Overseas Fund
6% Domestic Fund Total of Top 10 lenders 61%
246. Strong Capitalization with Ample Liquidity
Healthy CRAR to Support Growth Opportunities Benefit of Positive ALM Continues
26.3
30.5% 23.9
28.5% 21.5 22.3 22.1
25.3%
21.2% 15.5
13.5
11.7
8.5 9.0
FY18 FY19 FY20 9MFY21 FY17 FY18 FY19 FY20 9MFY21
Avg. maturity of Assets Avg. maturity of Liabilities
Static ALM as on 31st Dec’20 (Rs. Crore) Jan-21 Feb-21 Mar-21 Apr-21 May-21 Jun-21 Total
Inflows
Liquidity at the beginning of month* 1,831 1,717 1,824 1,917 2,009 2,196 1,831
Principal - Loan portfolio 227 236 273 258 252 263 1,508
Interest - Loan portfolio 81 87 80 69 69 469
82
Total (A) 2,140 2,034 2,184 2,256 2,330 2,528 3,808
Outflows
Principal repayments 386 137 221 210 111 184 1,248
Interest repayments 37 72 46 36 24 63 280
Total (B) 423 209 267 246 134 247 1,527
Cumulative Mismatch (A-B) 1,717 1,824 1,917 2,009 2,196 2,281 2,281
25
*Excluding margin money deposits Rs 326 crore lien with Lenders and undrawn sanction in hand Rs 881 crore as on Dec’20; Principal repayments of only on-book portfolio are factored in the cashflows… With stable asset quality
On-book Provisions & NNPA (Rs. crore) On- book GNPA, Provisions & NNPA (%)
113 132 14.9%
151 513 5.0%
177 305 Provisions Provisions
147
156 NNPA NNPA
5.0%
208 9.9% 0.1% 4.0%
3.3%
-5 1.7%
4.9%
-34 -45 2.3% 3.4%
-0.1%
Mar-20 Jun-20 Sep-20 Dec-20 Mar-17 Mar-18 Mar-19 Mar-20
On-book Provisions & NNPA (%) Provision Coverage Ratio (%)
9.6%
130% 134%
Provisions
5.7% 1.5% NNPA
103%
3.3% 2.9%
2.4%
5.7% 77%
3.4% 3.2% 3.9% 3.9% 60% 59% 60%
-0.1% -0.8% -1.0%
-4.2%
Mar-20 Jun-20 Sep-20 Dec-20 Dec-20*
Mar-17 Mar-18 Mar-19 Mar-20 Jun-20 Sep-20 Dec-20
*The company has not recognized any NPAs since August 31, 2020, in line with the interim order of Hon.
Supreme Court. However, the company has identified such accounts as stage 3 and made provisions 26
accordingly. Without Assam at 0.5%. Proforma GNPA Stands at 9.6% in Dec’20 without Assam at 7.6%Diversification with allied product offerings
Taraashna Financial Services Ltd - TFSL Satin Housing Finance Ltd (SHFL) Satin Finserv Limited (SFL)
» Acting as a business correspondent, TFSL provides » 100% retail book comprising of: » Incorporated in Aug’18, got license from RBI to
credit to clients in rural and semi-urban areas on start business in Jan’19
behalf of partner banks and NBFCs » Affordable home loans – 82%
» Standalone credit rating of CARE BBB- (Stable)
» The cashless disbursement percentage has » Loan against property – 18%
reached ~97% of TFSL’s total disbursement for » Gross Loan Portfolio of Rs 127 crore
Dec’20; 2% collection is through cashless mode » Excellent portfolio quality since inception,
Collection Efficiency of >99% during 9MFY21 » CRAR for Q3FY21 is 85.5%
» TFSL has a low-risk business model which is highly
capital efficient » Mainly caters to clients belonging to Middle and » Total equity stands at Rs 102.5 crore
Low-Income Groups in peripherals of Tier II and
» AUM stood at Rs 646 crore, with presence across below cities » Business focus on secured retail MSME lending,
7 states wholesale lending to small NBFC MFI and others
» CRAR of 97.3% and gearing of 1.4x. Total equity
» The Company operates through 202 branches, stands at Rs 95 crore » 15 Branches across 8 states with 1,429 active loan
and has more than 3.6 lacs clients clients
» AUM Rs 200 crore with DA of Rs 5 crore
» SFL has migrated to in-house software
» Profitable quarter despite challenging business
environment
» Standalone rating of BBB from CARE
» 10 active lenders including NHB refinance
27Successfully Navigated Crisis During Legacy of 30 Years
Learnings from Demonetization De-risking Geographic Reduction in Top 4 State
District Diversification
❑ Implementation of best-in-class technology Concentration (No. of States) Contribution
• Reduced TAT + 7 states
• Real-time data +69%
• Enhanced Productivity 23 382
81%
• Improved monitoring and control
16 54%
❑ Diversifying Geographical Presence 226
• Increasing exposure to Newer states
• 96.6% of Districts withKey Financial & Operational
MetricesKey Operation Metrics
Districts, States and Branches Employees & Loan Officers
1,2521
1,383 8,152
1,163 6,382 6,296 7,5972
767 995
23 23 4,481 13,005
22 11,831
1,495 11,4413
18 1,325
16 9,004 1,493
6,910
1,344
383 370
340 1,109
302 10,419 11,148
235 9,633
7,653
5,801
FY17 FY18 FY19 FY20 9MFY21 FY17 FY18 FY19 FY20 9MFY21
Districts States Branches Satin Employees TFSL Employees Loan Officers
Clients (lacs) Gross Loan Portfolio (Rs. crore)
Satin TFSL
Satin TFSL
35.5 34.6
4.1 30.1
28.2 3.9
26.5 8,174 7,8803
3.6 7,068
2.3 3.5 704 646
5,757 604
31.5 30.8 670
26.5 4,067
22.9 24.0 450
6,374 7,220 6,907
5,085
3,617
FY17 FY18 FY19 FY20 9MFY21
FY17 FY18 FY19 FY20 9MFY21
Note: (1) Data on Consolidated basis. On a standalone basis, the number of branches were 1,021; (2) Data on a consolidated basis. On a standalone basis the number of loan officers were 6,287; (3) Consolidated figures includes Satin 30
Housing Finance Limited and Satin Finserv Ltd. as well.Key Consolidated Financials
Gross Income (Rs. crore) Cost to Income Ratio (%)
1,445 1,503
67.6%
57.0%
53.4% 52.5%
49.3%
341 321
375
Q3FY20 Q2FY21 Q3FY21 FY19 FY20 Q3FY20 Q2FY21 Q3FY21 FY19 FY20
NII and PAT (Rs. crore) Opex to GLP (%)
914
NII 803
6.7%
6.2% 6.3%
PAT 5.3% 5.6%
227 185 201
162 155
47 16
-80
Q3FY20 Q2FY21 Q3FY21 FY19 FY20 Q3FY20 Q2FY21 Q3FY21 FY19 FY20
31Key Standalone Financials
Gross Income (Rs. crore) Cost to Income Ratio (%)
1,373 1,401
65.2%
54.7%
50.8% 49.7%
46.2%
315 294
347
Q3FY20 Q2FY21 Q3FY21 FY19 FY20 Q3FY20 Q2FY21 Q3FY21 FY19 FY20
NII and PAT (Rs. crore) Opex to GLP (%)
824 6.5%
NII 734 5.9% 6.0%
5.1% 5.3%
PAT
203 164 195
140 156
48 13
-82
Q3FY20 Q2FY21 Q3FY21 FY19 FY20 Q3FY20 Q2FY21 Q3FY21 FY19 FY20
32Financial & Operational Details
(Consolidated)Annexure – Business Details – Consolidated
Particulars Q3FY21 Q3FY20 YoY% Q2FY21 QoQ%
AUM (Rs. crore) 7,880 7,284 8.2% 7,667 2.8%
On-Book JLG AUM* 5,333 4,092 4,572
Securitization 28 34 39
Assignment 1,216 1,776 1,699
Business Correspondence 362 522 473
TFSL - Business Correspondence 646 646 639
(1)
SHFL - Housing Finance 195 138 164
SFL 127 109 120
AUM Mix (Rs. crore) 7,880 7,284 8.2% 7,667 2.8%
MFI Lending 6,253 5,600 5,959
Product Financing 11 18 15
MSME 280 249 297
Business Correspondence - IndusInd Bank 362 522 473
TFSL - Business Correspondence 646 646 639
SHFL - Housing Finance 2001 138 164
SFL 127 109 120
No. of Branches 1,252 1,354 -7.5% 1,255 -0.2%
SCNL 1,021 1,110 1,025
TFSL 202 213 201
SHFL 14 13 14
SFL 15 18 15
Note:
* Includes securitization, differences due to rounding off
1) SHFL portfolio also includes Assigned portfolio of 5 crore
34Annexure – P&L Statement – Consolidated
Particulars (Rs. crore) 9MFY21 9MFY20 YoY% Q3FY21 Q3FY20 YoY% Q2FY21 QoQ %
Revenue
Interest and Fee Income 780 737 270 250 251
DA Income 58 151 0 56 44
Treasury Income 58 95 18 32 20
BC Fees 57 93 24 31 21
Other Operating Income 19 19 8 6 3
Total Revenue 972 1,094 -11.2% 321 375 -14.4% 341 -5.8%
Expenses
Finance Cost 475 450 159 148 156
Employee Benefit Expenses 243 261 82 86 82
Credit Cost & FLDG for BC 245 96 159 61 53
Other Expenses 61 81 24 22 20
Depreciation and amortization expense 11 12 3 4 4
Total Expenses 1,035 901 14.9% 427 321 314
Profit Before Tax -63 194 - -106 54 - 26 -
Tax expense -11 52 -26 7 11
Profit after Tax -52 142 - -80 47 - 16 -
Other comprehensive income net of taxes -54 11 -47 -1 -12
Total Comprehensive Income -105 153 - -127 46 - 4 -
35Financial Details (Standalone)
Annexure - Financial Performance – Standalone
Particulars (Rs. crore)                                                                 9MFY21                       Q3FY21                        Q3FY20                          Q2FY21    FY20    FY19

Gross yield (1)                                                                           16.9%                        17.2%                        21.7%                           18.1%   20.6%   24.0%

Financial Cost Ratio(2)                                                                     8.7%                         9.0%                         9.0%                           8.7%    8.5%   11.1%

Net Interest Margin(3)                                                                      8.3%                         8.2%                       12.7%                            9.4%   12.1%   12.8%

Operating Expense ratio(4)                                                                  5.0%                         5.3%                         5.9%                           5.1%    6.0%    6.5%

Loan Loss Ratio(5)                                                                          4.6%                         9.3%                         3.4%                           3.0%    3.0%    1.0%

RoA(6)                                                                                     -1.0%                        -4.3%                         2.9%                           0.7%    2.3%    3.1%

RoE(8)                                                                                     -5.3%                       -22.8%                       13.8%                            3.5%   12.0%   19.1%

Leverage (Total Debt(7) / Total Net Worth)                                                  4.4x                         4.4x                          3.4x                          3.6x    3.7x    4.6x

Cost to Income Ratio                                                                      60.7%                        65.2%                        46.2%                           54.7%   49.7%   50.8%

Asset Quality (on-book)                                                                 9MFY21                       Q3FY21                        Q3FY20                          Q2FY21    FY20    FY19

GNPA %                                                                                        9.6                          9.6                          4.3                           2.9     3.3     4.0

ECL as % of AUM                                                                               5.7                          5.7                          3.3                           3.9     3.4     2.3

1.   Gross Yield represents the ratio of total Income in the relevant period to the average AUM
2.   Financial Cost Ratio represents the ratio of interest Expense in the relevant period to the Average AUM
3.   Net Interest Margin represents the difference between the Gross Yield and the Financial Cost Ratio
4.   Operating Expenses Ratio represents the ratio of the Operating Expenses (expenses including depreciation but excluding Credit Cost and interest Expense) to the Average AUM
5.   Loan Loss Ratio represents the ratio of credit cost (including FLDG on BC) to the Average AUM
6.   RoA is annualized and represents ratio of PAT to the Average Total Assets
7.   Total Debt includes Securitization and preference shares considered as debt in accordance of IndAS
8.   RoE is annualized and represents PAT(Post Preference Dividend) to the average equity (i.e., net worth excluding preference share capital)

                                                                                                                                                                                                            37
Annexure - P&L Statement– Standalone
Particulars (Rs. crore) 9MFY21 9MFY20 YoY% Q3FY21 Q3FY20 YoY% Q2FY21 QoQ %
Revenue
Interest and Fee Income 748 719 259 242 241
DA Income 58 151 - 56 44
Treasury Income 54 90 17 31 18
BC Income 20 48 10 15 7
Other Operating Income 18 16 8 4 5
Total Revenue 898 1,025 -12.5% 294 347 -15.5% 315 -6.6%
Expenses
Finance Cost 460 442 154 144 151
Employee Benefit Expenses 205 221 68 72 70
Credit Cost & FLDG for BC 241 86 158 54 51
Other Expenses 52 70 20 18 17
Depreciation and amortization expense 9 11 3 3 3
Total Expenses 967 829 16.6% 403 292 37.8% 292 38.0%
Profit Before Tax -69 196 - -109 55 - 23 -
Tax expense -13 52 -27 7 10
Profit After Tax -56 144 - -82 48 - 13 -
Other comprehensive income net of taxes -53 11 -47 -1 -12
Total Comprehensive Income -110 155 - -129 47 - 1 -
38Financial Details (Subsidiaries)
Annexure - P&L Statement – TFSL

 Particulars (Rs. crore)                   Q3FY21    Q3FY20    Q2FY21    FY20   FY19

 Revenue

 Total Revenue                               13.1      17.2      18.2    69.8   68.3

 Expenses

 Finance Cost                                 1.2       0.9       1.1     3.2    2.5

 Employee Benefit Expenses                    9.2       9.7       8.9    38.3   35.3

 Credit Cost                                  -0.3      6.1       0.5    13.4    5.7

 Other Expenses                               2.4       2.5       2.7    14.4   11.1

 Depreciation and amortization expense        0.4       0.5       0.4     1.7    1.1

 Total Expenses                              12.9      19.6      13.6    71.0   55.7

 Profit Before Tax                            0.2       -2.5      4.6    -1.2   12.6

 Tax expense                                  0.1       -0.5      1.1    -0.2    4.1

 Profit After Tax                             0.1       -2.0      3.5    -1.0    8.4

 Other comprehensive income net of taxes         -         -      -0.2    0.3    0.1

 Total Comprehensive Income                   0.1       -2.0      3.3    -0.7    8.5

                                                                                       40
Annexure - P&L Statement – SHFL
Particulars (Rs. crore) Q3FY21 Q3FY20 Q2FY21 FY20 FY19
Revenue
Interest and Fee Income 6.6 4.6 5.6 17.1 4.5
Treasury Income 0.0 0.5 0.3 1.6 1.0
Other income 0.6 1.1 0.3 2.3 1.6
Total Revenue 7.2 6.2 6.2 21.0 7.1
Expenses
Finance cost 3.6 2.4 3.1 8.3 1.1
Employee benefit expenses 2.7 2.3 2.3 9.7 4.8
Credit Cost -1.6 0.1 1.8 1.2 0.3
Other expenses 0.9 0.8 0.5 2.5 2.3
Depreciation and amortization expenses 0.1 0.1 0.1 0.5 0.1
Total Expenses 5.6 5.7 7.8 22.2 8.6
Profit Before Tax 1.6 0.5 -1.6 -1.3 -1.5
Tax expense 0.4 0.2 -0.4 -0.3 -0.3
Profit After Tax 1.2 0.3 -1.3 -1.0 -1.2
Other comprehensive income - - - - -
Total Comprehensive Income 1.2 0.3 -1.3 -1.0 -1.2
41Annexure - P&L Statement – SFL
Particulars (Rs. crore) Q3FY21 Q3FY20 Q2FY21 FY20
Revenue
Interest and Fee Income 5.93 4.48 5.57 13.59
Treasury Income 0.08 0.06 0.14 0.24
Other income 0.14 0.06 0.31 0.18
Total Revenue 6.15 4.60 6.02 14.02
Expenses
Finance cost 1.13 0.48 1.03 1.76
Employee benefit expenses 1.79 1.69 1.61 6.67
Credit Cost 0.91 0.70 1.83 1.46
Other expenses 0.93 0.84 0.82 3.13
Depreciation and amortization expenses 0.08 0.02 0.05 0.11
Total Expenses 4.84 3.73 5.33 13.14
Profit Before Tax 1.31 0.87 0.68 0.88
Tax expense (DTA) 0.33 0.15 0.17 0.24
Profit After Tax 0.98 0.71 0.51 0.65
Other comprehensive income - 0.02 0.02 -
Total Comprehensive Income 0.98 0.73 0.53 0.65
42Company Background
Key milestones
    Business Timeline

                           2016                                           2017                                            2018                                           2019                                           2020

                                                                                                                                                             Received NBFC license for
                                                                                                              SHFL commenced lending in
                Started MSME Lending in                         Reaches 27.1 lacs active                                                                     Satin Finserv Ltd for MSME                        Received the Award of
                                                                                                               Feb18; BC agreement with
                 FY17; Acquired TFSL in                      clients and AUM of Rs. 4,882                                                                   business; reached AUM of 1
                                                                                                             IndusInd Bank, reached AUM                                                                        “Great Place to Work”
                         Sep’16                                      crore by Dec’17                                                                        Bn USD; TFSL became wholly
                                                                                                              of Rs. 5,757 crore by Mar’18
                                                                                                                                                                  owned subsidiary

                           2015                                           2014                                            2013                                           2012                                           2010

                                                                                                            Reaches 4.9 lacs active clients
              Listing on NSE, BSE and CSE(2);                                                                                                                 Starts SHG bank linkage
                                                              Reaches 8 lacs active clients                  & AUM of ~Rs. 580 crore as                                                                    Reaches 1.7 lacs active clients
                                                                                                                                                               program in Rewa, MP;
               Received top MFI grading of                   and AUM of Rs.1,056 crore as                   on Mar’13; Converts to NBFC-                                                                     and gross AUM of Rs.169
                                                                                                                                                            Receives 83% in microfinance
                          MFI 1                                      on Mar’14;                             MFI in Nov’13; Received ‘MFI                                                                       crore as on Mar’10
                                                                                                                                                                     COCA audit
                                                                                                                  2+’rating by CARE

                           1990                                           1996                                            1998                                           2008                                           2009

                                                                                                                                                                                                             JLG business shows strong
                Date of inception of Satin-                    IPO and listing on DSE, JSE                         Registers as NBFC                          Started JLG Model in May
                                                                                                                                                                                                               asset quality and large
                    October 16, 1990                                   and LSE(1)                                    with the RBI                                       2008
                                                                                                                                                                                                                potential to scale up

Note: 1. Regional Stock Exchanges (DSE – Delhi Stock Exchange, JSE – Jaipur Stock Exchange, LSE- Ludhiana Stock Exchange); (2) BSE - BSE Limited, NSE - National Stock Exchange of India Limited, CSE - The Calcutta Stock Exchange Limited

                                                                                                                                                                                                                                              44
Key milestones
Fund Raising Timeline
2015 2016 2017 2018 2019/20
▪ Raised Rs. 41.5 crore ▪ Raised Rs. 250 crore ▪ In Apr’17, raised $10 ▪ Pref. Allotment: ▪ Exit of MV Mauritius
from SBI FMO(3) via QIP in Oct’16; mn from ADB(4) ; Equity funding by
(including warrants); Exit of DMP in Jul'16 Investment of Rs. 35 NMI (Rs. 20 crore), ▪ Raised Rs. 120 crore
Rs.37.9 crore infused and ShoreCap in crore by IDFC First and Kora Cap (Rs. 80 by Rights Issue
by Promoter Group Aug’16 Bank (then Capital crore); Promoter
First); Raised Rs. 150 invested via FCW (Rs.
crore via QIP in 60 crore), IndusInd
Oct’17 invested Rs. 45 crore
via OCCRPS
2013 2012 2011 2010 2009 2008
▪ Raised Rs. 30 crore ▪ Raised floating rate ▪ Raised Rs. 18 crore ▪ Raised Rs. 2.5 crore ▪ Raised Rs. 1.9 crore ▪ First private equity
from DMP, ShoreCap long term unsecured from Danish Micro from Lok Capital in from Lok Capital investment
and MV Mauritius Tier II debt in Jul’14; Finance Partners K/S Nov’10 and Rs. 21.8
Ltd; Rs.11 crore Raised Rs. 28.4 crore (DMP) in Feb’11 crore from ShoreCap ▪ Raised Rs. 4.87 crore
infused by Promoter of equity from NMI II in Dec’10; Rs. 7.7 from Lok Capital; Rs.
Group; Exit of Lok and $10 mn of debt crore infused by 1 crore infused by
Capital from World Business Promoter Group Promoter Group
Capital as ECB
Note: (3) SBI FMO Emerging Asia Financial Sector Fund Pte. Limited; (4) ADB – Asian Development Bank
45Our Business Model
Formation of
Documentation
Groups
and Paper work MICROFINANCE… & BEYOND
01
06 02 Social impact financing
Follow up
Income Generating of solar lamps,
loans Long Term Loans (LTL)
Loans (IGL) bicycles, water and
Training sanitation facilities etc.
of Groups
05 03
Business
Micro Small & Medium
Centre Meeting 04 Housing Finance Correspondence &
Enterprises (MSME)
and Collection Loan Sanction Digital Lending
Process
Strong client
Visionary Established
relationship
Management track record of Low-risk Diversification Proprietary IT
built on Large marquee Comfortable
backed by delivery lending aimed by product & platform &
transparent institutional liquidity and
Professional through vast at income geography Technology
practices & investor base CRAR
Team branch generation prowess
internal
network
controls
CREATING A NICHE BY BEING A ONE-STOP FINANCIAL SERVICES PROVIDER FOR OUR CUSTOMERS
46… With Customised Products as per Client Needs
Income Generation Loan Long Term Loan Product Financing/Wash
(Prarambh) (Vriddhi) Loan
Ticket Size : Ticket Size : Ticket Size :
Rs. 10,000 – Rs. 30,000 Rs. 30,000 – Rs. 50,000 Rs. 799 – Rs. 17,999
Tenure : 24 months Tenure : 24 months Tenure : 3-18 months
• Household Income: Rural-Rs. 1.25 Lacs & Urban/Semi-Urban- Rs. 2 Lacs
• Outstanding (incl. applied loan):Making a Difference to the Community
Supporting Local Communities Health Check-up Camps SCNL was Appreciation
During COVID-19 Pandemic 5 Free health check-up camps in Assam and awarded an by the local
Odisha appreciation administration
Distributed masks, ration and hygiene kits across
districts in Punjab during COVID pandemic. letter from the and
Reached out to more than 3000 households. District strengthened
Outcome- Appreciation by local administration Collector, connect with
and strengthened connect with clients Dibrugarh clients
(Assam) for
our COVID
relief
initiatives in
the district
Relief Work post Amphan Cyclone- West Bengal
Financial Empowerment ▪ Reached out and provided ration kits to around 5000
Workshops households in the aftermath of the Amphan Cyclone.
Relaunched Financial Empowerment Workshops ▪ Undertook relief work in the most affected 150 villages in
in a different format in the wake of COVD-19 - our operation area.
shorter duration and smaller gathering.
Distributed ration and stationary kits.
Flood & Cyclone Relief Building a
Initiatives Difference
Flood relief camps in West to Make a
Bengal, Assam and Bihar
Difference
48Awards and Accolades
▪ Mr. HP Singh, CMD, was conferred the ‘Golden Globe Tiger Awards’ at a virtual awards ceremony in Malaysia
▪ Mr. HP Singh received the ‘Exemplary Leader’ Award
▪ Mr. HP Singh received Business Leader of the Year Award in NBFC Sector at World HRD Congress by ET Now
November 2018 December 2018 January 2019 July 2019
Got sA social rating Won the “SKOCH Award” Received “C1" grade in Code of Moved up in
from Microfinanza for Digital Transformation Conduct Assessment from ICRA “Fortune The Next 500”
July 2019 September 2019 November 2019 February 2020
Got 1st Prize in “Outstanding Contribution to Water and Awarded “Company with Great Won “National Best Employer Brand”
Customer Service Index by MFIN Sanitation Lending” from Sa-Dhan and Manager” “Dream Companies to Work For”
Water.org
49Contact Information
Company (Investors & Media) :
Ms. Aditi Singh
Head – Investor Relations & Corporate Communication
E: aditi.singh@satincreditcare.com
T: +91 124 4715 400 (Ext – 5304)
www.satincreditcare.comYou can also read