Q2 2021 Investor Presentation - Grocery Centered. Community Focused - Phillips Edison
←
→
Page content transcription
If your browser does not render page correctly, please read the page content below
Q2 2021 Investor Presentation
         Grocery Centered.
        Community Focused.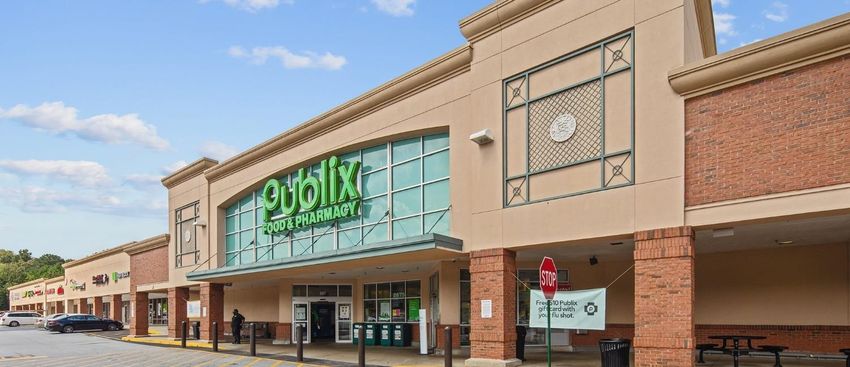
Disclaimer / Forward-Looking Disclosure
     Certain statements contained in this presentation of Phillips Edison & Company, Inc. (the “Company”) other than
     historical facts may be considered forward-looking statements within the meaning of Section 27A of the Securities
     Act of 1933, as amended, and Section 21E of the Securities Exchange Act of 1934, as amended. The Company intends
     for all such forward-looking statements to be covered by the applicable safe harbor provisions for forward-looking
     statements contained in those acts. Such forward-looking statements can generally be identified by the Company’s
     use of forward-looking terminology such as “may,” “will,” “expect,” “intend,” “anticipate,” “estimate,” “believe,”
     “continue,” “seek,” “objective,” “goal,” “strategy,” “plan,” “focus,” “priority,” “should,” “could,” “potential,”
     “possible,” “look forward,” “optimistic,” or other similar words. Readers are cautioned not to place undue reliance
     on these forward-looking statements, which speak only as of the date this report is filed with the U.S. Securities and
     Exchange Commission (“SEC”). Such statements include, in particular, statements about the Company’s plans,
     strategies, and prospects, and are subject to certain risks and uncertainties, including known and unknown risks,
     which could cause actual results to differ materially from those projected or anticipated. These risks include, without
     limitation, (i) changes in national, regional, or local economic climates; (ii) local market conditions, including an
     oversupply of space in, or a reduction in demand for, properties similar to those in the Company’s portfolio; (iii)
     vacancies, changes in market rental rates, and the need to periodically repair, renovate, and re-let space; (iv)
     changes in interest rates and the availability of permanent mortgage financing; (v) competition from other available
     properties and the attractiveness of properties in the Company’s portfolio to its tenants; (vi) the financial stability of
     tenants, including the ability of tenants to pay rent; (vii) changes in tax, real estate, environmental, and zoning laws;
     (viii) the concentration of the Company’s portfolio in a limited number of industries, geographies, or investments;
     and (ix) any of the other risks included in the Company’s SEC filings. Therefore, such statements are not intended to
     be a guarantee of the Company’s performance in future periods.
     Additional important factors that could cause actual results to differ are described in the filings made from time to
     time by the Company with the SEC and include the risk factors and other risks and uncertainties described in the
     Company’s 2020 Annual Report on Form 10-K, filed with the SEC on March 12, 2021, and the Company’s Quarterly
     Report on Form 10-Q for the quarter ended June 30, 2021, filed on August 5, 2021, in each case as updated from
     time to time in the Company’s periodic and/or current reports filed with the SEC, which are accessible on the SEC’s
     website at www.sec.gov. Except as required by law, the Company does not undertake any obligation to update or
     revise any forward-looking statements contained in this release.

Grocery Centered. Community Focused.                                                                                              2
Nasdaq: PECO
Key Stats as of August 11, 2021

Market Capitalization                                 $3.8B

Total Enterprise Value                                $5.6B

Total Shares Outstanding
(Diluted)
                                                      126.6M shares

Share Price                                           $30.55 per share(1)

Dividend | Yield                                      $1.02 annualized dividend per share | 3.3% yield                                             (1)

Public Float                                          15.4% of TSO (19.55 M shares)

Management Ownership                                  7%

First Day of Trading (Nasdaq)                         July 15, 2021

                                                      Issued 19.55M shares at $28.00 per share generating $547.4M of gross proceeds IPO
IPO Details
                                                      closed July 19, 2021; Overallotment fully exercised July 29, 2021

                                                      The lockup for PECO management, directors, associates, and existing shareholders expires
IPO Lock-Up
                                                      on January 15, 2022(2)

Notes:
1. The share price of PECO’s Common Stock as of market close on Wednesday, August 11, 2021. Dividends are not guaranteed and are determined periodically by the PECO Board of Directors.
2. PECO’s Class B Common Stock will automatically convert into PECO’s Nasdaq-listed Common Stock on January 15, 2022. Shares can be traded into the open market or transferred into a
   brokerage account the following business day, which is Tuesday, January 18, 2022.

Grocery Centered. Community Focused.                                                                                                                                                       3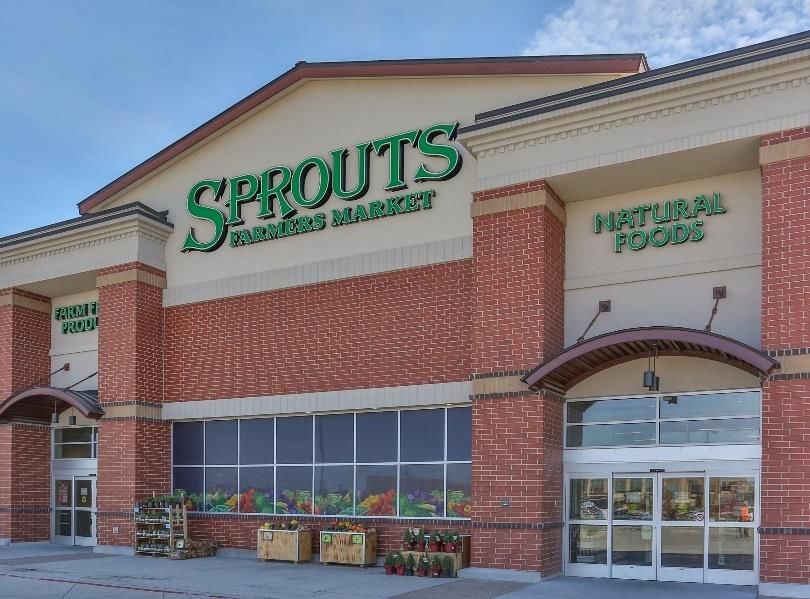
Phillips Edison & Company:
Our Mission Statement

       We Create Great Omni-Channel Grocery-Anchored Shopping
     Experiences and Improve Our Communities One Center at a Time

                                        Grocery Centered.
                                       Community Focused.

    We are an experienced owner and operator exclusively focused on grocery-
  anchored neighborhood shopping centers over our 30-year history; we own and
  manage a portfolio of 294 properties, including 272 wholly-owned properties(1)

Notes:
1. As of June 30, 2021

Grocery Centered. Community Focused.                                               4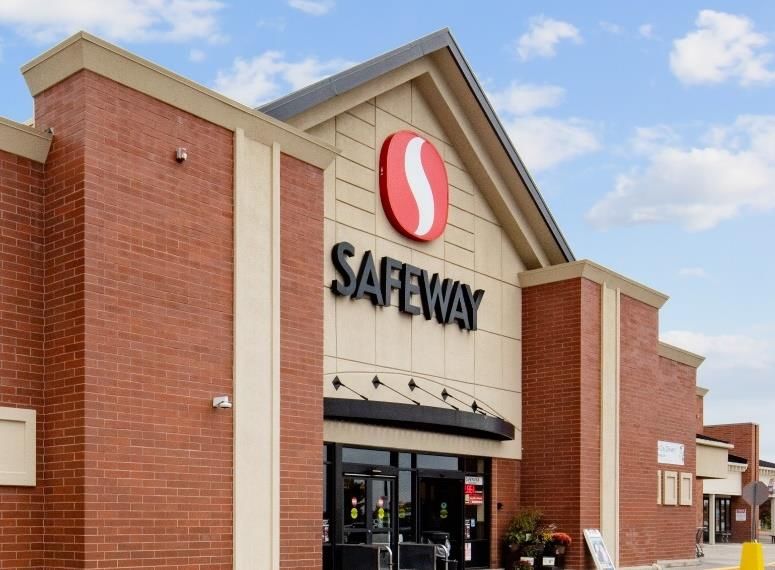
Why Phillips Edison?

                                       DIFFERENTIATED FOCUSED STRATEGY:
                                              GROCERY-ANCHORED
                                        NEIGHBORHOOD SHOPPING CENTERS

                                       INTEGRATED OPERATING PLATFORM

                                             TARGETED PORTFOLIO

                      SUPERIOR FINANCIAL AND OPERATIONAL PERFORMANCE

Grocery Centered. Community Focused.                                      5
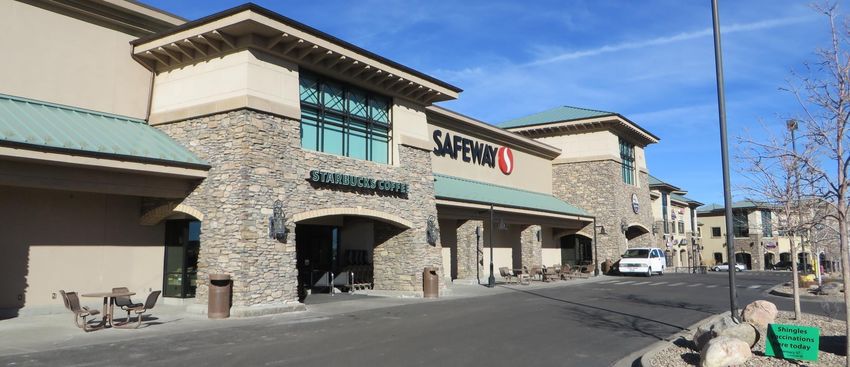
Our Differentiated Strategy
           Exclusively Focused on Omni-Channel Grocery-Anchored Neighborhood Shopping Centers

                   Key Elements of Our Strategy                        A Typical PECO Center: MetroWest Village

                    ✓
                            #1 or #2 Grocery Anchor by Sales
                            (86% of ABR)

                   ✓
                            96% of ABR from Omni-Channel
                            Grocery-Anchored Centers

                            Format Drives Results: Right-Sized
                   ✓        Centers (113k SF Avg.) with
                            Strategic Neighborhood Locations

                            Ecommerce Resistant: 73% ABR
                   ✓        Necessity-Based Goods and
                            Services

                    ✓
                            Last Mile Solution for Necessity-
                            Based and Essential Retailers

                            Targeted Trade Areas Where
                    ✓       Leading Grocers and Small Shop
                            Neighbors Are Successful

                                                    Our Assets Check All the Boxes

Grocery Centered. Community Focused.                                                                              6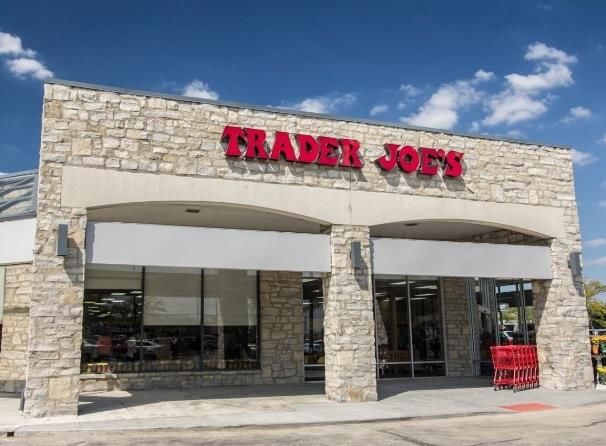
Why Grocery-Anchored Centers?

                     Necessity-Based                                  High Traffic                  Omni-Channel

        • Consumer staple goods and                 • U.S. consumers visit grocery         • PECO centers are a critical
           services that are indispensable             stores 1.6 times per week     (2)     component of our Neighbors’
           for day-to-day living                                                             omni-channel strategies and
                                                                                             provide an attractive last-mile
            ‒ 73% of PECO ABR from                  • Over 19,000 average total trips        solution
                necessity-based goods and              per week to each PECO center (3)
                services retailers (1)                                                       ‒ ~91% of portfolio with Front
                                                                                               Row To GoTM curbside pick-
        • Recession-resistant across                • We believe strong foot traffic           up program   (4)
           multiple cycles                             benefits inline Neighbor sales
                                                       and enhances our ability to           ‒ ~87% of PECO grocers offer
        • Highly resilient with minimal                increase rents                          BOPIS option (Buy Online,
           exposure to distressed retailers;                                                   Pick-Up In Store)(4)
           < 1% of ABR from 15 largest
           retail bankruptcies of 2020 (1)                                                 • Economics of e-grocery delivery
                                                                                             remain unattractive

Notes:
1. % of ABR as of 6/30/2021                        3. During 2020
2. The Food Marketing Institute; data as of 2019   4. Estimate as of 3/31/2021

Grocery Centered. Community Focused.                                                                                           7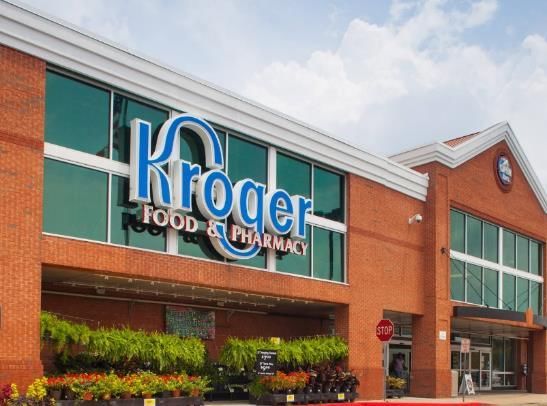
Why Grocery-Anchored Centers?
The Bright Spot in the U.S. Retail Landscape
                                    Grocery Demonstrated Strong Performance Both During COVID-19 and
                                 Throughout Years Before, Despite Upheaval Affecting Other Retail Segments
                                           U.S. Retail Sales – 2020 YoY Growth / (Decline)

                                                                                                                 11%
                                                                                                    6%
                                                                                        3%

                                                                         (5%)

                                             (16%)         (16%)
                               (19%)
           (24%)
          Apparel            Restaurants   Electronics   Department   Furniture /     General   Sports Goods,   Grocery
           Stores             and Bars         and         Stores     Furnishing    Merchandise Hobby, Music,    Stores
                                           Appliance                    Stores        Stores     Book Stores                  Grocery Sales,
                                             Stores
                                                                                                                              Q1 '21 vs. Q1 ’19:
                                                                                                                                    +14%

                                  U.S. Retail Sales – 2015 Through 2019 Total Growth / (Decline)

                                                                                                                   24%
                                                                                         12%          12%
                                                              5%            5%

                                                (5%)
                                 (10%)
               (18%)
           Department          Electronics Sports Goods,    Apparel      General      Furniture /    Grocery    Restaurants
             Stores                and     Hobby, Music,     Stores    Merchandise    Furnishing      Stores     and Bars
                               Appliance    Book Stores                  Stores         Stores
                                 Stores

Source: U.S. Census Bureau

Grocery Centered. Community Focused.                                                                                                               8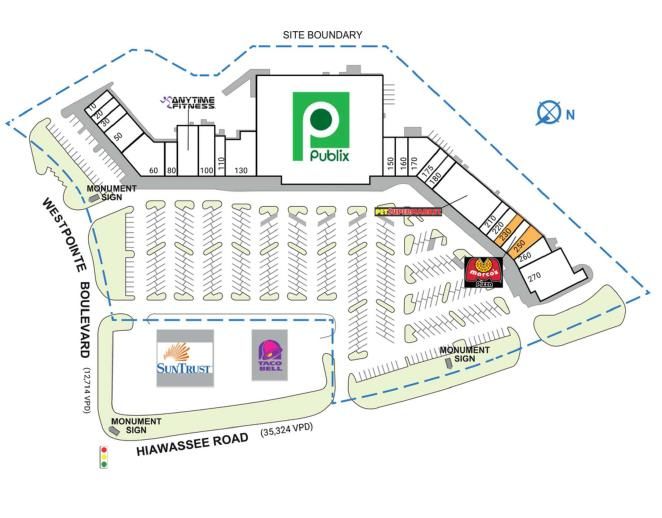
Why Grocery-Anchored Centers?
Strongly Resistant to Ecommerce
        Grocery Home Delivery Is Uneconomical Across a Wide Range of Strategies – Brick & Mortar Remains Critical

             In Store:                                                                    Home Delivery:
            Profitable                                                                Unprofitable for Grocers

               2 – 4%

                                                                                                                                             (2%)

                                                                                                          (5%)

                                                                                                                               (7%)
                                                                                       (8%)

                                                               (11%)

                                         (15%)                                                                               Centralized      Micro-
                                        Grocer                Grocer                Grocer                Third              fulfillment    fulfillment
                                      picks from            picks from            picks from           party picks             center         center
                                         store              dark store            warehouse            from store           (automated)    (automated)

                                              Estimated margin with $7 delivery fee                Estimated margin without fees

Source: Bain & Company
Used with permission from Bain & Company (www.bain.com)

Grocery Centered. Community Focused.                                                                                                                      9
Focus on Targeted Trade Areas
Across a Broad National Footprint
                            Substantial Scale with a Targeted Trade Area Focus; ~50% of ABR from Sun Belt   (1)

                                        294 Properties Across 31 States

                                                                                                     Top 10 Markets (2)

                                                                                                    1.   Atlanta

                                                                                                    2. Chicago

                                                                                                    3. Dallas

                                                                                                    4. Minn. 63
                                                                                                              / St. Paul

                                                                                                    5. Denver

                                                                                                    6. Sacramento

                                                                                                    7. Tampa

                                                                                                    8. Washington, D.C.

                                                                                                    9. Houston

                                                                                                    10. Phoenix

Notes:
1. Within respective format and trade area
2. As of 6/30/2021

Grocery Centered. Community Focused.                                                                                       10
Targeted Trade Areas
In Line with Leading Grocer Demographics
Average 3-Mile Population (000s)
63 61 55
Publix PECO Kroger
Median 3-Mile Household Income ($000s)
$68 $68 $63
PECO Publix Kroger
Source: Synergos Technologies, Inc.
Grocery Centered. Community Focused. 11Why Smaller Centers? Leasing Activity
Concentrated in Smaller Spaces
65% of Leasing Activity for Small Shops < 2,500 SF –
Well Suited for PECO’s Neighborhood and Community Centers
U.S. Strip Center Leasing Activity by Lease Count (2019, New Leases)
65% 20% 8% 7%
2,500 - 5,000 - ≥ 10,000Why Smaller Centers? Strong Releasing
Spreads, High Retention, and Lower Capex
PECO’s Strong NOI Growth is Driven by Strong Lease Renewal Spreads,
Impressive Neighbor Retention Rates, and Low Capex Spending
Defensive Position of • High retention rates of 87% from 2017-2020:
Grocery-Anchored Centers
• Neighbor turnover is low, less downtime
• Retention drives the need for less capex spend
High Retention Rates –
87% Avg. (2017-2020)
• Capex as a % of total NOI is only 20%
Cash Releasing Spreads (2017-2020 Average)
Focus on Optimizing Inline /
Small Shop Tenant Mix
18.5%
15.5%
Low Capex Spend –
20% of NOI Avg. (2018-2020) 12.6% 12.4%
11.3% 11.2%
10.5% 10.8%
9.1%
8.2% 8.0% 8.0%
6.8% 7.1%
High Lease Renewal 6.3%
5.2%
Spreads 4.1%
2.7%
Strong NOI Growth Q2-19 Q3-19 Q4-19 Q1-20 Q2-20 Q3-20 Q4-20 Q1-21 Q2-21
New Renewal
Sources: Company Filings
Grocery Centered. Community Focused. 13Why Smaller Centers?
Limited Exposure to High-Risk Retailer Categories
PECO’s Portfolio Mix Ensures Ecommerce Resiliency and Limited Impact from Store Closures
• Grocery store COVID-19 U.S. Retailer Bankruptcies by Retail Sector (1)
bankruptcies 35%
were only 4% of
COVID-era
retailer
bankruptcies
and were
heavily coastal 25%
market-focused
(Fairway, Kings, 22%
etc.) ~2/3 Quick Service
Restaurants
16%
• PECO had
exposure to 12%
zero bankrupt 9%
9% 9%
grocers during
COVID-19 6%
3% 4% 4%
2% 2% 2% 3%
1%
0%
• Minimal
exposure to Apparel, Restaurants Department Home Fitness Entertainment Health & Grocery Car Rental
worst-hit Shoes, Stores Furnishings Beauty Stores
Accessories
apparel
category (2)
% Bankruptcy by Sector % PECO Exposure to Sector
Sources: JLL, Company Filings
Notes:
1. Excludes sectors with < 2% of COVID-19 bankruptcies; reflects % of major bankruptcies since mid-March 2020; as of 5/3/2021
2. % of ABR as of 6/30/2021
Grocery Centered. Community Focused. 14Why Retailers Succeed in PECO
Shopping Centers
How the PECO Platform Drives Success for Our Neighbors
Scaled for superior service to Neighbors:
✓ ✓
Innovating the physical shopping experience
experienced service providers,
for omni-channel retailers: Front Row to Go,
responsiveness, marketing tools, capital, and
BOPIS, DashComm, data sharing
sophisticated solutions to Neighbor issues
Good value for Neighbors with what we
✓
Recurring customer foot traffic from top
grocers benefits our inline Neighbors ✓ believe are lower average rents and
occupancy costs than alternatives
Optimized merchandise mix with inline
✓ ✓
High level of convenience with centers within
Neighbors offering complementary necessity 3 miles of customers
goods and services
Grocery Centered. Community Focused. 15PECO’s Strong Performance
PECO’s Differentiated Strategy Has Driven Its Strong Financial and Operational Performance
Leased Portfolio Occupancy(1) Same-Center NOI Growth(2)
95.4% 4.6%
94.7% 94.7%
93.9% 3.7% 3.7%
93.2% 3.5%
2017 2018 2019 2020 YTD
2021
2017 2018 2019 2020 Q2 -4.1%
2021
• PECO’s high retention rates and focus on • PECO’s high retention rates and focus on
Neighbors that provide necessity-based increasing occupancy, driving leasing spreads,
goods and services resulted in only a 70-bps executing redevelopment projects, and
decline in occupancy through COVID-19 implementing rent bumps in new leases has driven
strong NOI growth
• Inline occupancy(1): 90.6%
• Same-center NOI was 4.5% higher than the
• Anchor occupancy(1): 96.8% comparable same-center NOI in Q2 2019,
illustrating growth since prior to the onset of the
• Economic occupancy spread(1): 60 bps COVID-19 pandemic
Notes:
1. As of June 30, 2021
2. Please see reconciliation tables in the appendix of this presentation for more details.
Grocery Centered. Community Focused. 16Portfolio Snapshot at June 30, 2021
ABR by Neighbor Composition (1)
96% 94.7% < 7% of ABR
63 63 63
of ABR from 72.5%
Grocery-Anchored Leased Top Neighbor
Occupancy Exposure Necessity-Based
Centers
Goods and Services
35.3% 2.4% $609
63 63 63
Grocer ABR of Grocer Avg. Annual Grocer
Total ABR Health Ratio Sales per sq. ft.
51.3% $21.10 98%
27.5%
63 63 63
Other Retail Stores
Inline ABR of YTD 2021
Total ABR Inline ABR/SF
Collections
Notes:
Portfolio statistics representative of wholly-owned portfolio as of 6/30/2021, unless otherwise noted
1. Includes pro rata share of unconsolidated JVs
Grocery Centered. Community Focused. 17Investment Grade Balance Sheet
Key Highlights (1) Liquidity (2)
• Investment Grade Balance Sheet $153M
• Moody’s: Baa3 (stable); S&P: BBB- (stable)
• Significant post-IPO liquidity position of $642M (2)
• Pro forma post-IPO net debt / adj. EBITDAre of 5.5x $489M
• Pro forma credit profile:
• Approximately 74% of NOI is unencumbered
Cash Revolver capacity
Maturity Ladder ($ Millions) (1)
$750
$500 $500
$250 $475
$300
$240
$240 $202 $210
$6 $56 $66 $30 $28 $0
$0 $20
2021 2022 2023 2024 2025 2026 2027 2028 2029 Thereafter
Secured Property Debt Unsecured Term Loans Line of Credit
Notes:
1. Adjusted Q2 2021 metrics include IPO proceeds and subsequent capital markets activity.
2. Revolver capacity as of June 30, 2021; cash adjusted for IPO proceeds and subsequent capital markets activity
Grocery Centered. Community Focused. 18Key Growth Drivers
1 Re-Lease at Higher Rents
2 Lease-up Vacant Space
3 Built-in Rent Bumps
4 Redevelopment Opportunities (Targeting 9% – 11% Unlevered Yield (1))
5 Robust Acquisition Strategy
6 Platform Scaled for Growth
7 Investment Grade Balance Sheet Positioned for Growth
8 Demographic and Economic Tailwinds
Notes:
1. Range of underwritten incremental unlevered yields on development and redevelopment projects
Grocery Centered. Community Focused. 19Track Record of Successful Acquisitions
Strong Track Record of Acquiring Material Volume of Strategically Aligned Centers
• 280 total acquisitions closed for $4.7B of value from 2012-2018
– Equated to an annual acquisition pace of 40 centers valued at $670M
• More recently, ranked #1 as the largest acquirer of neighborhood centers among
peers from 2018-2020 (1) (2)
Source: JLL
Notes:
1. Includes all third-party acquisitions by all predecessor entities; excludes mergers between our predecessor entities
2. Includes all REITs with > 50% neighborhood and community centers and > $900M market cap
Grocery Centered. Community Focused. 20Large Addressable Market Provides
Opportunity for External Growth
Complete Database of Identified Target Properties
Identified 5,800+ centers across the country that meet PECO’s acquisition criteria
Grocery Centered. Community Focused. 21Format Drives Results:
Generating Superior Risk Adjusted Returns
Higher Going-in Yields
SUPERIOR
Produce Stronger Growth INVESTMENT
RETURNS
Lower Capex Required
Grocery Centered. Community Focused. 22Key Takeaways: Format Drives Results
1 We own small format centers anchored by the #1 or #2 grocer in a given market
Our 294 centers are located in areas close to the end consumer;
2 where America’s leading grocers make money
3 Experienced, cycle-tested management team; owning 7% of the Company
4 Growth driven by our investment grade balance sheet and strong cash flow
Our brick and mortar centers support our Neighbors’ omni-channel strategies
5 and are complementary to Ecommerce (“BOPIS” and last mile delivery)
6 Strong economic environment supported by macro-economic tailwinds
Grocery Centered. Community Focused. 23• SECTION 2
1
APPENDIX
Additional MaterialsExperienced Leadership Team
Deep Management Team with an Average of 29 Years of Experience
Executive Team
Jeff Edison Devin Murphy Robert Myers John Caulfield Tanya Brady
Chairman and President Chief Operating Chief Financial General Counsel
Chief Executive Officer Officer and Secretary
Officer 28 Years of
37 Years of
37 Years of Experience 24 Years of 19 Years of Experience
Experience (8 Years PECO) Experience Experience (8 Years PECO)
(31 Years PECO) (18 Years PECO) (7 Years PECO)
Years of Experience Years of Experience
Name Position / Years at PECO Name Position / Years at PECO
Brian Joseph Portfolio
Finance 27 / 2 24 / 17
Gibson Schlosser Management
Cherilyn Chief Marketing Keith
36 / 8 Chief HR Officer 27 / 9
Megill Officer Rummer
Senior Vice Presidents
David Kevin Chief Information
Acquisitions 22 / 11 35 / 1
Wik McCann Officer
Eric Property Ron
30 / 20 Leasing 22 / 12
Richter Management Meyers
Jennifer Chief Accounting Tony
24 / 7 Construction 26 / 8
Robison Officer Haslinger
Joseph
Tax 32 / 3
Hoffmann
Grocery Centered. Community Focused. 25Corporate Governance
Experienced Board of Directors Governance Highlights
Jeff Edison • Co-founded Phillips Edison & Company in 1991
✓ Seasoned 10+ year SEC filer with a
Chairman • Previous roles at NationsBank’s South Charles Realty,
Morgan Stanley, and Taubman Centers well-established corporate governance
structure
Leslie Chao • Retired CEO and former President and CFO of Chelsea
Independent Property Group
Director • Non-executive director of Value Retail PLC ✓ Opted out of provisions of MUTA that
would allow us to stagger our board
Paul Massey • Founder and former CEO of Massey Knakal Realty without prior shareholder approval
Independent Services
Director • Former director of Brookfield Office Properties
✓ Opted out of Maryland control share
Stephen Quazzo acquisition statute
• Co-founder and CEO of Pearlmark Real Estate
Independent • Director of Marriott Vacations Worldwide
Director
✓ No Stockholder Rights Plan (1)
Elizabeth Fischer • Former Managing Director at Goldman Sachs
Independent • Served as Co-head of Goldman Sachs’ firmwide
Director Women’s Network
✓ 88% independent and 38% diverse
Greg Wood • CFO, EVP of EnergySolutions, Inc.
Independent • Former CFO of Actian Corp., Silicon Graphics, Liberate
Director Technologies, and InterTrust Technologies ✓ 65% of independent director retainer
in stock
Dr. John Strong • Chairman and CEO of Bankers Financial Corporation
Independent • Former President and Managing Partner of Greensboro
Director Radiology ✓ 7% ownership by officers and directors
Jane Silfen • Founder of Mayfair Advisors LLC
Independent • VP at Mayfair Management, an independent multi- Notes:
1. Any future adoption is subject to shareholder approval or
Director family office ratification within 12 months of adoption if board determines it
is in our best interest to adopt plan without prior approval
Grocery Centered. Community Focused. 26Our Commitment to ESG
We Are Committed to Making a Difference in Our Communities
Environmentally-Friendly Numerous Social Programs for
Asset Management Our Communities and Our Associates
Reducing energy consumption through
LED lighting retrofits both internally and
externally
• LED retrofits at 195 centers
Reducing water consumption with low
flow fixtures and smart irrigation controls
Increasing use of sustainable resources
such as solar panels and electric car ports
• EV charging available at 47 centers
Reducing waste through increased
recycling at our 294 centers as well as at
our corporate offices
Grocery Centered. Community Focused. 27Strong and Diversified Neighbor Mix
Top 20 Neighbors Dominated by Grocers and Other Necessity and Service-Based Businesses
Neighbor Location Count % ABR (1) Neighbor Location Count % ABR (1)
59 6.6% 5 0.8%
56 5.7% 79 0.7%
23 4.4% 35 0.7%
29 4.3% 4 0.7%
13 2.3% 7 0.6%
11 1.9% 4 0.6%
15 1.3% 4 0.6%
11 1.3% 2 0.6%
4 1.0% 5 0.6%
39 0.9% 11 0.5%
Total 36.1%
Grocer Investment Grade (2)
Notes:
1. % of ABR as of 6/30/2021
2. Investment Grade ratings represent the credit rating of our Neighbors, their subsidiaries or affiliated companies. Actual ratings based on S&P or Moody’s are used
Grocery Centered. Community Focused. 28Non-GAAP Reconciliations
• SECTION 2
APPENDIX
Non-GAAP ReconciliationsNon-GAAP Measures
We present Same-Center NOI as a supplemental measure of our performance. We define NOI as total operating
revenues, adjusted to exclude non-cash revenue items, less property operating expenses and real estate taxes.
We believe Same-Center NOI provides useful information to our investors about our financial and operating
performance because it provides a performance measure of the revenues and expenses directly involved in
owning and operating real estate assets and provides a perspective not immediately apparent from net income
(loss). Because Same-Center NOI excludes the change in NOI from shopping centers acquired or disposed of
outside the reporting periods, it highlights operating trends such as occupancy levels, rental rates, and operating
costs on shopping centers that were operational for both comparable periods. Other REITs may use different
methodologies for calculating Same-Center NOI, and accordingly, our Same-Center NOI may not be comparable
to other REITs.
Same-Center NOI should not be viewed as an alternative measure of our financial performance as it does not
reflect the operations of our entire portfolio, nor does it reflect the impact of general and administrative
expenses, depreciation and amortization, interest expense, other income (expense), or the level of capital
expenditures and leasing costs necessary to maintain the operating performance of our shopping centers that
could materially impact our results from operations.
We also present Same-Center NOI (Adjusted for Transactions), which is Same-Center NOI presented as if the
PELP Transaction (1) and the Merger (2) had occurred on January 1 of the earliest comparable period in each
presentation. This perspective allows us to evaluate Same-Center NOI growth over each comparable period.
Same-Center NOI (Adjusted for Transactions) is not necessarily indicative of what actual Same-Center NOI and
growth would have been if the PELP Transaction and the Merger had occurred on January 1 of the earliest
comparable period in each presentation.
Notes:
1. “PELP Transaction” means the October 2017 transaction pursuant to which we internalized our management structure through the acquisition of certain real estate assets and the third-party investment management business of
Phillips Edison Limited Partnership in exchange for OP units and cash
2. "Merger" refers to the November 2018 merger with Phillips Edison Grocery Center REIT II, Inc., a public non-traded REIT that was advised and managed by us
Grocery Centered. Community Focused. 30Non-GAAP Measures (Cont’d)
Below is a reconciliation of Net (Loss) Income to NOI for real estate investments and Same-Center NOI (in thousands):
Three Months Ended June 30, Six Months Ended June 30,
2021 2020 2019 2021 2020
Net income $ 6,390 $ (6,413) $ (42,172) $ 6,507 $ 4,786
Adjusted to exclude:
Fees and management income (2,374) (2,760) (3,051) (4,660) (4,925)
Straight-line rental income (expense) (1) (2,970) 948 (2,819) (4,392) (1,364)
Net amortization of above- and below-market
(887) (795) (1,091) (1,725) (1,583)
leases
Lease buyout income (1,781) (214) (223) (2,578) (308)
General and administrative expenses 11,937 9,806 13,540 21,278 20,546
Depreciation and amortization 56,587 56,370 59,554 111,928 112,597
Impairment of real estate assets 1,056 - 25,199 6,056 -
Interest expense, net 19,132 22,154 25,758 39,195 44,929
(Gain) loss on disposal of property, net (3,744) 541 1,266 (17,585) 2,118
Other expense (income), net 2,924 500 10,573 18,509 (9,369)
Property operating expenses related to fees and
1,306 891 1,531 2,122 1,528
management income
NOI for real estate investments 87,576 81,028 88,065 174,655 168,955
Less: Non-same-center NOI (2) (129) (1,656) (5,689) (1,551) (3.531)
Total Same-Center NOI $ 87,705 $ 79,372 $ 82,376 $ 173,104 $ 165,424
Less: Centers not included in 2019 Same-Center (3) (2,195) (585)
Total Same-Center NOI – Adjusted for 2019(3) $ 85,510 $ 81,791
Notes:
1. Includes straight-line rent adjustments for Neighbors for whom revenue is being recorded on a cash basis
2. Includes operating revenues and expenses from non-same-center properties which includes properties acquired or sold and corporate activities
3. When comparing Same-Center NOI for the three months ended June 30, 2021 and 2019, Same-Center NOI represents the NOI for the properties that were wholly-owned and operational for the entire portion of both comparable
reporting periods. Same-Center NOI when comparing the three months ended June 30, 2021 and 2019 excludes the change in NOI from properties acquired or disposed of after March 31, 2019.
Grocery Centered. Community Focused. 31Non-GAAP Measures (Cont’d)
Below is a reconciliation of Net (Loss) Income to NOI for real estate investments and Same-Center NOI (in thousands):
Year Ended December 31,
2020 2019
$ $
Net income
5,462 (72,826)
Adjusted to exclude:
Fees and management income (9,820) (11,680)
Straight-line rental income (1) (3,356) (9,079)
Net amortization of above- and below-market leases (3,173) (4,185)
Lease buyout income (1,237) (1,166)
General and administrative expenses 41,383 48,525
Depreciation and amortization 224,679 236,870
Impairment of real estate assets 2,423 87,393
Interest expense, net 85,303 103,174
Gain on disposal of property, net (6,494) (28,170)
Other (income) expense, net (9,245) 676
Property operating expenses related to fees and management income 6,098 6,264
NOI for real estate investments 332,023 355,796
Less: Non-same-center NOI (2) (4,036) (13,674)
$ $
Total Same-Center NOI
327,987 342,122
Notes:
1. Includes straight-line rent adjustments for Neighbors deemed to be non-creditworthy
2. Includes operating revenues and expenses from non-same-center properties which includes properties acquired or sold and corporate activities
Grocery Centered. Community Focused. 32Non-GAAP Measures (Cont’d)
Below is a reconciliation of Net (Loss) Income to NOI for real estate investments and Same-Center NOI (in thousands):
Year Ended December 31,
2019 2018
$ $
Net (loss) income
(72,826) 46,975
Adjusted to exclude:
Fees and management income (11,680) (32,926)
Straight-line rental income (9,079) (5,173)
Net amortization of above- and below-market leases (4,185) (3,949)
Lease buyout income (1,166) (519)
General and administrative expenses 48,525 50,412
Depreciation and amortization 236,870 191,283
Impairment of real estate assets 87,393 40,782
Interest expense, net 103,174 72,642
Gain on sale or contribution of property, net (28,170) (109,300)
Other 676 4,720
Property operating expenses related to fees and management income 6,264 17,503
NOI for real estate investments 355,796 272,450
Less: Non-same-center NOI (1) (16,175) (44,194)
NOI from same-center properties acquired in the Merger, prior to acquisition - 99,387
$ $
Total Same-Center NOI (Adjusted for Transactions)
339,621 327,643
Notes:
1. Includes operating revenues and expenses from non-same-center properties which includes properties acquired or sold and corporate activities
Grocery Centered. Community Focused. 33Non-GAAP Measures (Cont’d)
Below is a reconciliation of Net (Loss) Income to NOI for real estate investments and Same-Center NOI (in thousands):
Year Ended December 31,
2018 2017
$ $
Net income (loss)
46,975 (41,718)
Adjusted to exclude:
Fees and management income (32,926) (8,156)
Straight-line rental income (5,173) (3,766)
Net amortization of above- and below-market leases (3,949) (1,984)
Lease buyout income (519) (1,321)
General and administrative expenses 50,412 36,878
Transaction expenses 3,331 15,713
Vesting of Class B units – 24,037
Termination of affiliate arrangements – 5,454
Depreciation and amortization 191,283 130,671
Impairment of real estate assets 40,782 –
Interest expense, net 72,642 45,661
Gain on sale or contribution of property, net (109,300) (1,760)
Other 1,389 (881)
Property operating expenses related to fees and management income 17,503 5,579
NOI for real estate investments 272,450 204,407
Less: Non-same-center NOI (1) (35,456) (27,286)
NOI from same-center properties acquired in the PELP Transaction, prior to acquisition – 38,354
NOI from same-center properties acquired in the Merger, prior to acquisition 88,463 98,392
$ $
Total Same-Center NOI (Adjusted for Transactions)
Notes: 325,457 313,867
1. Includes operating revenues and expenses from non-same-center properties which includes properties acquired or sold and corporate activities
Grocery Centered. Community Focused. 34Non-GAAP Measures (Cont’d)
Below is a reconciliation of Net (Loss) Income to NOI for real estate investments and Same-Center NOI (in thousands):
Year Ended December 31,
2017 2016
$ $
Net (loss) income
(41,718) 9,043
Adjusted to exclude:
Fees and management income (8,156) –
Straight-line rental income (3,766) (3,512)
Net amortization of above-and below-market leases (1,984) (1,208)
Lease buyout income (1,321) (583)
General and administrative expenses 36,348 31,804
Transaction expenses 15,713 –
Vesting of Class B units 24,037 –
Termination of affiliate arrangements 5,454 –
Acquisition expenses 530 5,803
Depreciation and amortization 130,671 106,095
Interest expense, net 45,661 32,458
Other (2,336) (5,990)
Property operating expenses related to fees and management income 5,386 –
NOI for real estate investments 204,519 173,910
Less: Non-same-center NOI (1) (34,443) (20,015)
NOI from same-center properties acquired in the PELP Transaction, prior to acquisition 34,756 44,061
$ $
Total Same-Center NOI (Adjusted for Transactions)
204,832 197,956
Notes:
1. Includes operating revenues and expenses from non-same-center properties which includes properties acquired or sold and corporate activities
Grocery Centered. Community Focused. 35Non-GAAP Measures (Cont’d)
Earnings Before Interest, Taxes, Depreciation, and Amortization for Real Estate ("EBITDAre") and Adjusted EBITDAre
Nareit defines EBITDAre as net income (loss) computed in accordance with GAAP before (i) interest expense, (ii) income
tax expense, (iii) depreciation and amortization, (iv) gains or losses from disposition of depreciable property, and (v)
impairment write-downs of depreciable property. Adjustments for unconsolidated partnerships and joint ventures are
calculated to reflect EBITDAre on the same basis.
Adjusted EBITDAre is an additional performance measure used by us as EBITDAre includes certain non-comparable items
that affect our performance over time. To arrive at Adjusted EBITDAre, we exclude certain recurring and non-recurring
items from EBITDAre, including, but not limited to: (i) changes in the fair value of the liability; (ii) other impairment charges;
(iii) amortization of basis differences in our investments in our unconsolidated joint ventures; and (iv) transaction and
acquisition expenses.
We use EBITDAre and Adjusted EBITDAre as additional measures of operating performance which allow us to compare
earnings independent of capital structure, determine debt service and fixed cost coverage, and measure enterprise value.
Additionally, we believe they are a useful indicator of our ability to support our debt obligations. EBITDAre and Adjusted
EBITDAre should not be considered as alternatives to net income (loss), as an indication of our liquidity, nor as an indication
of funds available to cover our cash needs, including our ability to fund distributions. Accordingly, EBITDAre and Adjusted
EBITDAre should be reviewed in connection with other GAAP measurements, and should not be viewed as more prominent
measures of performance than net income (loss) or cash flows from operations prepared in accordance with GAAP. Our
EBITDAre and Adjusted EBITDAre, as presented, may not be comparable to amounts calculated by other REITs.
Grocery Centered. Community Focused. 36Non-GAAP Measures (Cont’d)
The following table presents the Company's calculation of EBITDAre and Adjusted EBITDAre and provides additional information related
to its operations (in thousands):
Year Ended
Three Months Ended June 30, Six Months Ended June 30,
December 31,
2021 2020 2021 2020 2020
Calculation of EBITDAre
Net income (loss) $ 6,390 $ (6,413) $ 6,507 $ 4,786 $ 5,462
Adjustments:
Depreciation and amortization 56,587 56,370 111,928 112,597 224,679
Interest expense, net 19,132 22,154 39,195 44,929 85,303
(Gain) loss on disposal of property, net (3,744) 541 (17,585) 2,118 (6,494)
Impairment of real estate assets 1,056 — 6,056 — 2,423
Federal, state, and local tax expense 165 180 331 209 491
Adjustments related to unconsolidated
(535) 1,391 597 2,568 3,355
joint ventures
EBITDAre $ 79,051 $ 74,223 $ 147,029 $ 167,207 $ 315,219
Calculation of Adjusted EBITDAre
EBITDAre $ 79,051 $ 74,223 $ 147,029 $ 167,207 $ 315,219
Adjustments:
Change in fair value of earn-out liability 2,000 — 18,000 (10,000) (10,000)
Transaction and acquisition expenses 934 14 1,075 59 539
Amortization of unconsolidated joint
79 254 825 721 1,883
venture basis differences
Other impairment charges — — — — 359
Adjusted EBITDAre $ 82,064 $ 74,491 $ 166,929 $ 157,987 $ 308,000
Grocery Centered. Community Focused. 37Non-GAAP Measures (Cont’d)
Financial Leverage Ratios
The Company’s net debt to Adjusted EBITDAre, net debt to total enterprise value, and debt covenant compliance as of
June 30, 2021 allows the Company access to future borrowings as needed in the near term. The following table presents the
Company’s calculation of net debt and total enterprise value, inclusive of its prorated portion of net debt and cash and cash
equivalents owned through its joint ventures, as of June 30, 2021 and December 31, 2020 (in thousands):
June 30, 2021
June 30, 2021 December 31, 2020
(As Adjusted)(2)
Net debt:
Total debt, excluding market adjustments and deferred
$ 1,906,754 $ 2,272,268 $ 2,345,620
financing expenses
Less: Cash and cash equivalents 153,902 22,633 104,952
Total net debt $ 1,752,852 $ 2,249,635 $ 2,240,668
Enterprise value:
Net debt $ 1,752,852 $ 2,249,635 $ 2,240,668
Total equity value(1) 3,543,624 3,386,803 2,797,234
Total enterprise value $ 5,296,476 $ 5,636,438 $ 5,037,902
Notes:
1. Total equity value is calculated as the number of common shares and OP units outstanding multiplied by the EVPS as of June 30, 2021 and December 31, 2020, respectively. There were 107.0
million diluted shares outstanding with an EVPS of $31.65 as of June 30, 2021 and 106.6 million diluted shares outstanding with an EVPS of $26.25 as of December 31, 2020.
2. In July, the Company entered into a new credit facility comprised of a revolving credit facility and two unsecured term loan tranches (the "Refinancing"). In connection with this activity PECO
paid off a term loan due in 2025. In addition to this activity, the Company used underwritten IPO proceeds to retire a term loan due in 2022. Total Net Debt has been adjusted as though the
Refinancing, underwritten IPO, and retirement of the term loan using the underwritten IPO proceeds had occurred as of June 30, 2021.
Grocery Centered. Community Focused. 38Non-GAAP Measures (Cont’d)
The following table presents the calculation of net debt to Adjusted EBITDAre and net debt to total enterprise value as of
June 30, 2021 and December 31, 2020 (dollars in thousands):
June 30, 2021
June 30, 2021 December 31, 2020
(As Adjusted)(2)
Net debt to Adjusted EBITDAre - annualized:
Net debt $ 1,752,852 $ 2,249,635 $ 2,240,668
Adjusted EBITDAre - annualized(1) 316,307 316,942 308,000
Net debt to Adjusted EBITDAre - annualized 5.5x 7.1x 7.3x
Net debt to total enterprise value
Net debt $ 1,752,852 $ 2,249,635 $ 2,240,668
Total enterprise value 5,296,476 5,636,438 5,037,902
Net debt to total enterprise value 33.1% 39.9% 44.5%
Notes:
1. Adjusted EBITDAre is based on a trailing twelve month period.
2. In July, the Company entered into the Refinancing. In connection with this activity PECO paid off a term loan due in 2025. In addition to this activity, the Company used underwritten IPO
proceeds to retire a term loan due in 2022. Total Net Debt has been adjusted as though the Refinancing, underwritten IPO, and retirement of the term loan using the underwritten IPO
proceeds had occurred as of June 30, 2021.
Grocery Centered. Community Focused. 39You can also read