Principal Financial Group - May 2019
←
→
Page content transcription
If your browser does not render page correctly, please read the page content below
Principal Financial   Group ®

May 2019

Use of Non-GAAP financial measures
    A non-GAAP financial measure is a numerical measure of performance, financial position, or cash flow
    that includes adjustments from a comparable financial measure presented in accordance with U.S. GAAP.
    The company uses a number of non-GAAP financial measures management believes are useful to
    investors because they illustrate the performance of the company’s normal, ongoing operations which is
    important in understanding and evaluating the company’s financial condition and results of operations.
    While such measures are also consistent with measures utilized by investors to evaluate performance,
    they are not, however, a substitute for U.S. GAAP financial measures. Therefore, the company has
    provided reconciliations of the non-GAAP financial measures to the most directly comparable U.S. GAAP
    financial measure within the slides. The company adjusts U.S. GAAP financial measures for items not
    directly related to ongoing operations. However, it is possible these adjusting items have occurred in the
    past and could recur in future reporting periods. Management also uses non-GAAP financial measures
    for goal setting, as a basis for determining employee and senior management awards and compensation,
    and evaluating performance on a basis comparable to that used by investors and securities analysts.
    The company also uses a variety of other operational measures that do not have U.S. GAAP counterparts,
    and therefore do not fit the definition of non-GAAP financial measures. Assets under management is an
    example of an operational measure that is not considered a non-GAAP financial measure.

2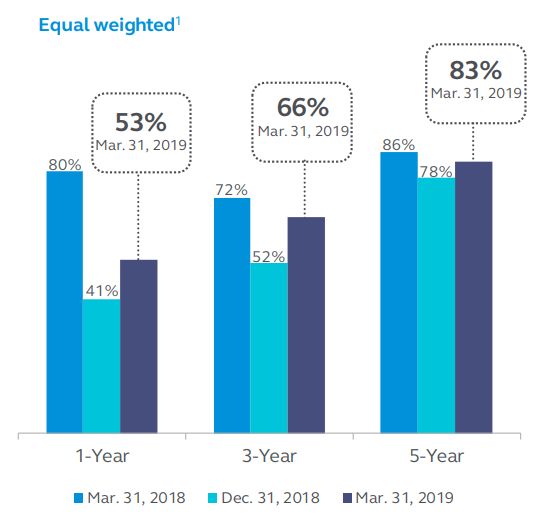
Forward looking statements
    Certain statements made by the company which are not historical facts may be considered forward-looking statements,
    including, without limitation, statements as to non-GAAP operating earnings, net income attributable to PFG, net cash flow,
    realized and unrealized gains and losses, capital and liquidity positions, sales and earnings trends, and management’s beliefs,
    expectations, goals and opinions. The company does not undertake to update these statements, which are based on a
    number of assumptions concerning future conditions that may ultimately prove to be inaccurate. Future events and their
    effects on the company may not be those anticipated, and actual results may differ materially from the results anticipated in
    these forward-looking statements. The risks, uncertainties and factors that could cause or contribute to such material
    differences are discussed in the company’s annual report on Form 10-K for the year ended Dec. 31, 2017, and in the
    company’s quarterly report on Form 10-Q for the quarter ended Sep. 30, 2018, filed by the company with the U.S. Securities
    and Exchange Commission, as updated or supplemented from time to time in subsequent filings. These risks and
    uncertainties include, without limitation: adverse capital and credit market conditions may significantly affect the company’s
    ability to meet liquidity needs, access to capital and cost of capital; conditions in the global capital markets and the economy
    generally; volatility or declines in the equity, bond or real estate markets; changes in interest rates or credit spreads or a
    sustained low interest rate environment; the company’s investment portfolio is subject to several risks that may diminish the
    value of its invested assets and the investment returns credited to customers; the company’s valuation of investments and
    the determination of the amount of allowances and impairments taken on such investments may include methodologies,
    estimations and assumptions that are subject to differing interpretations; any impairments of or valuation allowances
    against the company’s deferred tax assets; the company’s actual experience could differ significantly from its pricing and
    reserving assumptions; the pattern of amortizing the company’s DAC and other actuarial balances on its universal life-type
    insurance contracts, participating life insurance policies and certain investment contracts may change; changes in laws,
    regulations or accounting standards; the company may not be able to protect its intellectual property and may be subject to
    infringement claims; the company’s ability to pay stockholder dividends and meet its obligations may be constrained by the
    limitations on dividends Iowa insurance laws impose on Principal Life; litigation and regulatory investigations; from time to
    time the company may become subject to tax audits, tax litigation or similar proceedings, and as a result it may owe
    additional taxes, interest and penalties in amounts that may be material; applicable laws and the company’s certificate of
    incorporation and by-laws may discourage takeovers and business combinations that some stockholders might consider in
    their best interests; competition, including from companies that may have greater financial resources, broader arrays of
    products, higher ratings and stronger financial performance; technological and societal changes may disrupt the company’s
    business model and impair its ability to maintain profitability; a downgrade in the company’s financial strength or credit
    ratings; client terminations, withdrawals or changes in investor preferences; inability to attract and retain qualified
    employees and sales representatives and develop new distribution sources; an interruption in telecommunication,
    information technology or other systems, or a failure to maintain the confidentiality, integrity or availability of data residing
    on such systems; international business risks; fluctuations in foreign currency exchange rates; risks arising from participation
    in joint ventures; the company may need to fund deficiencies in its “Closed Block” assets; the company’s reinsurers could
    default on their obligations or increase their rates; risks arising from acquisitions of businesses; and loss of key vendor
    relationships or failure of a vendor to protect information of our customers or employees.

3
Company Overview
A leading financial services company
Fortune 500 company; 140 year history; customers in over 80 countries
Non-GAAP pre-tax Assets Under Management2
operating earnings1 $675.4 billion
$2,222.9 million As of Mar. 31, 2019
As of Mar. 31, 2019
RIS - Fee
8% Principal Global Principal Global
Investors Fee
13% Investors
13% 22%
Principal
International
24% Other Entities of
RIS - Spread Spread PFG
19% 63%
25%
Specialty
13% Benefits Risk Third Party Asset
Managers
Individual Life
1 Trailing Twelve Months. Excludes Corporate.
4 2 Assets under management by asset manager.Company Overview
Segment reporting structure
Principal Financial Group
Dan Houston Chairman, President & CEO
Deanna Strable CFO
Retirement Principal Principal U.S. Insurance
and Income Global International Solutions
Solutions (RIS) Investors (PGI) (PI) (USIS) Corporate
Renee Schaaf Pat Halter Luis Valdes Amy Friedrich
President President President President
Specialty
Individual
RIS-Fee RIS-Spread Benefits
Life
(SBD)
Management team averages approximately
30 years of industry experience
5Company Overview
Global Asset Management
Principal Global Asset Management (GAM)
Tim Dunbar
Principal
Global Strategy,
Principal Global International (PI)
General Account RobustWealth Marketing &
Investors (PGI) investment
Product
operations*
Institutional Retirement High net worth/Retail
investors investors investors
*As permitted and in accordance with regulatory guidelines in the markets in which we operate.
6Company Overview
Experienced management team
Name Age1 Title (Industry/PFG)1__
Daniel J. Houston 58 Chairman, President & Chief Executive Officer 35/35
Timothy M. Dunbar 62 President – Principal Global Asset Management 38/33
Amy C. Friedrich 49 President - U.S. Insurance Solutions 23/19
Patrick G. Halter 60 CEO & President – Principal Global Investors 35/35
Renee Schaaf 61 President - Retirement & Income Solutions 39/39
Luis E. Valdes 62 President - International Asset Management and Accumulation 31/28
Julia M. Lawler 59 Executive VP & Chief Risk Officer 37/35
Gary P. Scholten 62 Executive VP, Chief Information Officer & Chief Digital Officer 39/39
Karen E. Shaff 65 Executive VP, General Counsel & Secretary 37/37
Deanna D. Strable 51 Executive VP & Chief Financial Officer 30/30
Jon N. Couture 54 Senior VP & Chief Human Resources Officer 15/2
1 As of 12/2019
7Company Overview
Industry leadership
Global Asset
Management
Best Place to Work in Money Mgmt1
#1 APV - Chile2
Top 10 manager Real Estate3
7th largest manager High Yield 4
ENERGY STAR Partner of the Year5
Global Retirement Risk
and Long-Term Savings Protection
#5 provider of DC plans6 #1 Non-qualified deferred
compensation 13
#1 Pension provider in Latin America7
#3 Non-medical coverages14
#5 AFORE – Mexico 8
#5 Individual Disability
#1 P/VGBL - Brazil9
Insurance15
#6 MPF provider – Hong Kong 10
#1 provider of DB plans11
#1 provider of ESOP plans12
Sources: 1 Pensions & Investments, “The Best Places to Work in Money Management”, PGI recognition 12/10/2018. 2 SVS, SP, December 2018. 3 The 7th
largest manager of worldwide real estate assets out of 88 managers profiled. “Largest Real Estate Managers”, PENSIONS & INVESTMENTS, October 1,
2018. 4 The 7th largest manager of high yield securities, out of 76 managers profiled. Managers ranked by U.S. institutional, tax-exempt assets managed
internally, as of December 31, 2017. “Largest Money Managers”, PENSIONS & INVESTMENTS, May 28, 2018. 5 April 2018, U.S. Environmental Protection
Agency. 6 PLANSPONSOR Defined Contribution Recordkeeping Survey, July 2018. 7 7AUM among multi-country pension providers; Fenaprevi December
2018. 8 CONSAR in terms of AUM, December 2018. 9 Ranking in terms of AUM, Fenaprevi. December 2018. 10 In terms of AUM, Mercer, December 2018.
11 PLANSPONSOR Defined Benefit Administration Survey, May 2018. 12 PLANSPONSOR Defined Contribution Recordkeeping Survey, July 2018.
13 PLANSPONSOR Defined Contribution Recordkeeping Survey, July 2018. 14 LIMRA 2017 survey: Non-medical based on fully insured employer contracts
in force. 15 LIMRA 2018 survey: Individual Disability Insurance (IDI) rank based on in-force premium.
8Company Overview
Current ratings
(As of April 2019)
Moody’s Investors
Fitch Ratings Standard & Poor’s A.M. Best
Service
‘AA-’, Very Strong – ‘A+’, Strong – fifth ‘A+’, Superior –
‘A1’, Good – fifth
fourth highest of highest of 20 second highest of
highest of 21
19 rating levels. rating levels. 13 rating levels.
rating levels.
Outlook: Stable Outlook: Stable Outlook: Stable
Outlook: Stable
Financial Strength ratings related to Principal Life Insurance Company and
Principal National Life Insurance Company.
9Company Overview
The customer remains at the
center of our strategy
Our customers
Small to Medium Sized
Individuals Institutions Customer
Businesses (SMBs)
We help people We help businesses We tailor investment Individuals
save and invest; address risks and solutions to client Institutions
and protect against compete for talent, preferences, risk SMBs
financial risks through insurance, tolerances and long-
through insurance retirement and term investment
and guaranteed other employee benefits. objectives.
income.
Our foundation
Customer Focus | Talent Development | Financial Strength | Integrity | Operational Excellence |
Capital & Risk Management | Diversity & Inclusion | Social Responsibility
10Retirement & Income Solutions
Small to medium businesses (SMBs)
Retirement • Employer-Sponsored Retirement Plans
and Income o Defined Contribution (DC)
o Defined Benefit (DB)
Solutions o Employer Stock Ownership Plan (ESOP)
o Nonqualified Deferred Compensation (NQ)
overview • Pension Risk Transfer (PRT)
• Trust and Custodial Services
SMBs
Individuals
Our mission • Annuities (variable and fixed)
To help more people save • Individual Retirement Accounts (IRA)
enough, protect enough • Certificate of Deposits (CD)
and have enough in • Money Market Accounts (MM)
retirement.
Institutions
• Employer-Sponsored Retirement Plans
• Pension Risk Transfer (PRT)
• Trust and Custodial Services
• Investment Only solutions
o Medium-Term Notes
o Guaranteed Interest Contracts (GIC)
o Stable Value Wraps
11Retirement & Income Solutions
Strong business fundamentals
Net cash flow as a
percent of beginning
of year account value 2015 1Q19 CAGR
(2013-2017 average)
RIS total account value $210B $286B 10%
Principal
RIS-Fee return on net
+1% revenue2
32.0% 31.8%
RIS-Spread return on net
63.0% 70.3%
revenue2
Participants3 4.7M 5.7M 6%
-1%
Industry 1
1 Department of Labor & Cerulli Associates, 2017. 2 For trailing 12 months. 3 Defined contribution and defined benefit.
12Retirement & Income Solutions
Market leading solutions
Principal Total Retirement Suite SM Principal is a leader in retirement
is still a differentiator income
Defined Contribution #3 Pension Risk Transfer4
#5
Recordkeeper1 (number of plans) (by premium)
Defined Benefit Provider3 Individual Immediate Annuities5
#1 (number of clients)
#4 (by premium)
Employee Stock Ownership Plan Deferred Income Annuities5
#1 #4
Recordkeeper1 (number of plans) (by premium)
Nonqualified Deferred Comp
#1
Recordkeeper2 (number of plans)
1 Defined
Contribution and ESOP: PLANSPONSOR Recordkeeping Survey 07/18; 2 Defined Benefit: PLANSPONSOR DB Administration
Survey 05/18; 3 Nonqualified Deferred Compensation: PLANSPONSOR Recordkeeping Survey 07/18; 4 LIMRA Secure Retirement Institute
13 based on premiums as of 12/31/2018; 5 LIMRA Secure Retirement Institute – based on premiums as of 12/31/2018
–Retirement & Income Solutions (RIS – Fee)
Flexible business model serves multiple markets
Bundled
(Full Service) MetLife Fidelity
T.Rowe Price
Prudential
Vanguard
BUSINESS MODEL
Mass Mutual
Empower
Ascensus
Transamerica
VOYA
Nationwide
John Hancock
Unbundled
(TPA)
Small Case TARGET MARKET Large Case
14Retirement & Income Solutions (RIS – Fee)
U.S. retirement market potential remains immense
U.S. retirement system dominant,
Retirement market despite under-savings (in trillions)
opportunities $30
RETIREMENT READINESS: $25
• New plan formation
• Non-participants $20
• Under-saved
$15
INCOME SOLUTIONS:
• Yield/Income $10
• Outcomes:
−Longevity $5
−Market volatility
$0
−Inflation
Defined Benefit (DB)
Private Defined Contribution (DC) and
Individual Retirement Account (IRA)
2nd-15th largest retirement systems
combined
Sources: Retirement Markets 2017, Cerulli Retirement Markets, 2018;
15 https://www.willistowerswatson.com/-/media/WTW/Images/Press/2018/01/Global-Pension-Asset-Study-2018-Japan. pdfRetirement & Income Solutions (RIS – Fee)
Balanced sales approach
Transfer deposits
16 15.2
14
12.4 12.5 3.9
12
9.9 3.3 3.1
10 3.2 4th Quarter
$ Billions
2.5
8 2.6 2.6 3rd Quarter
1.9 3.7 2nd Quarter
6
2.3 2.9 1st Quarter
1.9
4
4.4 5.2
2 3.6 4.2 3.9
0
2015 2016 2017 2018 2019
16Retirement & Income Solutions (RIS – Fee)
The power of payroll deduction
Recurring deposits
25
22.0
• People making a
20.1
deferral +15%1 20 19.0
5.2
17.9
• Avg deferral per 4.5
4.6
member +7%1 15
4.2
5.2
• People receiving a
$ Billions
4.9
4.3 4.6
match +20%1 10
5.8
4.9 5.2
4.6
5
5.0 5.4 5.8 6.3
4.8
0
2015 2016 2017 2018 2019
1st Quarter 2nd Quarter 3rd Quarter 4th Quarter
1 4Q18 compared to 4Q15
17Retirement & Income Solutions (RIS – Fee)
Account value detail
100% 5% 5% 5% 4% 4%
90% 7% 7% 7% 7% 7%
Individual Variable
Annuities
80%
25% 26% 29%
32% 33%
Employer Securities
70%
60% Non-Proprietary
50% Funds
30% 28% 27%
40%
24% 25% Proprietary Funds
30%
Separate Account
20% 27% 29% 29% 28% 27%
10% General Account
6% 6% 4% 5%
0% 4%
2015 2016 2017 2018 1Q19
18Retirement & Income Solutions (RIS – Spread)
The diversified customers we serve
Pension Risk Transfer customers Individual Annuity customers
302,000 lives diversified by age 277,000 lives diversified by age
Age 90+
Age 90+ Below
Below age 60 7%
6% age 60
16% 15%
Age 80-89 Age 80-89
19% 19%
Age 60-69
Age 60-69 30%
Age 70-79
Age 70-79 26% 29%
33%
As of 12/31/2018
19Retirement & Income Solutions (RIS – Spread)
Serving SMBs enhances diversification
Principal’s PRT plans by industry1 PRT new sales market share
Over 90% of plans have under 100 lives by premium and contracts2
Trade 40%
7% Finance
14%
Tax-Exempt 30%
14%
20% #2
Labor
5,250 13%
plans #3
10%
Services
22%
0% Principal
Top competitors
Manufacturing
Premium Contracts
30%
1 As of 12/31/2018
2 LIMRA Secure Retirement Institute, 2018 sales
20Retirement & Income Solutions (RIS – Spread)
Innovative solutions: solving income needs
Multi-product solution set to
transition retirement savings
into income streams SMBs
Our approach:
• Education
• Annuities to provide: • Planning
‒ Fixed returns assistance
‒ Guaranteed income (RetireSecure®)
‒ Protection against volatility • Full array of
options
• Bank products
• Innovative
• Pension Risk Transfer solutions
‒ Defined Benefit plan terminations • Digital advice
21Principal Global Investors
Diversified global asset
management organization
$59 B • Broad range of investors in over 80 countries
• Offices in major money centers worldwide
Fixed Income
$423 B $195 B • Long commitment to corporate stewardship;
Equity
of AUM 1 signatory to United Nations’ Principles for
Alternatives
Responsible Investment (PRI)
$169 B
• Principal ranked among top companies with
$148 B
1,000+ employees in Pensions & Investments’
Best Places to Work in Money Management,
for the seventh year in a row2
$81 B
$137 B PGI Sourced Institutional
$423 B PGI Sourced Retail
of AUM 1 General Account
$97 B Other Proprietary
$108 B
1 AUM as of 03/31/2019. 2 Pensions & Investments, “The Best Places to Work in Money Management”, PGI recognition
22 12/10/2018.
22Principal Global Investors
Overview - key areas of focus
Leverage our client focused business model
• Design and deliver products informed by the voice of the client
• Further enhance our ability to capture client perspectives
• Take advantage of our modernized distribution model
Commitment to further build out of high value, specialist capabilities
• Develop additional capabilities in private assets, including globalization of our
highly successful real estate investment franchise
• Continue build out of systematic beta in equities and fixed income boutiques
Strategically leverage technology across the business
• Use digital technology to improve our core investment processes
• Facilitate delivery of customized solutions to Retirement and Retail investors
• Empower sales and marketing teams with more efficient ways to reach our clients
and their advisors
23
23Principal Global Investors
Broad global distribution in retail and
institutional markets
Distribution Distribution Product
channels partners set
Global Institutional Global Distributors Separate Accounts
US Retail Global Consultants US Mutual Funds
Non-US Retail US Wirehouses UCITS/QIAIFs*
Independent Financial ETFs
and Registered
Investment Advisors SMA/UMA
Private Banks CIT
*Certain vehicles have not been registered with the US Securities and Exchange Commission under the US Securities Act of 1933
and may not be directly or indirectly offered or sold in the US or to any US person.
24Principal Global Investors
Gain from highly focused investment teams
Striving to deliver consistent, risk-controlled results,
flexible investment strategies, and customized solutions –
all through a single, globally integrated investment advisor.
Comprises Leverages Cultivates Integrates
experienced the expertise of a small-company global business
managers, each more than 560 mindset in a large- to provide
offering distinct global investment company clients access to
investment professionals, with environment comprehensive
specialties and a focus on investment
philosophies customized strategies and
solutions solutions
25Principal Global Investors
In-demand, specialist capabilities
Finisterre
Claritas3 Capital LLP
Principal
$1.4 $2.1 Principal Unique hybrid business model
Portfolio Global Fixed
Strategies1 Income2
$124.8
Distinct investment processes
Principal
Real Estate - Post Advisory
Private Group
$53.1 $16.4 Leverage distribution
Principal – Global institutional
Spectrum
Aligned
Investors Global Asset
– Global funds
Management
$26.1
Investors $20.8
Principal $423.1 B Principal
Integrated business processes
Global
Equities
Real Estate -
CMBS $8.6 – Drive scale
$88.9
– Share best practices
Principal Real Edge Asset
Estate - REITS Management
$17.7 Columbus $16.9
Circle Origin Asset Asset Allocation/Multi-Strategy
Investors Management Fixed Income
$4.1 $3.3
Equity
Alternatives
AUM in billions, as of 03/31/2019. 1 Principal Portfolio Strategies allocates investment dollars across PGI boutiques and third-
party managers. 2 Effective 10/1/2018, the Morley Financial Services joined the Principal Global Fixed Income team to align
capabilities and resources. As a result, approximately $17 billion of AUM moved from the Morley Financial Services boutique to
26 the Principal Global Fixed Income boutique. 3 Effective 1/1/2019, Claritas, an investment management company in Brazil, moved
from Principal International to Principal Global Investors.Principal Global Investors
Comprehensive capabilities of
autonomous asset managers
As of 31 March 2019.
Principal Global Investors is a diversified global asset management organization, with a range of investment capabilities provided by
the investment boutiques within the Principal Global Investors group of companies, by its internal boutiques, affiliated companies
27
and ventured partners.Principal Global Investors
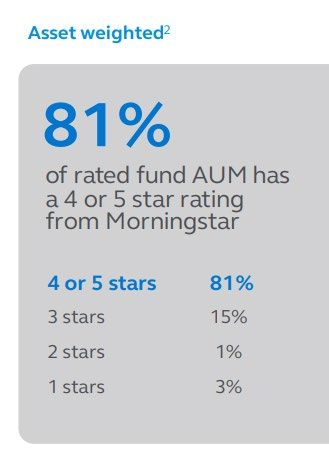
Investment performance
1 Percentage of Principal actively managed mutual funds, exchange traded funds (ETFs), insurance separate accounts,
and collective investment trusts (CITs) in the top two Morningstar quartiles. Excludes Money Market, Stable Value,
Liability Driven Investment (Short, Intermediate and Extended Duration), Hedge Fund Separate Account, & US Property
28 Separate Account. 2 Includes only funds with ratings assigned by Morningstar; non-rated funds excluded (78 total funds
with I-shares, 74 are ranked)Principal Global Investors
Well-positioned for industry trends
• Industry leader in delivering
solutions, including multi-
asset solutions
• Strong and growing suite of Generate
alternatives Income
• Early entrant in the Active
ETF space Client
• Hybrid, Passive and Indexed Needs
offerings on retirement Manage
Grow
platform of the Principal Risk
Assets
Financial Group
• With investment teams that
span asset classes, sector
rotation presents
opportunities
29Principal International
Principal International overview
Mission: Helping 20 million middle class customers in our chosen emerging markets plan and
invest for their financial security through our retirement and long-term savings franchise.
China (2005)
Principal Financial • 11.3M customers Hong Kong (1996)
• AUM of $158.4B
Group • 0.6M customers
• Asset Management, • AUM of $10.2B
Mutual Funds
India (2000) • Mandatory Pensions, Mutual
Mexico (1993) • 0.6M customers Funds, Asset Management
• 3.0M customers • AUM of $1.1B
Thailand (2010)
• AUM of $13.6B • Mutual Funds, Asset
Management, Advisory • 40K customers
• Mandatory Pensions,
Mutual Funds, Asset Services • AUM of $4.2B
Management • Voluntary Pensions, Mutual
Funds, Asset Management
Malaysia (2003)1
Chile (1995) Brazil (1999) • 0.7M customers Indonesia (2007)
• 1.7M customers • 2.4M customers • AUM of $15.8B • 15K customers
• AUM of $46.8B • AUM of $69.1B • Conventional & Islamic • AUM of $0.5B
• Mandatory Pensions, Voluntary • Voluntary Pensions, Asset Management, Mutual • Asset Management, Mutual Funds
Pensions , Mutual Funds, Asset Mutual Funds, Asset Funds, Voluntary Pensions
Management, Annuities Management, Annuities
Singapore (2006)
• Asset Management
(Year) = Principal entered
Covered lives as of March 2019
PI Sourced AUM as of March 2019
30 1 Includes SingaporePrincipal International
Strong growth
Increasing diversification1, 2 Pre-tax operating earnings growth2
(USD millions)
$400
$350
26% $300
$250
2018 $200
Pre-tax OE
$150
$100
74%
$50
$0
2013 2018
Latin America Asia
1 In 2013, Asia and Latin America contributed 5% and 95%, respectively. 2 Pre-tax operating earnings are adjusted for the
impact of the actuarial assumption review in 2018 (-$54 million) and lower than expected encaje (-$32 million). 2013 is
31 adjusted to reflect 2018 exchange rates (-$105 million).Principal International
Sustained global asset growth
AUM growth
Global AUM by region
+5% from 2016-2025e
$80.0 (USD trillions)
$70.0 • Globally: 6%
$60.0 • Non-PI markets: 5%
$50.0 • PI markets: 10%
+6%
$40.0 +11%
$30.0
$20.0
+9%
$10.0 +10%
$0.0
North America Europe Asia-Pacific Middle East + Latin America
Africa
2016 2025e
Principal International (PI) markets
Source: “Asset & Wealth Management Revolution: Embracing Exponential Change,” PwC, 2017. Growth calculations are weighted.
32Principal International
Continued GDP growth
1990 $T 2010 $T 2030E $T 2050E $T
1 U.S. 5.9 U.S. 15.0 China 36.1 China 61.0
2 Japan 3.1 China 5.9 U.S. 25.5 India 42.2
3 Germany 1.7 Japan 5.5 India 17.1 U.S. 41.4
4 France 1.2 Germany 3.3 Japan 6.0 Indonesia 12.2
5 Italy 1.1 France 2.5 Indonesia 5.5 Brazil 9.2
6 UK 1.0 UK 2.3 Brazil 5.0 Mexico 8.0
7 Canada 0.6 Italy 2.0 Russia 4.9 Japan 7.9
8 Spain 0.5 Brazil 2.1 Germany 4.6 Russia 7.6
9 Brazil 0.5 Canada 1.6 Mexico 4.0 Nigeria 7.3
10 China 0.4 Russia 1.5 UK 3.6 Germany 6.3
Current Principal international locations: Asia Latin America
Source: IMF (historical data), PwC (projections), 2015
33Principal International
Strong partnerships
JV partnerships are foundational to our strategy in emerging markets
We leverage our partners strong local presence, brand, and distribution to better serve
middle class customers
Brasilprev CCBPAM CIMB-Principal
Partner Banco do Brasil China Construction Bank CIMB Group
Malaysia, Thailand,
Market(s) Brazil China
Indonesia, Singapore
Mutual funds, asset Pension, mutual funds,
Products Pension
management asset management
Partner’s
66M retail customers1 360M retail customers 2 14M retail customers 3
distribution
4,770 branches1 14,920 branches 2 796 branches3
reach
JV customers 4 2.4M customers 11.3M customers 0.7M customers
1 Banco do Brasil 2017 Annual Report. 2 CCB 2017 Annual Report. 3 CIMB Group 2018 Annual Report. 4 As of March 2019;
34 customer counts based on the number of products they have.Principal International
Strong market presence
Latin America Asia
•
Latin
Chile: #1 provider of
Asia • China: #3 largest retail fund provider1
America
voluntary pension1
• Hong Kong: #6 largest MPF provider1
• Brazil: #1 in total market share2
• SE Asia: #2 in unit trust market (Malaysia) 2
• Mexico: #5 largest mandatory
pension provider1
1 As of December 2018 2 February 2019
35Principal International
AUM evolution fueled by organic growth
42 consecutive quarters of positive net cash flow1
(in billions) PI reported
AUM as of 3Q 2008 $ 29
Net cash flow 75
Investment performance 73
Other (4)
Operations acquired 48
Effect of exchange rates (60)
AUM as of 1Q 2019 $ 161
1 As of March 2019
36U.S. Insurance Solutions
U.S. Insurance Individuals
Solutions • Individual life insurance
• Individual disability insurance
Our mission
Small to medium sized
SMBsbusinesses (SMBs)
Help businesses and individuals by SMBs
offering solutions that grow and • Business Owner & Executive Solutions (BOES)
protect their assets, and enable • Nonqualified Deferred Compensation (NQ)
them to live their best lives.
• Group employer paid and voluntary products
Current customer base:
• 104,000 employers
• Multi-life/employer based disability insurance,
• 4.5 million individuals including business owner solutions
Institutions
• Group employer paid and voluntary products
67% of total PFG employer
relationships are held in USIS
37
37U.S. Insurance Solutions
Market opportunity with small- to medium-sized businesses
33% don’t offer
group insurance2
67% don’t have
59million
6 million an NQ plan 2
SMB employees
employers1 58% don’t have
disability coverage 2
(48% of working
population) 3
43% don’t have
a buy/sell plan 2
1What’s New with Small Business, SBA Office of Advocacy, August 2018
22019 Principal Business Owner survey conducted January 7-25, 2019. 1,020 employed U.S. business owners (of at least 5% of
business), actively making decisions, 2-499 employees
38 3SBA Office of Advocacy, Small Business Profile, SBA, 2018U.S. Insurance Solutions
Market position
Group1 Individual1 Individual
Benefits Disability Life
#3 Total in-force #3 New sales #1 Nonqualified
contracts premium plans2
Total new life
#5 In-force premium #18
sales premium3
#2 Life
#4 Disability Life
#5 Dental
Sources: 1LIMRA, 2017 & 2018 for IDI sales premium; 2Based on total number of Section 409A plans, PLANSPONSOR 2018 Recordkeeping Survey, June 2018;
3LIMRA U.S. Retail + Small Case COLI/BOLI Individual Life Insurance Sales Participant Report, Full-Year 2017
39U.S. Insurance Solutions: Specialty Benefits Insurance
Above industry premium growth and a balanced portfolio
3 Year In-Force Premium Growth 1Q19 TTM Total Premium & Fees
Group
(2014 – 2017 CAGR) Benefits
81%
Specialty
Benefits
Group
7.1% 7.5% Benefits
83%
Individual
Disability
2.1%* 1.8%* 17%
Group Benefits Individual DI Group
Disability
Principal Industry Group 28%
Life 24%
• Stable loss ratios
• Attractive margins Group Dental &
vision 48%
Benefits
40 Source: * Industry figures based on 2014-2017 CAGR, LIMRA 2014-2017U.S. Insurance Solutions
SMB focus
Group Benefits in-force cases New sales premium and fees
Individual
100 to 1,000 1,000 or more 37%
employees employees Individual
5%U.S. Insurance Solutions: Specialty Benefits Insurance
Diversification in Group Benefits
Number of employer Employer paid Employer Dental & Disability
customers plus voluntary paid only vision insurance
72,000
54% 32% 48% 28%
Average case size New sales In-force
37 premium premium
Case retention1
87% Voluntary
only
14%
Life
24%
34% of all new cases sold
include “first-time” benefits
As of 12/31/18
1 Average retention for the period 1/1/2016 – 12/31/2018
42U.S. Insurance Solutions
Focus on the business market
Solutions for businesses,
business owners and key
executives Individual 37%
Business owners’ financial
challenges
• Exiting the business
BOES 31%
• Business transition
• Retaining key employees
• Retirement planning
Solutions for key employees
• Retirement income ER/NQ 32%
• Survivor income
• Business protection
1Q19 TTM Sales
BOES = Business Owner/Executive Solutions
ER/NQ = Employer/Non-qualified
43Distribution
U.S. distribution overview
AFFILIATED THIRD PARTY
PRINCIPAL INVESTMENT- INSURANCE- BANKS
ADVISOR ORIENTED ORIENTED
• Brokerage
NETWORK • Wirehouses General Agents • Banks
• Independent • Broker/
• Regional
Marketing
• 1,200 advisors Broker/Dealers Dealers
Organizations
• Planners • Marketers
• Sell all products • Financial
Advisors/Broker/
• Financial Dealers
Planning
Focused Global Firm Relations
Select 3rd party distributors with dedicated support
STRENGTHENS RELATIONSHIPS AND FUELS SALES GROWTH
WHOLESALE CHANNELS
Investment Retail Disability Group
Retirement Solutions Annuities ESOP NQDC Life Insurance Benefits
All supported by DEDICATED SERVICE TEAMS providing education, training, counseling and retention
44Distribution
Broad and deep distribution
Proprietary provides foundation; 3rd party provides accelerated growth
Product Line New Top 3
1st 2nd 3rd
Sales Represent
NQ Life 42%
Principal
Retail Life Adv isor
Netw ork
62%
Individual Principal
Plus Group Adv isor 33%
Disability Netw ork
Digital
Group Benefits Insurance,
Inc
10%
Principal
Fixed Annuities Adv isor
Netw ork
58%
Variable Annuities Principal
Adv isor
Infinex
Investments, Inc US Bankcorp 98%
Netw ork
Principal
Mutual Funds Adv isor
Netw ork
28%
FSA – New Sales
23%
Assets
FSA – New Sales Principal
30%
Case Counts Adv isor
Netw ork
Rankings and percentages as of 12/31/2018
45Investments
Investment philosophy & strategy
Diversified investment portfolio
Total invested assets & cash
Our strategy hasn’t changed:
Commercial
CMBS
Mortgages High quality, well-diversified portfolio
16%
5% MBS
7%
Liability-driven investment approach
ABS
Corporate 7%
Private Bonds
$90.8B Active asset/liability management
16%
Total invested Government,
Agency, State
assets & cash & Political
Optimized risk adjusted yields and returns
10%
Corporate Other1 Global collaboration and best practices
Public Bonds 12%
25% Cash
2% Portfolio responsibility remains at local country
Total PFG as of 03/31/2019
GAAP carrying value
1 Other includes Equity Securities, Residential Mortgages, Real Estate, Policy Loans, Investment in Equity
46 Method subs, Direct Finance Leases and Other InvestmentsFinancials
Balanced approach to capital deployment
Targeted long-term capital deployment strategy
Capital deployed as a percent of net income
• Capital is deployed to:
Organic - Grow the company
growth Common stock
dividends - Return to shareholders
30-35%
40%
• Every capital deployment
opportunity is evaluated
against a minimum return
of our cost of capital
M&A and share
repurchases
25-30%
47Financials
Balanced capital deployment strategy
Grow capital Return capital Optimize
• Organic growth • Common
capital structure
• Mergers and stock dividends • Financial flexibility
acquisitions (M&A) • Share repurchases
Expect to deploy 65–70% of our net income over the
long-term, with fluctuations in any given year
48Financials
Driving ROE
growth Earnings
+ 4-5% for market
performance
+ 4-5% for growth from
sales/NCF
30-60 bps average + 1-2% operational efficiency
annual ROE ROE =
improvement
Equity
• Organic growth
• Dividend growth
• Opportunistic
share repurchases
49Financials
Acquisition of Wells Fargo Institutional
Retirement & Trust business
• Principal will acquire Wells Fargo’s defined contribution, defined benefit, executive deferred compensation
(non-qualified plans), institutional trust and custody, and institutional asset advisory businesses; expected to
close third quarter 2019
• Brings together two very successful businesses with deep expertise in helping customers achieve their
retirement savings and investment goals
Strategic benefits Transaction details Financial impact4
• Doubles the size of our $1.2B upfront consideration2, When fully integrated in 2022:
retirement business1 funded through: • Annual net revenue of
• Expands scale and • $400-500M in new debt approximately $425M
capabilities in core U.S. • Remainder in cash • Pre-tax return on net
retirement businesses revenue of 28-32%
Earnout of up to $150M3
• Solidifies our footprint in Expected to be accretive to
the SMB market Suspending share buybacks;
net income and non-GAAP
expect to resume no later than operating diluted EPS in 2020
1Q 2020
1 Pro-Forma calculations based upon AUA and participant data as of December 31, 2017 provided by PLANSPONSOR 2018
Recordkeeping Survey and inclusive of shock lapse and new sales assumptions; 2 Net purchase price of $1.05B, reflecting approximately
$150M cash tax benefit from asset acquisition; 3 Earnout payable 2 years post-closing if existing client fee revenue retention exceeds
expectations; 4 Reflects assumed revenue and expense net synergies, excludes transaction and integration costs and earnout liability
accounting.
50Financials
Strengthening our position in the
U.S. retirement market
Becoming the #3 Defined Contribution recordkeeper by participants
18,000 Alight
Conduent
1,600
2,400 BAML
1,400
Schwab
1,200 Wells Fargo
Participants per Plan
Milliman
1,000
Prudential
800
600
T. Rowe Price
Vanguard Principal Fidelity
400
going
John Hancock
Transamerica
TIAA
forward Empower
200 Nationwide Principal
VALIC
MassMutual Voya
0
0 1,000,000 2,000,000 3,000,000 4,000,000 5,000,000 6,000,000 7,000,000 8,000,000 21,000,000
9,000,000
Participants
Source: PLANSPONSOR 2018 Recordkeeping survey. AUA and plan data as of December 31, 2017. Note: Bubble size represents plan assets ($mm).
Principal going forward shown on a pro forma basis – reflects assumed shock lapse and new sales assumptions
51Financials
Increasing our global footprint through M&A
Year
Opportunity Announced Rationale
Enhance our digital capabilities for advisors and
RobustWealth 2018
customers
Increased ownership in our successful joint venture
CIMB-PAM 2018
to 60%
INTERNOS Expand our real estate investment capabilities
2017
in Europe
Strengthen position in Mexico Afore market by
2017
becoming the 5th largest provider
15 year exclusive distribution with 4,440 agents
AXA Hong Kong Pension 2014
Gateway into China
Complete offering in Chile with marquee pension
2012
and savings franchise
Entry into Brazil mutual fund and asset
2012
management market
2011 Enhance global equity investment capabilities
Establish leadership in emerging
2011
52 markets fixed income investingFinancials
Capital deployment
$ in millions
$94 $140
$180
$40
$355
$441 40% of 90% of $599
89% of 65% of
Net Income Net Income Net Income1 Net Income
$465
$193 $540
$257
$650
$275
2015 2016 2017 2018
Deployed $1.1 billion Deployed $856 million Deployed $913 million Deployed $1.4 billion
Common Stock Dividends
Share Repurchases
Strategic Acquisition
Debt reduction
Long term: expect to deploy 65–70 percent of our net income with fluctuations
in any given year
1 2017 net income included benefits from a large real estate transaction and the U.S. Tax Cuts and Jobs Act
53Financials
Capital deployment
$130M $150M
Share repurchases Common stock dividends paid
• $130M - 1Q19 • $150M - 1Q19 ($0.54 per share)
$280M
total capital
deployed
1Q 2019
• Expect to deploy above our guided range of $1.0B to $1.4B of capital in 2019
• Includes $1.2B for the planned acquisition of the Wells Fargo Institutional Retirement and Trust
business that is expected to close in 3Q19, as announced in April
• Announced 2Q19 common stock dividend of $0.54 per share, or $2.15 for 2Q19 TTM;
an 8% increase compared to 2Q18 TTM
• Suspended our share buyback program and plan to resume no later than 1Q20
54Financials
What if things don’t go as expected?
Changes in key macroeconomic conditions have an impact on
Principal’s annual non-GAAP pre-tax operating earnings
If macroeconomics Equity market Interest rates FX: US dollar
change by… return +/- 10% +/- 100 bps changes +/- 2%
Then Principal’s
annual non-GAAP
pre-tax operating +/- 4-6%1 +/- < 1%2 -/+ < 1%3
earnings will change
by…
RIS – Fee RIS – Spread PI
And the primary
businesses PGI Individual Life
impacted are…
SBD
1 Assumes an immediate 10% change in the S&P 500 followed by 2% growth per quarter thereafter. 2 Excludes
the impact of actuarial unlockings. 3 Principal is primarily impacted by changes in Latin American and Asian
currencies. Inverse relationship between movement of the US dollar and impact to Operating Earnings.
Note: The impact to net income attributable to Principal Financial Group, Inc. is materially consistent with the
55 impact to pre-tax operating earnings.Financials
Key business drivers outlook
2019 Long-term 2019 Long-term
Retirement and Income Solutions Principal Global Investors
outlook outlook outlook outlook
Net revenue growth Operating revenues less pass-
(2)-2% 1-5%
CAGR through commissions growth 1-5% 4-7%
RIS-Fee CAGR
Pre-tax return on net
26-30% 28-32%
revenue Pre-tax return on operating
Net revenue growth
revenues less pass-through 34-38% 34-38%
5-10% 5-10% commissions
CAGR
RIS-Spread
Pre-tax return on net
65-70% 65-70%
revenue
2019 Long-term
U.S. Insurance Solutions
outlook outlook
Premium & fees
7-9% 7-9%
growth CAGR
2019 Long-term
Principal International Specialty Pre-tax return on
outlook outlook 12-14% 11-14%
Benefits premium & fees
Combined net revenue growth CAGR 5-9% 11-14% Loss ratio 60-66% 60-66%
(at PFG share, in reported USD)
Premium & fees
4-8% 4-8%
Individual growth CAGR
Combined pre-tax return on net
35-39% 38-43% Life Pre-tax return on
revenue (at PFG share, reported USD) 16-20% 17-21%
premium & fees
Estimated pre-tax operating losses for Corporate anticipated to be above the high end of $300-$320 million in 2019
Total company non-GAAP operating earnings effective tax rate of 16-20% in 2019
Net revenue = operating revenues less benefits, claims & settlement expenses less dividends to policyholders.
RONR = Return on Net Revenue.
56Financials
Non-GAAP financial measure reconciliations
Trailing
Twelve
Months,
Pre-tax Operating Earnings (Losses) 31-Mar-19
Non-GAAP pre-tax operating earnings, excluding Corporate $ 2,222.9
Corporate (286.2)
Non-GAAP pre-tax operating earnings (losses) $ 1,936.7
Pre-tax net realized capital gains (losses) (37.2)
Certain adjustments related to equity method investments and
noncontrolling interest (46.1)
Income (loss) before income taxes $ 1,853.4
57You can also read