Jyske Bank 2018 26 February 2019 - Information for investors and financial ...
←
→
Page content transcription
If your browser does not render page correctly, please read the page content below
Jyske Bank 2018 26 February 2019
Our targets

                                                                                             2018
   Return on Equity
   • Delivering an attractive long-term return on equity of 8-12% excl. IFRS 9 related
     effects                                                                                ROE 8.6%

   • Considering the current market conditions in 2019, Jyske Bank aims to deliver a
     ROE on avg. equity of 6-10% after tax

   Volume 2020
                                                                                            DKK 326bn
   • Total loan portfolio of DKK 350bn in Jyske Realkredit

   Capital position
                                                                                            20.0% and
   • Long-term targets for capital ratio 17.5% and CET1 ratio 14% post-Basel IV               16.4%
     implementation
   • Building sufficient capital level to cover expected Basel IV-effect on capital ratio
     of up to maximum 3 percentage points by January 1st 2022

   • Gradually building a RAC ratio of about 10.5%                                             RAC
                                                                                              10.3%

                                                                                                        2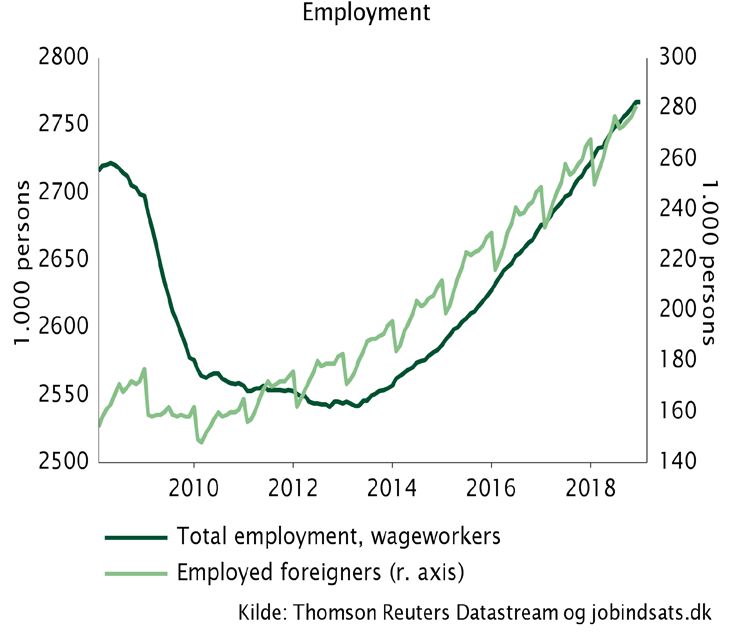
Highlights 2018

                  3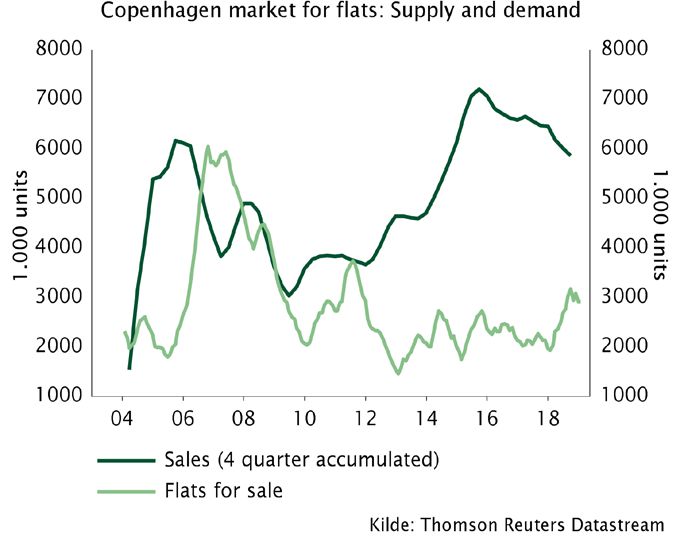
Strategy – foundation and focus areas

                                               Relationship bank in a digital world

                                                            Continuous improvement of
                                                            competitive strength

Continued growth within investment,
trading and wealth

         Sustainable business models for the
         Jyske Bank Group

                                                                                      4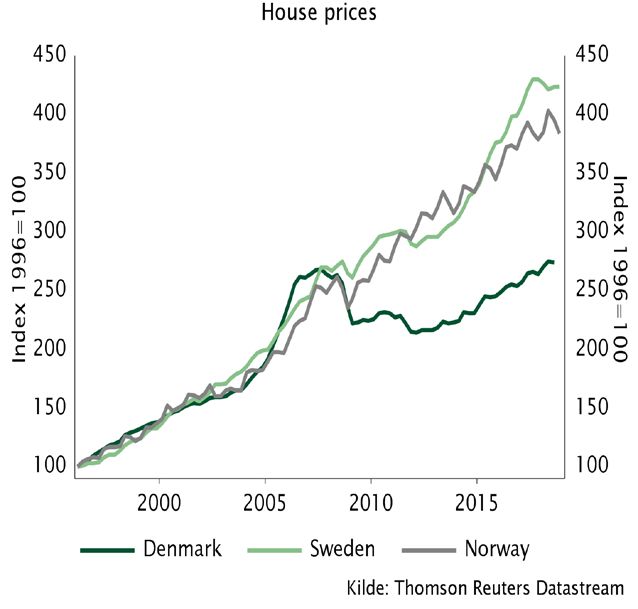
Sustainable business models – also in the future

    •   Global targets for a joint sustainable development have been defined
         –   The Paris Climate Change Agreement
         –   The UN 2030 Agenda for Sustainable Development

    •   Future EU rules (”Sustainable Finance”) is a reflection that the role of the financial sector in social development
        will change to support the agenda of global sustainability

    •   It is Jyske Bank’s ambition to run a business that acts responsibly and promotes sustainability

    •   The focus on sustainability has increased and Jyske Bank wishes through a strong commitment to play a role in the
        transformation of the economy
         –    Will require adjustment and further development of our business models
         –    Launch of an ESG-programme that will, over time, affect all parts of the Group’s activities

    •   Initially, the ESG-programme will focus on:
         –     Activities within trading, investment and wealth management – integrating ESG in advisory services and
               products
         –     External reporting – increase transparency on Jyske Bank’s ESG policies and initiatives and thereby improve
               ESG-ratings

                                                                                                                              5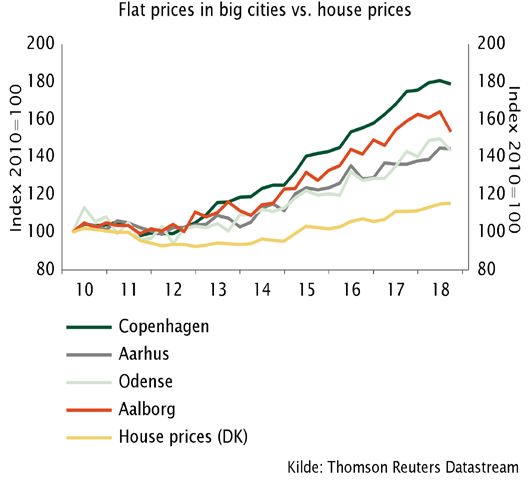
Corporate social responsibility

•   Being one of the largest financial groups in Denmark, Jyske
    Bank has, as a business enterprise, an obligation to society

•   In all respects, Jyske Bank attempts to run a responsible,
    orderly and proper business in accordance with the Group’s
    values and with regard to clients, employees and
    shareholders

•   We wish to create value by ‘making a difference’ for both
    Jyske Bank and society by assessing risks and opportunities in
    long-term perspectives that are forward-looking and
    sustainable

•   Therefore, endeavours are made:
      •   to ensure a sustainable and responsible business
          through advisory services, investments and credit
          policy
      •   to reduce the Group's negative impact on the climate
          and environment
      •   to create a workplace that ensures job satisfaction
          and equal rights for our employees
      •   to assume corporate social responsibility through
          social initiatives focusing particularly on the 'HOUSE’
          (HUSET) and the 'built-up area'

                                                                     6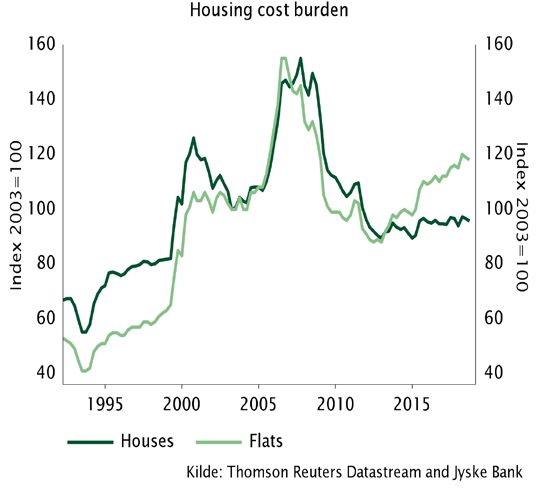
Financials
  2018
2018 highlights
• Net profit of DKK 2,500m, equal to ROE 7.6%
      ― Excl. IFRS9 effects net profit of DKK 2.8bn and ROE of 8.6%     Core profit and profit for the period
                                                                        DKKm
                                                                                                                                     Index                           Index
Business volumes:
                                                                                                                     2018    2017    18/17 Q4 2018 Q3 2018           Q4/Q3
       ― Compared to 2017 loan growth in all segments except for        Net interest income                          5,624   5,674      99       1,371       1,407      97
           bank loans for private individuals                           Net fee and commission income                1,854   1,957      95        506         443      114
       ― AUM slightly down vs. 2017 as a result of negative             Value adjustments                              -23    577            -     -49        132        -
           development in the financial markets                         Other income                                  463     207      224         32         127       25
       ― Stable bank deposits                                           Income from operating lease (net)              81      -54           -      8          26       31
                                                                        Core income                                  7,999   8,361      96       1,868       2,135      87
                                                                        Core expenses                                4,896   5,374      91       1,232       1,249      99
• Core income:
                                                                        Core profit before loan impairment charges   3,103   2,987     104        636         886       72
      ― NII favourably affected by growth in loan volumes but           Loan impairment charges                       468    -453            -     29         104       28
          lowered by decrease in NII from strategic ALM                 Core profit                                  2,635   3,440      77        607         782       78
      ― Net fee income suffers as investment related fee income is      Investment portfolio earnings                 505     562       90         -11         -20      55
          reduced by negative development in financial markets          Pre-tax profit                               3,140   4,002      78        596         762       78
      ― Value adjustments negatively affected by widening of credit     Tax                                           640     859       75         95         184       52

          spreads, lower long-term interest rates and negative          Profit for the period                        2,500   3,143      80        501         578       87

          development in financial markets
      ― Other income boosted by sale of properties                      Summary of balancesheet, end of period
                                                                        DKKbn
                                                                                                                                     Index                           Index
•   Core expenses decline to DKK 4,896m – down by 9% compared to                                                     2018    2017    18/17 Q4 2018 Q3 2018           Q4/Q3
    2017. Down 2% adjusted for one-offs                                 Mortgage loans                                326     307      106        326         319      102
       ― Lower number of FTE compared to 2017                           Traditional bank loans                        104     101      103        104         105       99
       ― Positive effect of DKK 151m (reversal of Marrache provision    New home loans                                  6      12       50          6           9       67
           and one-off adjustment of employee-related provisions) vs.
           negative one-offs of DKK 237m in 2017 (50th anniversary,     Bank deposits                                 136     140       97        136         137       99

           Marrache-provision and severance pay)
                                                                        Assets under management                       141     145       97        141         147       96

•   Loan impairment charges amount to DKK 468m
       ― DKK 61m excl. IFRS 9 effects

                                                                                                                                                         8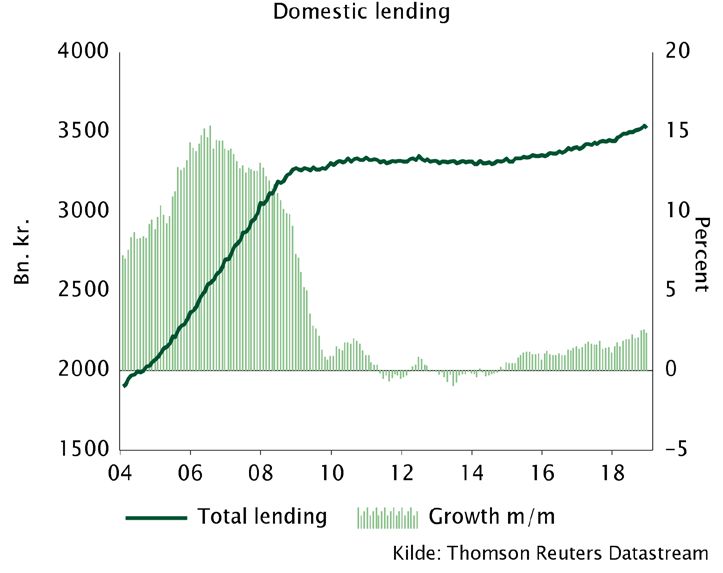
ROE remains under pressure

                                                                           Net profit
                                                                             3,500                                                                                      14%
 • Net profit in 2018 of DKK 2,500m and ROE of 7.6%

                                                                      DKKm
                                                                             3,000                                                                                      12%
 • Excl. effect of IFRS 9 net profit of DKK 2,817m corresponding
   to ROE of 8.6% in 2018                                                    2,500                                                                                      10%

                                                                             2,000                                                                                      8%

                                                                             1,500                                                                                      6%

                                                                             1,000                                                                                      4%

                                                                              500                                                                                       2%

                                                                                0                                                                                       0%
                                                                                        2014              2015            2016           2017             2018

                                                                                          Profit            ROE (after tax)         Roe after tax excl. IFRS9 effects

 •   A decrease of 2.1 and 1.1 percentage points in ROE after tax            2018 vs. 2017: Development in ROE after tax
     incl. and excl. IFRS 9 effects due to:
                                                                     12%
         • Core income decrease as all income lines apart from
            other income are under pressure                          10%

         • Decrease in core expenses primarily due to lower FTE      8%
            and positive one-offs
         • Higher loan impairment charges – 2017 was                 6%

            characterized by net reversals of impairments
                                                                     4%
         • Investment portfolio earnings at 2017-level due to gain
            on Nordjyske Bank shareholding                           2%

         • Effects derived from IFRS 9                               0%
                                                                                2017      Core       Core      Loan   Investment   Tax   2018 excl.   IFRS9      2018
                                                                                        income     expenses impairment portfolio           IFRS9
                                                                                                              charges   earnings

                                                                                                                                                      9
Underlying development in NII stable …

                                                                                      Q4 2018 vs. Q3 2018: Development in NII
… but overshadowed by decline in NII from strategic balance and risk
management and trading activities                                                     1,450

                                                                               DKKm
                                                                                      1,400
                                                                                      1,350
• In Q4 2018 NII is:                                                                  1,300
      • Supported by:                                                                 1,250

             • Loan growth in mortgage and leasing activities                         1,200
                                                                                      1,150
      • Pressured by:
                                                                                      1,100
             • Lower NII from strategic balance and risk management as well
                                                                                      1,050
               as trading activities                                                  1,000
             • Lack of loan growth in banking activities                                       Q3 2018      Volumes &            Strategic        Misc        Q4 2018
                                                                                                           margins - loans     balance and
             • Continued margin compression on corporate bank loans                                                            risk mgmt &
                                                                                                                             capital markets

                                                                                      Q4 2018 vs. Q4 2017: Development in NII
                                                                                      1,550
• Negative variance of DKK 166m compared to Q4 2017 as:

                                                                               DKKm
                                                                                      1,500
      • Q4 2017 included one-offs of approx. DKK 100m
                                                                                      1,450
      • NII from strategic balance and risk management and trading
        activities are significantly lower – combination of smaller bond              1,400

        holdings and lower interest income from derivatives but also because          1,350
        up-front fees on swaps are recognised as value adjustments as                 1,300
        opposed to NII since Q3 2018 (approx. DKK 15m per quarter)                    1,250
      • Support from loan growth in all segments is outweighed by margin              1,200
        pressure                                                                              Q4 2017    One-offs Q4 Strategic        Volume &       Misc      Q4 2018
                                                                                                             2017     balance and     margins -
                                                                                                         (+banking, - risk mgmt &     loans and
                                                                                                           leasing)      capital       deposits
                                                                                                                         markets

                                                                                                                                                         10
Net fee income dampened by financial markets
• Net fee income in Q4 2018 of DKK 506m – up by 14% relative to Q3 2018 Fee income split by type
and down by 22% relative to Q4 2017 800 800
DKKm
• Q4 seasonality in investment related fee income negatively
600 600
affected by the development in financial markets: no
performance related fees and reduced AuM-driven fee income 400 400
• Higher refinancing activity in Q4 supports fee income from
200 200
mortgage activities
• Up-tick in Other fees primarily driven by annual account fees and 0 0
Q4 2017 Q1 2018 Q2 2018 Q3 2018 Q4 2018
market maker commission
Performance related fee income Securities trading and safe-custody services
Other fees and commissions Guarantee commission
Loan application fees Money transfers and card payments
Net fee income (rhs)
• Net fee income of DKK 1,854m vs. DKK 1,957m in 2017 – down by DKK
Fee income by type
103m: 3,000 3,000
• Negative effects: Performance related fees down by DKK 47m
DKKm
(2017: DKK 70m vs. 2018: DKK 23m), and approx. DKK 40m less in 2,000 2,000
commission income from mutual funds as commission rates have
been reduced. Paid fees up by DKK 45m – primarily related to
1,000 1,000
leasing activities (linked to activity level)
0 0
• Positive effects: Increase in a number of fees, primarily fees, 2014 2015 2016 2017 2018
Performance related fee income Securities trading and safe-custody services
which were subject to fee changes in the personal client area in
Other fees and commissions Guarantee commission
mid-2017 as well as one-off in Q1 2018 related to market maker Loan application fees Money transfers and card payments
commission (DKK 10-15m) Net fee income (rhs)
11Value adjustments back in negative territory
Value adjustments under core income
• Value adjustments under core income amounted to DKK -49m – down by
150
DKK 181m compared to Q3 2018 due to:
DKKm
100
• DKK 79m in one-offs in Q3 2018 re. early redemption of issued
bonds and effects of implementation of Murex
50
• Widening of credit spreads which affected the value
adjustments of the Group’s bond and liquidity portfolio
0
adversely
• Negative developments in the financial markets
-50
• Value adjustments from clients’ transactions relating to interest-rate
-100
hedging (swaps): Q4 2017 Q1 2018 Q2 2018 Q3 2018 Q4 2018
— Q4 2018: a positive effect of DKK 19m (Q4 2017: DKK 10m)
— 2018: DKK -6m vs. 2017: DKK 134m
Strategic balance and risk management (DKKm)
• Strategic ALM and risk management is comprised of a liquidity bond Q4 2018 Q3 2018 Q2 2018 Q1 2018 Q4 2017
portfolio as well as derivatives used for hedging purposes. Overall, Net interest income 32 63 75 72 87
limited interest rate risk Value adjustments -83 45 -26 -61 -41
• Liquidity portfolio of approx. DKK 31bn end of Q4 2018, consists Banking activities, total -52 108 49 11 46
primarily of Danish mortgage bonds
Net interest income 18 20 24 21 -
• NII negatively affected by run-off of high yield bonds and lower Value adjustments -28 -9 -41 -19 -
interest income from derivatives Mortgage activities, total -10 11 -17 2 -
• Value adjustments negatively affected by widening of credit Jyske Bank Group, total -61 119 32 13 46
spreads and pull-to-par effects
12Core expenses reduced by one-offs in Q4 2018
Q4 2018 vs. Q3 2018 Development in core expenses (Group)
1,300
DKKm
• Core expenses in Q4 2018 at DKK 1,232m – down by DKK 17m
1,250
compared to Q3 2018 due to:
1,200
• Lower number of FTEs
1,150
• One-offs in Q4 2018 – DKK 65m reduction re. employee costs
1,100
related adjustments
• Higher IT-related costs 1,050
1,000
Q3 2018 Lower avg One-offs IT costs Misc Q4 2018
number of employee
FTEs expenses
Q4 2018 vs. Q4 2017: Development in core expenses
• Core expenses in 2018 of DKK 4,896m vs. DKK 5,374m in 2017 – down 1,350
DKKm
by 9% 1,300
• Underlying development -2% when adjusting for one-offs 1,250
1,200
• Lower number of FTE is the primary driver for the underlying
1,150
development
1,100
1,050
1,000
Q4 2017 One-offs employee Misc Q4 2018
expenses
13Impairment charges driven by corporates
• Net impairment charges of DKK 468m under core profit:
Loan impairment charges (under core profit)
― Excl. IFRS 9 effects DKK 61m
500
― Underlying development primarily driven by corporate clients
DKKm
400
― In general, fewer reversals than in 2017 – most significantly in
agriculture, manufacturing and real property 300
200
― In Q4 2018 impairment charges of DKK 154m for agriculture –
primarily related to management estimate covering fur 100
farmers 0
• Total balance of management’s estimate of DKK 511m end of Q4 -100
2018, of which DKK 275m relate to agriculture compared to DKK -200
466m and DKK 75m respectively end of 2017 Q4 2017 Q1 2018 Q2 2018 Q3 2018 Q4 2018
Loan impairment charges Impairment charges ex. agriculture
• Impairment ratios (under core profit):
― Impairment ratio for Q4 2018 ~1bp
― Balance of impairment charges DKK 5.6bn corresponding to an Gross loans, advances and guarantees by IFRS 9 stages
accumulated impairment ratio of 1.2%
2018
Gross loans, advances
• Gross loans, advances and guarantees distributed by IFRS 9 stages: and guarantees Impairment charges Impairment ratio
End Beginning End Beginning End Beginning
• Increase in stage 2 is primarily related to highly Stage 1 449,690 435,426 640 645 0.1% 0.1%
collateralized mortgages, thus expected loss is low and the
Stage 2 27,305 23,290 1,306 1,352 4.8% 5.8%
increase has only limited effect on impairment charges in
Stage 3 10,049 12,843 3,661 4,195 36.4% 32.7%
stage 2
Total 487,044 471,559 5,607 6,192 1.2% 1.3%
• Gross loans in stage 3 of DKK 10bn covered by accumulated
impairment charges of DKK 3.6bn as well as DKK 6.9bn of
collaterals
14Asset quality - Group level
Portfolio by types (total portfolio excl. repo loans)
• Overall, growth in loan volume of 3% 100% 4% 4%
― Excl. repo loans growth in loan volume of 4% 90%
26% 24%
― Growth driven by loans for corporate clients, primarily 80%
mortgage loans 70%
60%
50%
• Development in loan book composition:
40%
• Increasing share of mortgage loans 70% 72%
30%
• Stable in terms of client segments and internal ratings 20%
• Increase in Real property (due to growth in mortgage 10%
loans) but otherwise no significant shifts in composition 0%
by industry 2017 2018
Mortgage loans Bank loans Guarantees
Client segment DKKbn %
Public authorities 9.1 2
• Non-performing loans* end of 2018: Private individuals 225.8 50
Corporate clients 220.4 48
• Non-performing loans DKK 11.2bn corresponding to NPL Total - all client segments 455.3 100
ratio of 1.5% Corporate clients by industry DKKbn %
• Impairment charges DKK 3.9bn corresponding to NPL Agriculture, hunting, forestry and fishing 8.0 4
Manufacturing, mining etc. 8.5 4
coverage ratio of 34.8% (does not include collateral)
Energy supply 5.0 2
Building and construction 6.2 3
Commerce 13.9 6
Transport, hotels and restaurants 6.5 3
Information and communication 1.1 0
Finance and insurance (ex repo loans) 7.1 3
• For further details on asset quality please refer to appendices Real property 145.7 66
Other sectors 18.4 8
Total - corporate clients 220.4 100
* Defintion follows EBA technical standard 15Limited exposure to agriculture
Agriculture excl. fishing (DKKm/%)
Loans, advances and Balance of impairment
• Limited exposure as agriculture excl. fishing accounts for approx. 1% Impairment ratio
guarantees charges
of the Group’s loans and guarantees 2018 2017 2018 2017 2018 2017
• Impairment ratios at a lower level end of 2018 than end 2017 Milk 848 917 437 529 34% 37%
Pigs 1,616 1,161 264 329 14% 22%
• Except fur farming where the ratio has increased
Plants 2,050 1,758 122 122 6% 6%
significantly due to drop in sales prices for mink pelts and
structural challenges Fur farmers 186 274 108 14 37% 5%
Other agriculture 1,384 906 132 92 9% 9%
• Fur farming: After a long period of sales prices equivalent to the Total 6,083 5,016 1,063 1,085 15% 18%
contribution margin (approx. 250 DKK/pelt), prices on mink pelts
Note: The increase in loan volume can be attributed to Jyske Erhvervslån. At the end of Q4
collapsed during 2H 2018 2018, Jyske Erhvervslån amounted to DKK 2.2bn vs. DKK 0.6bn end of 2017
• Mink farmers are now challenged on capital robustness as
well as more structural price and demand issues driven by an Commodity prices
increased worldwide focus on ESG/sustainability. The 800
challenges may lead to close downs
DKK/pelt
600
• Balance of impairment charges include a management estimate of 400
DKK 275m end of Q4 2018 vs. DKK 75m end of Q4 2017. Covering for 200
effects of:
0
• Drought during the summer of 2018 2011 2012 2013 2014 2015 2016 2017 2018 2019
Mink Source: dst.dk
• Lower sales prices for pelts
• Commodity price development: 4 13
• Mink pelt prices have decreased significantly and reached a 3.5 12
DKK/kg
DKK/kg
new low in 2019 of 141 DKK/pelt 3 11
• Pork prices continue down and have reached a low level of 2.5 10
8.3 DKK/kg in January 2019 2 9
• Milk price has recovered compared to Q1 2018 and now stands 1.5 8
at 2.26 DKK/kg 2011 2012 2013 2014 2015 2016 2017 2018 2019
Milk Pigs (r. axis) Source: Arla Foods and Danish Crown
16Investment portfolio earnings close to zero
Investment portfolio earnings , quarterly
• The investment portfolio earnings continue to generate modest returns
500
• Q4 2018 slightly better than Q3 2018 but still adversely affected
DKKm
400
by widening of credit spreads and pull-to-par effects
300
200
• In June 2018, Jyske Bank’s share holding in Nordjyske Bank was 100
disinvested in connection with the merger between Ringkjøbing 0
Landbobank and Nordjyske Bank:
-100
Q4 2017 Q1 2018 Q2 2018 Q3 2018 Q4 2018
• No effect from Nordjyske Bank in 2H 2018, however, positive Profit on investment portfolios
effects from Nordjyske Bank shares of DKK 544m in 1H 2018
Investment portfolio earnings excl. Nordjyske Bank
(DKK188m in Q2 2018 and DKK 356m in Q1 2018)
Investment portfolio earnings, yearly
600
• Changes to the investment portfolio in 2018:
DKKm
• Mortgage activities: Due to changes in intent and mandate, the 500
entire investment portfolio has been reclassified to strategic 400
balance and risk management under core income
300
• Banking activities: The majority of the bond portfolio has been
200
reclassified to strategic balance and risk management (under core
income) 100
0
• In future, investment portfolio earnings will be more moderate as the 2013 2014 2015 2016 2017 2018
-100
portfolio is much smaller than historically and only holds limited
interest rate risk Profit on investment portfolios
Profit on investment portfolio earnings excl. Nordjyske Bank
17Capital and Liquidity
Strong capital position

                                                                                Capital ratios
 • Capital ratio 20.0% and CET1 ratio 16.4% end of 2018 vs. long-term
   targets of 17.5% and 14% post-Basel IV implementation                             25

                                                                              pct
      – Capital structure almost aligned with long-term targets incl.
                                                                                     20
         expected effect of Basel IV
      – Excess capital inclusive of growth and potential acquisitions will           15
         be available for dividend and buy-backs
      – Jyske Bank intends to make stable dividend payments                          10

                                                                                      5
 • Defending and securing a stable S&P rating of A- remains a key priority
      – Based on the FSA's measurement of MREL as well as Jyske Bank's                0
                                                                                              Q4 2017        Q1 2018          Q2 2018        Q3 2018        Q4 2018
        funding plan for the required issues S&P's changed in April 2018
        its view of Jyske Bank's senior ratings to 'positive outlook' from                          Tier 2    Common Equity Tier 1         Hybrid Tier 1

        'stable outlook'
      – RAC ratio of 10.3% end of Q4 2018                                           Capital Distribution (time of announcement)
      – Jyske Bank aims long-term to build a RAC ratio of approx. 10.5%              1,100

                                                                             DKKm
                                                                                     1,000
                                                                                      900

 • Completion of share buy-back programme mid-December 2018 – buy-                    800
                                                                                      700
   back of 3,350,500 shares worth DKK 999,979,615, corresponding to                   600
   3.94% of the share capital                                                         500
                                                                                      400
                                                                                      300
 • Capital distribution since November 2015:                                          200
                                                                                      100
     – Share buy-back programmes of DKK 4.25bn in total                                   0
                                                                                               Q4   Q1   Q2   Q3   Q4   Q1   Q2   Q3   Q4   Q1   Q2   Q3   Q4
     – Dividends of DKK 3.0bn in total (incl. ordinary dividend to be                         2015 2016 2016 2016 2016 2017 2017 2017 2017 2018 2018 2018 2018
        proposed at AGM in March 2019)                                                                             Dividend     Buy-back

                                                                                                                                                       19
Future regulation
Expected fully phased-in capital ratios
• Long-term capital targets based on fully implemented Basel IV
capital requirements: 20
Percent
0.0
– Capital ratio 17.5% and CET1 ratio 14% 18
1.6
– Capital ratios to remain above long-term targets given 16
1.0
upcoming capital requirements 14 1.5
12 2.5
1.0
10
• Basel IV 2.8 Pillar II
Buffer
1.5
8 16.4
– The Basel IV recommendations were announced in December 6
2.0 2.5
2017 4
1.5
Pillar I
1.6
Requiremet
– Jyske Bank expects that the Group’s capital rati will be 2 4.5 4.5
reduced by a maximum of 3 percentage points when Basel IV 0
is fully phased-in Expected fully phased in CRD IV ratios Expected CET1 components required 2018
by 2019 by 2019
– Jyske Bank aims to build the needed capital levels prior to the Min. CET1 requirement AT1 Tier 2
Pillar II requirement Capital Conservation Buffer SIFI Buffer
phasing-in period starting 1 January 2022 Countercyclical buffer
• Minimum requirement for own funds and eligible liabilities (MREL)
– Jyske Bank already fulfills MREL (with old SP bonds and
capital)
– Grandfathering of senior debt (senior preferred) issued prior
to 1 January 2018
– MREL must be fulfilled entirely with contractually
subordinated debt (non-preferred senior) from 1 January 2022
20Liquidity is still ample
Group liquidity buffer
• Liquidity buffer DKK 64bn end of 2018 (DKK 73bn end of 2017) 80
DKKbn
― 91% of the buffer - DKK 58bn - is eligible for repo 70 11%
transactions at central banks (Nationalbanken or ECB) 60 9%
― Cash placements are categorized as intra-day eligible
50
― Large decrease in intra-day eligible as bank deposits
40 63%
decrease and placement of cash from CP-funding proceeds
are less attractive due to increased rates 30 83%
20
10 26%
0 8%
2017 2018
Ultra liquid assets (intra-day eligible) Very liquid assets (eligible) Not eligible assets
• Group’s LCR at 219% by end of 2018 vs. 189% end of 2017
― Primarily comprised of level 1a and 1b assets LCR liquidity buffer
DKK 2.7bn
― The Group operates with an internal minimum target for LCR
of 150% 4%
• New liquidity benchmark based on simplified LCR with 90-days
horizon brought into effect in the FSA’s supervisory diamond 43% DKK 31.3bn
DKK 38bn 53%
― Stands at 171% end of 2018
• Leverage ratio of 5.3% end of 2018 vs. 5.4% end of 2017.
Level 1a Level 1b Level 2a+2b
21The Group has become a frequent EUR issuer
Jyske Bank redemption and call date profile
12
DKKbn
Jyske Bank
• Short term ongoing activities in French CP 10
8
• From 2011 and 2018 the Group issued one senior unsecured
(Preferred Senior) EUR public benchmark a year (focus on 3-5 year 6
maturities)
4
• Going forward, the focus will be on non-preferred senior (”NPS”) 2
issuance
0
2019 2020 2021 2022 2023 2024 2025 2026 2027 >=
• 2 NPS issuances in 2018: 2028
Jyske Bank preferred senior debt Jyske Bank non-preferred senior debt
– SEK 1.75bn (August 2018)
Jyske Bank Tier 2 call date Jyske Bank AT1 call date
– EUR 500m (November 2018)
Maturity profile for SDOs with refinancing risk
45
DKKbn
40
Jyske Realkredit
35
• AAA-rated covered bonds based on 100% Danish primarily residential
30
mortgages
25
• Daily issuance in DKK 20
15
• 4 EUR covered bond benchmarks were issued during 2016- 2017 10
5
• From 2019 EUR will be part of the refinancing/funding ”toolbox” 0
< 3 months 3 months - 1 y 1-2y 2-3y 3-4y 4-5y >5y
Joint-funding EUR loans Joint funding Jyske Realkredit mortgage bonds
Other mortgage loans F1-F10 and RTL F
22MREL overview
Total DKK 58.7bn (31.2 %)
32%
30%
28% Total DKK 52.1bn (27.7%)
8.5% Total DKK 48bn
26% 3.5%
(DKK 16bn) (DKK 6.6bn)
Mortgage
24%
activities
% of Group REA end of Q4 2018
22% loss absorption +
2.6% 6.2%
20% recapitalisation
2.0% (DKK 11.8bn)
18%
1.6%
16% Total DKK 29.8bn (15.8 %)
14%
5.0%
25.5%
12%
20 %
10%
2.8% Total Capital 17.9% Banking activities
Group 16.4% loss absorption +
8% Ratio
loss absorption recapitalisation
6% amount
4% 8.0%
2%
(DKK 33.8bn)
0%
Total capital requirement Current capital and eligible liabilities Expected combined requirement Min. 8 % MREL on total liabilities
Pillar I Pillar II Combined buffer requirement
CET1 AT1 Tier 2
MREL banking activities Capital requirement Jyske Realkredit Jyske Realkredit debt buffer
New Non-Preferred Senior debt Preferred Senior debt > 1 year res. maturity Min. Group MREL requirement (8 % of total liabilities)
• Gradual replacement of old senior preferred with new non-preferred senior (”NPS”)
• Total expected NPS issuance during the period up to end of 2021 is EUR 2.5bn
– The “ice was broken” on the asset class with a 5 year SEK 1.75bn (EUR 170m) NPS end of August 2018
– First NPS in EUR issued in November 2018 (EUR 500m 3 year fixed rate)
– One EUR 500m benchmark a year to be expected in the future
• Use of AT1 issuance to fine-tune the capital targets and the RAC will remain part of the long-term ”management
toolbox”
23Appendices: 1) Jyske Bank in brief and business segments 2) Asset Quality 3) Danish Economy Q4 2018
Jyske Bank in brief

• One of the four large financial institutions in Denmark and a Danish SIFI
     • 3 segments (Banking, Mortgage and Leasing)
     • Estimated market share of 12%
     • Danish play
     • Approx. 865,000 customers
     • Nationwide branch network comprised of 92 personal client branches, 32 corporate branches, 9 Private Banking centres
       distributed between 98 locations
     • Total assets of DKK 600bn and total loans of DKK 463bn of which mortgage loans account for DKK 326bn (71%)

• Strong capital position
     • Long-term capital policy and well-positioned to manage effects of regulatory requirements
     • Capital distribution:
         • 2015 and 2016: DKK 2.25bn (dividend DKK 500m and buy-backs DKK 1.75bn)
         • 2017 and 2018: DKK 4.5bn (dividends DKK 2bn, buy-back DKK 2.5bn)
         • 2019: DKK 500m (ordinary dividend of DKK 6.12 per share to be proposed at AGM in March 2019)

                                                                                                                      25
Jyske Bank in brief
Jyske Bank Group key figures
Profit Shareholders' ROE after Loans and Total
before tax, Net profit, equity at year- tax, average advances, Deposits, assets, Number
DKKm DKKm end, DKKm equity DKKbn DKKbn DKKbn of FTEs
1997 584 443 4,772 9.6% 36.6 41.5 63.1 2,671
1998 710 511 5,173 10.3% 39.7 43.8 76.9 2,772
1999 1,276 897 5,421 16.9% 49.8 49.8 92.6 2,923
2000 1,255 1,083 5,887 19.2% 75.4 52.3 127.4 3,107
2001 890 623 6,174 10.3% 82.5 54.4 133.2 3,418
2002 1,083 511 6,658 8.0% 95.3 59.0 153.2 3,359
2003 1,809 1,284 7,843 17.7% 63.8 63.8 116.4 3,547
2004 1,960 1,407 7,858 17.9% 74.6 68.7 125.2 3,713
2005 2,174 1,701 9,477 19.6% 90.9 79.8 141.6 4,026
2006 2,810 2,134 9,637 22.3% 107.2 88.8 160.7 4,216
2010 1,003 757 13,352 5.9% 114.0 115.8 244.1 3,847
2011 601 493 13,846 3.6% 124.5 127.3 270.2 3,809
2012 851 596 15,642 4.0% 118.6 121.0 258.2 3,574
2013 2,301 1,808 17,479 10.9% 131.4 131.4 262.0 3,774
2014 3,103 3,089 27,561 13.7% 361.8 152.7 541.7 4,191
2015 3,204 2,476 30,040 8.6% 396.2 144.9 543.4 4,021
2016 3,906 3,116 31,038 10.1% 422.4 154.6 586.7 3,981
2017 4,002 3,143 32,023 9.7% 447.7 160.0 597.4 3,932
2018 3,140 2,500 31,786 7.6% 462.8 148.7 599.9 3,698
Average ROE after tax 1997 - 2018 of 11.7%
26Banking activities
Financials
1,600
DKKm
1,400
• Continued growth in bank loans compared to 2017 but stable
1,200
development compared to Q3 2018 1,000
• Minor decrease in bank deposits 800
600
• Decrease in AUM due to negative returns 400
200
• Lower core income and stable core expenses
0
• Impairment charges in Q4 2018 increased by adverse development for Q4 2017 Q1 2018 Q2 2018 Q3 2018 Q4 2018
Core expenses Core income Core profit
agriculture, primarily fur farmers
Business volumes Impairments (Banking)
160 200
DKKm
150
DKKbn
140
100
120
50
100 0
80 -50
60 -100
-150
40
-200
20
-250
0
-300
Q4 2017 Q1 2018 Q2 2018 Q3 2018 Q4 2018
Q4 2017 Q1 2018 Q2 2018 Q3 2018 Q4 2018
Home loans Bank loans Bank deposits Assets under management
Impairments Impairments ex. agriculture
27Mortgage activities
Financials
600
DKKm
500
• Continued growth in volume – both home loans and mortgages for 400
corporate clients 300
• Core income stable compared to Q3 2018 level 200
100
• Stable development in core expenses
0
• Growth in core profit due to reversal of impairments in Q4 2018 Q4 2017 Q1 2018 Q2 2018 Q3 2018 Q4 2018
-100
-200
Core expenses Core income Core profit
Business volumes (Jyske Realkredit A/S, nominal values) Impairments (Mortgage)
325 500
DKKm
DKKbn
320 400
315
300
310
200
305
100
300
295 0
290 -100
285
-200
Q4 2017 Q1 2018 Q2 2018 Q3 2018 Q4 2018
Q4 2017 Q1 2018 Q2 2018 Q3 2018 Q4 2018
Mortgages
28Leasing activities
Financials (Leasing)
160
DKKm
140
120
• Loan volumes continue to increase and support NII
100
• Stable core expenses 80
60
• Decrease in core profit primarily due to impairment charges and
40
lower income from operational leases
20
0
Q4 2017 Q1 2018 Q2 2018 Q3 2018 Q4 2018
Core expenses Core income Core profit
Business volumes - Leasing Impairments
19 50
DKKm
DKKbn
18 40
17 30
16 20
15 10
14 0
13 -10
12 -20
11 -30
10 -40
Q4 2017 Q1 2018 Q2 2018 Q3 2018 Q4 2018 Q4 2017 Q1 2018 Q2 2018 Q3 2018 Q4 2018
Loans
29Mortgages: The portfolio
Distribution of lending portfolio
• 87% of lending to properties with housing purposes 1%
1% 0%
― No loans with swaps to co-operative housing
Owner-occupied (51%)
― No lending to agriculture and other primary 11%
production Vacation homes (3%)
Cooperative (5%)
15%
Private rental (14%)
• Continued increase in lending for the private residential
51%
segment and for the commercial segment Subsidised (15%)
Office & business (11%)
14%
Industry (1%)
• Continued decrease in the share of F1 and F2 mortgages - at 5%
the same time increase in both capped and non-capped 3% Prop.for educ.etc. (1%)
floaters Other Properties (0%)
Development in lending portfolio Development in loan types
100% 90% 100% 55%
6% 6% 10% 10%
90% 5% 4% 12%
2% 4%
34% 31% 30% 30% 31% 5%
80% 88% 80% 21% 18% 52%
21% 16% 15%
70%
60% 18% 16% 16% 15% 86% 60% 49%
20%
50% 37% 35% 34% 34%
39%
40% 84% 40% 46%
30%
51% 54% 53% 53%
20% 46% 82% 20% 43%
33% 35% 35% 34%
10% 29%
0% 80% 0% 40%
Q4 2014 Q4 2015 Q4 2016 Q4 2017 Q4 2018 Q4 2014 Q4 2015 Q4 2016 Q4 2017 Q4 2018
Fixed F3 - F10 F1 - F2
Private Subsidised Commercial Housing purposes (rhs)
Capped Floater Non Capped Floater Interest only (rhs)
30Mortgages: Improved credit quality
Lending in 90-days arrears (per cent of lending) Repossessed properties (DKKm/number)
500 50
1.8%
Value of repossessed proporties (DKKm)
Private
Number of repossessed proporties
1.6%
Commercial 400 40
1.4%
Subsidised
1.2%
300 30
1.0%
0.8% 200 20
0.6%
0.4% 100 10
0.2%
0 0
0.0%
Q4 2014 Q4 2015 Q4 2016 Q4 2017 Q4 2018
Q4 2012 Q4 2013 Q4 2014 Q4 2015 Q4 2016 Q4 2017 Q4 2018
Commercial properties Private properties
# Commercial properties (rhs) # Private properties (rhs)
Yearly realised losses (running year) Loan-to-Value
100% 2% brackets
1% (per cent
1%of lending)
1% 1% 75%
0.5% 4% 3% 2% 2%
Private 10% 10% 9%
90% 12% 11% 73%
Commercial 80% 21% 71%
0.4% 21% 21%
20% 21%
Subsidised 70% 69%
0.3% 60% 67%
27% 28% 28%
50% 25% 26% 65%
0.2% 40% 63%
30% 61%
0.1%
20% 37% 38% 38% 39% 40% 59%
10% 57%
0.0%
0% 55%
Q4 2014 Q4 2015 Q4 2016 Q4 2017 Q4 2018
-0.1%
0%-20% 20%-40% 40%-60% 60%-80%
Q4 2012 Q4 2013 Q4 2014 Q4 2015 Q4 2016 Q4 2017 Q4 2018
80%-100% >100% Avg. LTV (rhs.)
31Bank loans: the portfolio
Loans and guarantees by sector
• Portfolio composition end of Q4 2018: %
― Corporates take up larger proportion, 63% vs. 58% Loans, advances and Balance of loan
Losses
Impairment
end of 2017 as volume grows guarantees impairment charges charges
Q4 2018 Q4 2017 Q4 2018 Q4 2017 Q4 2018 Q4 2018
― Private individuals at 31% compared to 35% end of Public authorities 7% 7% 0% 0% 0% 0%
2017 as majority of new home loans are recognised Agriculture, hunting, forestry and fishing 5% 5% 25% 26% 18% 206%
as mortgage loans (as of 2H 2018) Manufacturing, mining etc. 5% 5% 6% 5% 14% 19%
Energy supply 3% 4% 2% 1% 0% 8%
― Public authorities at 7% Building and construction 2% 2% 2% 2% 4% -5%
Commerce 8% 7% 6% 4% 6% 21%
Transport, hotels and restaurants 3% 2% 3% 2% 0% 22%
Information and communication 1% 1% 1% 1% 1% 7%
• Accumulated impairment ratio total portfolio 3.1%
Finance and insurance (ex repo loans) 20% 19% 15% 17% 4% -27%
― Public authorities 0% Real property 11% 11% 9% 14% 24% -120%
Other sectors 4% 4% 4% 4% 12% 15%
― Corporates 3.5% Corporate clients 63% 58% 72% 76% 83% 145%
― Private individuals 2.5% Private individuals 31% 35% 25% 24% 17% -67%
Unused credit commitments 0% 0% 3% 0% 0% 22%
Total 100% 100% 100% 100% 100% 100%
• Corporates Note: Bank loans, advances and guarantees excl. repo loans. Based on impairment charges
as reported according to IFRS (as opposed to impairment charges under core profit)
― Increase in impairment charges re. agriculture
― Impairment ratio for Q4 2018 13bp
• Private individuals
― Net reversals
― Impairment ratio for Q4 2018 -13bp
32Danish Economy February 2019
Unemployment rate (harmonized)
8 8
7 7
6 6
Percent
Percent
5 5
4 4
3 3
00 02 04 06 08 10 12 14 16
Kilde: Thomson Reuters Datastream
Headlines on the Danish Economy
• We expect the upturn in the Danish economy to continue in 2019
• Low interest rates, increasing house prices and job growth stimulates demand. Export competitiveness
looks healthy
• Gradually the pace of the upturn is likely to decline. Especially, if there is a further slowdown in the
global economy
• Still, we see employment continue up in 2019
• Overall lending growth has turned positive, but is still very modest
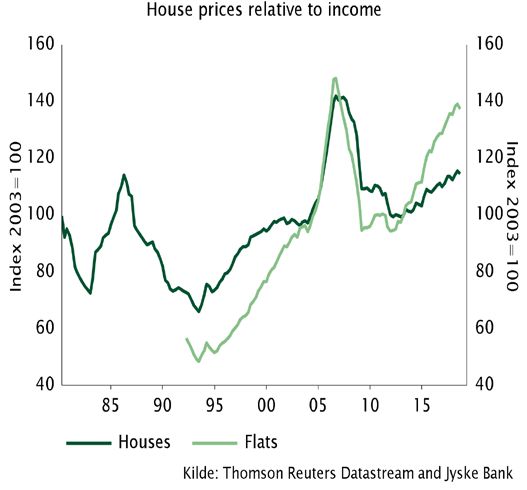
• Surge in prices on flats have stopped
• Upcoming legislation: The tax freeze on housing is abandoned from 2021 reducing risk of housing
bubbles, new Danish FSA measures to limit IO and ARM loans for high DTI household borrowers from
January 2018
• Denmark is a AAA economy with strong structural financial features
34Danish economy – an upturn story
• Overall the Danish financial sector’s operating environment is still improving
• Small setback in growth in 2018 due to weaker export. Still, employment data is solid
The upturn will continue, but slowdown Lending growth is still picking up slowly
Source:
Source:
353 kinds of stimulus support demand
House prices recovering after burst in 08/09 Steady rise in employment
Source:
Source:
Interest rates are at a historic low Consumption is solid, while export slows after sharp upturn
Source: Source:
36Spill-over from recent European weakness
• There is spill-over to Denmark from weaker economic signals out of Europe. But no
significant change in positive overall picture.
Lower sentiment in manufacturing, but no dramatic change
Business confidence
20
105
10
100
0
95
Index
Index
-10
90
-20
85
-30
80
-40
06 08 10 12 14 16 18
Business indicator Danish manufacturing
German Ifo-indicator (r. axis)
Source:
Kilde: Thomson Reuters Datastream
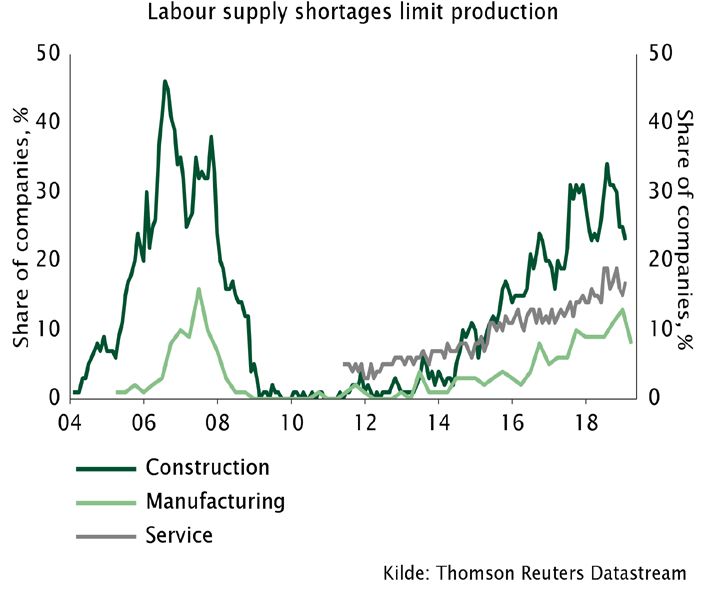
37The labour market performance is strong
• The labour force is increasing from foreign labour supply and a higher retirement age.
Foreign labour accounts for +40 % of rise in employment Lack of labour supply has stopped accelerating
Source:
Source:
38Unemployment rate (harmonized)
8 8
7 7
6 6
Percent
Percent
5 5
4 4
3 3
00 02 04 06 08 10 12 14 16
Kilde: Thomson Reuters Datastream
Improved asset quality
as defaults have normalized
Unemployment is declining Forced house sales below 0.2% per year Business bankruptcies at neutral level
Source: Source: Source:
39Turnaround and consolidation at the same time
• Low interest rates and solid real wage growth make it possible for households to
consume more and save up at the same time
The private sector is saving up …so household debt has declined …and household net assets are large
800 700
700 600
600
% of disp. income
% of disp. income
500
500
400
400
300
300
200
200
100 100
0 0
Netherlands
Slovak Republic*
France
Sweden
Australia
Belgium
Poland*
Germany*
United States
Czech Republic
Greece
Italy
Denmark
Japan
Slovenia
Norway*
Finland
United Kingdom
Canada
* 2015/2016 2017 2009
Source: Source: Source: OECD
40House prices have continued up in all regions
• Widespread, moderate, recovery on housing market
• Large price increases on flats in biggest cities have stopped
• New regulation and a new housing tax model will have a dampening effect in biggest cities
Large differences on the housing market Real house prices are up since 2012 But housing costs are at a moderate level
Source: Source: Source:
Note: First year net payment (incl. installment) on
fixed interest mortgage relative to wages.
41New lending regulation works
• The new regulation is turning down heat on the Copenhagen market
Demand and supply are getting closer Most recent data show peaking flat prices
Source: Source:
42Moderate Danish price increase
in European context
European house prices the past year The development in Scandinavian houseprices
Source: Source:
43Denmark is a AAA economy with strong structural
financial features
Current account surpluses since late 90s ..imply that foreign assets are increasing
Source:
Source:
And public sector debt is low This is why Denmark is AAA
Source: Source:
44Unemployment rate (harmonized)
8 8
7 7
6 6
Percent
Percent
5 5
4 4
3 3
00 02 04 06 08 10 12 14 16
Kilde: Thomson Reuters Datastream
A strong financial position
Net foreign financial assets (2017)
250 250
200 200
150 150
100 100
50 50
% of GDP
% of GDP
0 0
-50 -50
-100 -100
-150 -150
-200 -200
Switzerlands
Norway
Nederlands
USA
Austria
Latvia
Finland
France
Denmark
Poland
Greece
Cyprus
Germany
Spain
Ireland
Japan
Portugal
Belgium
Sweden
Italy
Estonia
Lithuania
Slovakia
United Kingdom
Source: Eurostat and IMF
45Denmark’s economic turnaround
Denmark’s net foreign assets 1960-2018
100 100
80 80
60 60
From start 1990s: Labour
40 market pension schemes 40
20 20
% of NNI
% of NNI
0 0
1982: The peg is
introduced (fully in
-20 -20
60s and 70s: effect from 1986)
-40
Devaluations -40
-60 -60
-80 -80
1960
1962
1964
1966
1968
1970
1972
1974
1976
1978
1980
1982
1984
1986
1988
1990
1992
1994
1996
1998
2000
2002
2004
2006
2008
2010
2012
2014
2016
2018
Source: Danmarks Nationalbank
46Jyske Bank Forecasts as per December 2018
Danish economy 2016-2020
DKKbn Real growth (%)
2017 2016 2017 2018 2019 2020
Private spending 1,017 2.1 2.1 2.3 1.8 1.6
Public spending 536 0.2 0.7 0.4 0.4 0.4
Fixed gross investment 462 7.6 4.6 4.6 1.9 4.4
Inventory investment* 14 -0.1 -0.1 0.0 0.0 0.0
Exports 1,188 3.9 3.6 0.2 3.2 2.3
Imports 1,033 4.2 3.6 3.8 2.9 3.7
Gross domestic product
(GDP) 2,178 2.4 2.3 0.7 1.7 1.2
Current Account
- DKKbn 166 173 127 123 117
- percentage of GDP 7.9 8.0 5.8 5.4 5.0
Public budget balance
- DKKbn -9 23 4 0 0
- percentage of GDP -0.4 1.1 0.2 0.0 0.0
Unemployment
- Gross unemployment, average (thousands) 113 116 108 100 92
- Percentage of the workforce 3.8 3.8 3.5 3.2 3.0
Employment, avg. (thousands) 2871 2919 2972 2999 3018
Inflation (%) 0.3 1.1 0.8 1.2 1.5
Wage index (Private, %) 1.8 1.7 2.3 2.7 3.0
House prices (nominal prices, %) 3.9 4.0 3.8 2.6 2.4
Danmarks Nationalbank’s lending rate, year-end
(%) 0.05 0.05 0.05 0.05 0.05
Danmarks Nationalbank’s CD rate, year-end (%) -0.75 -0.65 -0.65 -0.5 -0.5
* Contribution to growth as a percentage of the preceding year's GDP
Source: Statistics Denmark and Jyske Bank's forecast for 2018, 2019, and 2020
47The Danish economy at a glance
The basics
Citizens: 5.8 million (2019)
Area: 43.098 sq km (0.4 % of USA)
Currency: Kroner (fixed exchange rate policy to the euro) Flexible labour market
Unemployment (latest)
Denmark 5.1 %
Euro Area 7,9 %
Among the rich USA 4.1 %
Denmark 8th richest country in the OECD, GDP (PPP)
per capita (2017)
Open to the world
Exports as % of GDP (2017)
A welfare state Denmark 54.5 %
Total tax revenue as % of GDP (2017) Germany 47.1 %
Denmark 46.0 % (Second highest in the OECD) USA 12,1 %
Germany 37.5 %
USA 27.1 %
A service economy
Production, value added (USA), (2017)
Equal disposable incomes Agriculture 2 % (1 %)
OECD-ranking lowest Gini coefficient (2017 or latest Food products 2 % (1 %)
available) Oil and gas 1 % (1 %)
7. Denmark Manufacturing 13 % (10 %)
15. Germany Construction 5 % (4 %)
31. USA Services etc. 77 % (83 %)
48General legal disclaimer
• This presentation and the information contained therein is furnished and has been prepared solely for information purposes by Jyske Bank A/S. It is furnished for
your private information with the express understanding, which recipient acknowledges, that it is not an offer, recommendation or solicitation to buy, hold or
sell, or a means by which any security may be offered or sold
• The information contained and presented in this presentation, other than the information emanating from and relating to Jyske Bank A/S itself, has been obtained
by Jyske Bank A/S from sources believed to be reliable. Jyske Bank A/S can not verify such information, however, and because of the possibility of human or
mechanical error by our sources, Jyske Bank A/S or others, no representation is made that such information contained herein is accurate in all material respects
or complete. Jyske Bank A/S does not accept any liability for the accuracy, up-to-dateness, adequacy, or completeness of any such information and is not
responsible for any errors or omissions or the result obtained from the use of such information. The statements contained herein are statements of our non-
binding opinion, not statement of fact or recommendations to buy, hold or sell any securities. Changes to assumptions may have a material impact on any
performance detailed. Historic information on performance is not indicative of future performance. Jyske Bank A/S may have issued, and may in the future issue,
other presentations or information that are inconsistent with, and reach different conclusions from, the information presented herein. Those presentations or the
information reflect the different assumptions, views and analytical methods of the analysts who prepared them and Jyske Bank A/S is under no obligation to
ensure that such other presentations or information are brought to the attention of any recipient of the information contained herein
• Nothing in this presentation constitutes investment, legal, accounting or tax advice, or a representation that any investment or strategy is suitable or appropriate
to your individual circumstances, or otherwise constitutes a personal recommendation to you. This presentation is intended only for and directed to persons
sufficiently expert to understand the risks involved, namely market professionals. This publication does not replace personal consultancy. Prior to taking any
investment decision you should contact your independent investment adviser, your legal or tax adviser, or any other specialist for further and more up-to–date
information on specific investment opportunities and for individual investment advice and in order to confirm that the transaction complies with your objectives
and constraints, regarding the appropriateness of investing in any securities or investment strategies discussed herein
• Jyske Bank A/S or its affiliates (and their directors, officers or employees) may have effected or may effect transactions for its own account (buy or sell or have a
long or short position) in any investment outlined herein or any investment related to such an investment. Jyske Bank A/S or its affiliates may also have
investment banking or other commercial relationship with the issuer of any security mentioned herein. Please note that Jyske Bank A/S or an associated
enterprise of Jyske Bank A/S may have been a member of a syndicate of banks, which has underwritten the most recent offering of securities of any company
mentioned herein in the last five years. Jyske Bank A/S or an associated enterprise may also have, within the last three years, served as manager or co-manager
of a public offering of securities for, or currently may make a primary market in issues of, any or all of the entities mentioned herein or may be providing, or have
provided within the previous 12 months, significant advice or investment services in relation to the investment concerned or a related investment
• Any particular security or investment referred to in this presentation may involve a high degree of risk, which may include principal, interest rate, index,
currency, credit, political, liquidity, time value, commodity and market risk and is not suitable for all investors. Any securities may experience sudden and large
falls in their value causing losses equal to the original investment when that investment is realized. Any transaction entered into is in reliance only upon your
judgment as to both financial, suitability and risk criteria. Jyske Bank A/S does not hold itself out to be an advisor in these circumstances, nor does any of its staff
have the authority to do so.
49You can also read