Savings Banks Group Investor presentation - February 2018
←
→
Page content transcription
If your browser does not render page correctly, please read the page content below
Savings Banks Group

   Investor presentation
        February 2018
Disclaimer

This presentation has been prepared solely for use at this presentation. By attending the meeting where this presentation is made, or by reading the presentation slides, you agree
to be bound by the following limitations.

This presentation does not constitute or form part of and should not be construed as, an offer to sell or issue or the solicitation of an offer to buy or acquire securities of Sp
Mortgage Bank Plc (the “Company”), in any jurisdiction or an inducement to enter into investment activity. No part of this presentation, nor the fact of its distribution, should
form the basis of, or be relied on in connection with, any contract or commitment or investment decision whatsoever. If any such offer or invitation is made, it will be done so
pursuant to separate and distinct documentation in the form of a prospectus, offering circular or other equivalent document (a "prospectus") and any decision to purchase or
subscribe for any securities pursuant to such offer or invitation should be made solely on the basis of such prospectus and not these materials.

This presentation has been prepared solely for use in connection with the presentation of the Company. The information contained in this document is strictly confidential and is
being provided to you solely for your information and cannot be distributed to any other person or published, in whole or in part, for any purpose. It may not be reproduced,
redistributed, passed on or published, in whole or in part, to any other person for any purpose. Failure to comply with this and the following restrictions may constitute a violation
of applicable securities laws. No representation, warranty or undertaking, express or implied, is made as to, and no reliance should be placed on, the fairness, accuracy,
completeness or correctness of the information or the opinions contained herein. None of the Company or any of their respective affiliates, advisors or representatives shall have
any liability whatsoever (in negligence or otherwise) for any loss howsoever arising from any use of this presentation or its contents or otherwise arising in connection with the
presentation.

These materials are not intended for distribution to, or use by any person or entity in any jurisdiction or country where such distribution or use would be contrary to local law or
regulation. In particular, these materials (a) are not intended for distribution and may not be distributed in the United States or to U.S. persons (as defined in Regulation S) under
the United States Securities Act of 1933, as amended and (b) are for distribution in the United Kingdom only to (i) investment professionals falling within Article 19(5) of the
Financial Services and Markets Act 2000 (Financial Promotion) Order 2005 (the “Order”) or (ii) persons falling within Article 49(2)(a) to (d) (“high net worth companies,
unincorporated associations etc”) of the Order.”

Investors may get back less than they invested. The Company gives no assurance that any favourable scenarios described are likely to happen, that it is possible to trade on the
terms described herein or that any potential returns illustrated can be achieved.

This document offers no investment, financial, legal, tax or any other type of advice to, and the Company has no fiduciary duties towards, any recipients and therefore any such
determination should involve, inter alia, an assessment of the legal, tax, accounting, regulatory, financial, credit and other related aspects of the securities or such transaction.
The Company makes no representation nor gives any warranty as to the results to be obtained from any investment, strategy or transaction, nor as to whether any strategy,
security or transaction discussed herein may be suitable for recipients’ financial needs, circumstances or requirements. Recipients must make their own assessment of such
strategies, securities and/or potential transactions detailed herein, using such professional advisors as they may require. No liability is accepted for any direct or consequential
losses arising from any action taken in connection with or reliance on the information contained in this document even where advised of the possibility of such losses.

                                                                                                                                                                                     2
Agenda

 I     Introduction to Savings Banks Group

 II    Operating environment

 III   Group structure and Amalgamation

 IV    Strategy and operations

 V     Key financials

 VI    Funding overview

VII    Sp Mortgage Bank

                                             3
Introduction to Savings
     Banks Group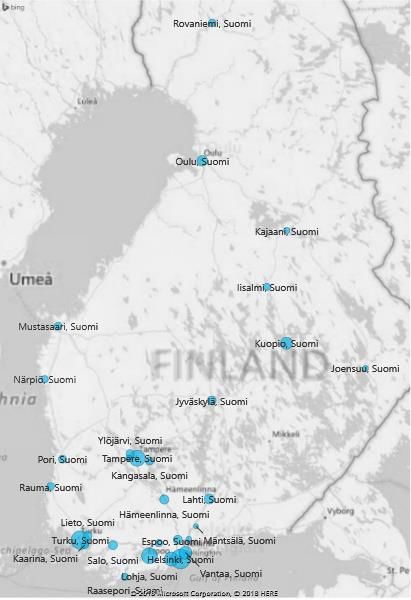
Strong financial performance in 2017
                                                        Positive development in earnings
                                                                  160
                                                                  140
•    In 2017, the Savings Banks Group reported
                                                                  120
     its best result in the Group’s history:                      100

                                                  EUR million
                                                                   80
      –   Earnings before taxes increased by                       60
          26.7% and total assets by 8.7% from                      40
          2016.                                                    20
                                                                    0
      –   The growth was widely spread across                                 2013*        2014*         2015          2016           2017

          the product with net interest income,                                    Net interest income      Earnings before taxes

          net commission income as well as              Growth without compromising capital adequacy
          net income from life insurance and
                                                                  12 000                                                                     25%
          investment were all showing positive
                                                                  10 000
          development.                                                                                                                       20%
                                                                   8 000
                                                                                                                                             15%
      –   There was also positive development
                                                    EUR million
                                                                   6 000
          in assets under management which                                                                                                   10%
                                                                   4 000
          increased by 21% during 2017.
                                                                   2 000                                                                     5%

                                                                        0                                                                    0%
                                                                                 2013*     2014*      2015           2016       2017
                                                                            Total assets    Leverage ratio (rhs)        Total capital ratio (rhs)

                                                                   *2013 and 2014 figures are from the time before the Savings Banks Amalgamation
                                                                   commenced its operations on 31 December 2014.

                                                                                                                                                    5
Summary of the Savings Banks Group
                   • The Savings Banks Group is the oldest banking group in Finland consisting of 23 Savings Banks as well as entities providing
                      products and services to the Savings Banks
                   • The Group has close to 500,000 customers and about 150 branch offices across Finland
The Savings        • The main focus is on retail customers which comprise 75% of lending and is predominantly in form of mortgages. Other target
Banks Group           groups include SMEs (18% of lending) and agricultural customers (7% of lending)
                   • The Group has close to a 5% market share in household lending and close to a 6% market share in household deposits. The
                      market shares have been growing steadily over the past years
                   • In 2017, the Savings Banks Group had on average 1,343 employees
                   • The 23 Savings Banks, Central Banks of Savings Banks Finland (CBSBF), Sp Mortgage Bank (SPMB) and their central institution
The                   Union Co-op together with certain other product and service companies form the Amalgamation of Savings Banks (as laid down
Amalgamation          in the Amalgamations Act)
of Savings Banks   • Under the Amalgamations Act, the Savings Banks, CBSBF, Sp Mortgage Bank and the Union Co-op are jointly liable for each
                      others’ debts and commitments

                   • Total assets were EUR 11.3bn at the end of 31 December 2017. The Group’s profit before taxes amounted to EUR 88.2m and
                      return on equity was 7.3%.
                   • High quality loan book of EUR 7.8bn consists mainly of residential mortgages & low loan loss impairments of 0.17% at the end of
Solid financial       December 2017
position           • Large and stable deposit base of EUR 6.4bn comprises the largest part of the Group’s funding
                   • Strong capital position reflected by a CET1 ratio of 18.2% and a total capital ratio of 19.1% at the end of 31 December 2017
                   • Solid leverage ratio of 8.8% at the end of 31 December 2017 (Tier 1 Capital / Total Liabilities)
                   • S&P Global Ratings has assigned ‘A-/A-2’ long- and short-term counterparty credit ratings to CBSBF, the entity responsible for
                      senior unsecured financing of the Group. The outlook on the ratings is stable. As the central credit institution CBSBF’s ratings
                      reflect the wider Group's franchise and creditworthiness
Funding &
                   • Sp Mortgage Bank is responsible for issuance of covered bonds within the Group and issued cover bonds are rated ‘AAA’ by S&P
Ratings               Global Ratings
                   • The 100% Finnish prime mortgage cover pool is well diversified, with a majority of the pool located in growth centers and their
                      close proximity. The pool has no non-performing loans and has average LTV of 58.5% at the end of December 2017

                                                                                                                                                         6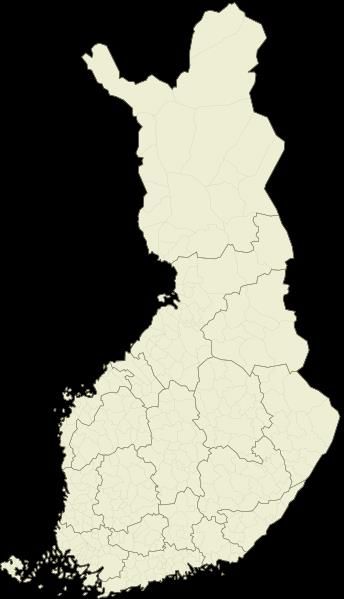
The Savings Banks Group operates countrywide

•    A group of 23 financially solid Savings Banks as well as collectively
     owned product and service companies.

•    The Group operates across Finland and offers its customers a
     complete package of financial products and services.

•    477,000 customers, with main focus on private customers (75% of
     lending), small and medium sized businesses (18%) and agricultural
     and forestry customers (7%).

•    Established player in the Finnish market with EUR 11.3bn of total
     assets and a loan book of EUR 7.8bn.

•    Solid financial profile with a CET1 capital ratio of 18.2% and a
     leverage ratio of 8.8%.

•    Savings Banks’ customers have access to:
      • About 150 branches - 3rd largest branch network in Finland.
      • An advanced online and mobile banking platform.

•    A part of the European Savings Banks network (ESBG).
      • Representing 887 savings banks in 21 countries.

                                                                             7
Operating environment
Strong recovery in 2016-18 and gradual convergence
   to balanced growth path from 2019 onwards

Finland                                                                          2016       2017f     2018f             2019f
                                                                                                                                  •   Broad-based economic
                                               2016                                        YoY, % change                              recovery likely to extend to
GDP*                                           EUR 215.6bn                         2.1         3.1       2.7               2.0        2018 - GDP growth remains
Exports*                                                                           2.3         8.0       6.5               4.0        close to 3%.
Imports*                                                                           5.4         2.5       3.5               3.0
Private Consumption*                                                               1.8         1.8       1.6               1.3
                                                                                                                                  •   Surprisingly strong
Public Consumption*                                                                1.2         0.4       0.4               0.3        acceleration in employment
Gross Public Fixed Investment*                                                     3.9         1.0       2.1               0.9        growth is the key driver
Gross Private Fixed Investment*                                                    7.8         9.0       4.5               4.0        behind the improved
                                                                                                                                      economic outlook.
Unemployment rate**                                                             8.8%          8.6%         8.1%          7.7%
Consumer price index YoY**                                                      0.4%          0.8%         1.4%          1.5%     •   The level of government
Current account balance/GDP**                                                  -1.4%         -1.2%        -1.3%         -1.3%         gross debt is stabilizing and
General government deficit/GDP**                                               -1.8%         -1.2%        -1.3%         -0.8%         expected to fall below 60%
Government Gross Debt/GDP                      Finland**                       63.1%         61.1%        60.2%         59.2%         of the GDP by 2019.
                                               Euro area***                    91.1%         89.3%        87.2%         85.2%
                                                                                                                                  •   The current government
Source: Statistics Finland, * forecasts Savings Banks’ Union Coop, ** forecasts Ministry of Finance, Economic forecast 12/2017,
*** European Commission, Autumn 2017 forecast                                                                                         agenda focuses on
                                                                                                                                      productivity growth, labor
                                                                                                                                      market reforms and
                                                                                                                                      reducing of structural
                                                                                                                                      deficit.

                                                                                                                                                              9
Finland no longer underperforming
Annual GDP growth exceeding 3% level since Q2/2017
“In our view, economic
recovery and further
structural reforms will
enhance Finland's
growth and external
performance and, in
turn, public finances.”
S&P Global Ratings’
Rating Report for
Finland, September
2017
10Employment growth accelerated markedly in the
second half of 2017
• Job creation accelerated in the
second half of 2017, which
significantly speeded up the
growth in the total
employment.
• The government’s employment
rate target of 72% is likely to be
achieved by the end of the
current electoral term.
• The labor market is set for
further improvements in 2018
as companies continue to
invest in their production
capacity and domestic demand
remains strong.
11Household debt remains contained
Unemployment below Euro area average
Household debt as % of net disposable income* Unemployment rates, %
• Finnish household debt in relation to income remains low in the Nordic comparison.
• Unemployment rate in Finland remains higher than in the other Nordic countries but is below the Euro
area average. The decline in the Finnish unemployment is expected to gain more momentum in 2018.
*2017 figures for Norway and Sweden are Macrobond forecasts
12Moderate house price development in Finland
House price development in Finland vs. selected other countries • House prices in Finland have
remained stable over the past years
and have increased only modestly in
comparison to Norway and Sweden
over a 12-year period.
• Low interest rate level is supportive
of the housing market, as most of the
Finnish mortgage loans carry a
variable interest rate.
• The outlook for 2018 and beyond is
stable. Prices are expected to
increase on average by 1% to 2%,
however, with some geographical
differences.
• Housing market development is
strongly linked to the employment
situation, consumer confidence and
functioning of the financial markets.
13Stable price development across the country
Price index of old dwellings in housing companies Housing prices, rents and earnings
• House price development has continued as relatively stable across the country. Differences between growth
centers (especially Greater Helsinki area) and countryside are, however, significant.
• Over the past years house prices have increased at a clearly slower pace than rental prices.
• Household earnings on the other hand have been growing somewhat faster than average house prices.
• For 2018, the housing market is expected to develop in the same direction as during 2017.
14Confidence is a major driver in the housing market
Consumer confidence and intentions to buy a dwelling Old dwellings, transaction volumes (12m ma)
Source: Sp-Koti, HSP
Consumer confidence = Finnish households’ trust on their own economy. The higher the level, the stronger the households’ confidence is on own their economy.
Source: Statistics Finland
15Group structure and Amalgamation
Structure of the Savings Banks Group

                                                                                                        JOINT LIABILITY
                                Member Savings Banks                                                     The member credit institutions in the
                                                                                                         Amalgamation share joint liability for each
                                 Retail banking operations
                                                                                                         others’ debts and commitments
                              Savings Banks’ Union Coop
                                     Strategic steering
                                     Risk management                   100%
                                        Supervision

            Central Bank of
                                                         Sp Mortgage Bank Plc                           THE AMALGAMATION
       Savings Banks Finland Plc
           Central Bank operations                        Mortgage Bank business
                                                                                                         Sp-Fund Management and Savings Bank
                                     94.7%                                         100%                  Services Ltd are part of the Amalgamation but
                                                                                                         not part of the joint liability since they are not
         Sp-Fund Management                                                                              member credit institutions
                                                       Savings Bank Services Ltd
             Company Ltd
             Fund management                                Back Office company    100%
                                     92.6%

                                                                                                        THE SAVINGS BANK GROUP
 Sb Life Insurance Ltd                 Sp-Koti Oy                 Säästöpankkien Holding Oy              The Group includes also product companies
     Life insurance                  Real estate agency                  Strategic holdings
                                                                                                         jointly owned by the Savings Banks as well as
                                                                                               80.1%
                      81.2%                               100%
                                                                                                         the associated company Samlink which do not
                                                                                                         belong to the Amalgamation but are
                                 Associated company                                                      consolidated to the Group
                                             Samlink
                                                          42%
                                                                                          Ownership %

                                                                                                                                                    17
The Amalgamation of Savings Banks
• The Amalgamation of Savings Banks is an amalgamation defined in the Act on the Amalgamation of
Deposit Banks (“Amalgamations Act”, Laki talletuspankkien yhteenliittymästä 599/2010).
• Under the Amalgamation Act, the Union Coop as the central institution has the obligation to supervise
the operations of the member credit institutions and issue instructions to them on risk management,
good corporate governance and internal control to secure liquidity and capital adequacy, as well as
instructions on compliance with uniform accounting policies in the preparation of the amalgamation's
consolidated financial statements.
• The Union Coop may confirm general operating policies for the member credit institutions to be followed
in their operations that are significant for the Amalgamation.
• The minimum capital requirement and liquidity of the companies within the Amalgamation of Savings
Banks is controlled on a consolidated basis.
18Investors’ position is stronger in the Amalgamation
Joint liability
• The Amalgamation improves investors’ position because the liability for repayment of debt does not lie
with an individual entity but within the central institution and the member credit institutions in
accordance with the Amalgamations Act.
• The Amalgamation is based on the principle that it is a stable and permanent structure. In practise, it acts
like one operator without being a conglomerate.
• Under the Amalgamations Act, the central institution and the member credit institutions are jointly liable
for each others’ debts and commitments:
– The central institution is liable to pay, as a support measure, to any of its member credit institutions
an amount that is necessary to prevent that member credit institution from being placed in
liquidation.
– Each member credit institution shall be liable to pay to the central institution, in proportion to their
last adopted balance sheets, the amount paid by the central institution.
– Furthermore, upon insolvency of the central institution, a member credit institution shall have
unlimited refinancing liability for the central institution's debts.
• In the Amalgamation of Savings Banks the joint liability currently comprises 23 Savings Banks, CBSBF, Sp
Mortgage Bank and the Union Coop (the central institution).
19The Amalgamation brings synergies
Economies of scale enhances our growth strategy
PARTNERSHIPS
CBSBF &
Savings Sp
Banks Mortgage
LOCAL Bank GLOBAL
• Customers • External counterparties
• Business • Funding
• Stakeholders Union Coop • Credit rating
Product and
service (Central
companies institution)
REGULATION
AUTHORITIES
20Early intervention model
Prevents a bank from going in a wrong direction at an early stage
• The Union Co-op oversees the Group’s
The Act on the Amalgamation of liabilities and reports to the regulator,
Deposit Banks Finnish FSA.
• For decision making and prevention of any
The bylaws of the Savings savings bank in the Group from going to a
Banks’ Union Coop wrong direction, there is an additional
internal framework and an early intervention
model which have been agreed and adopted
The Internal operational within the Group.
principles
(No legal requirement for these • CBSBF and Sp Mortgage Bank fully benefit
principles) from the joint liability based on the Act on
the Amalgamation of Deposit Banks. In
The Early Intervention addition, covered bond investors benefit
from the ring-fencing of the assets in its
model Cover Pool.
21Strategy and operations
On a positive track reaching our goals
Best customer satisfaction Solid financial profile High brand awareness
The best customer satisfaction and Profitable and solvent—sustainably Good reputation and
recommendation rate in the sector growing and capable of bearing appealing brand
risks
2017: Savings Banks Group 2017: Improved profitability and 2017: Among the most valued
in top 2 stable capital adequacy banking brands in Finland
More and more Finns choosing us as Reliable investment option with a The best workplace that attracts
their primary bank good credit rating leading multitalents of the digital
age
2017: Close to 30,000 new 2017: Rating upgraded to A- by 2017: Focus on quality and
clients, most being families S&P volume of employee education
23We offer a complete service package
Savings and investments Daily banking Financing Insurance
Savings accounts and Branch and online Mortgage loans Life insurance
fixed term deposits services • Sp Mortgage Bank • Sp-Life Insurance
• Savings Banks • Savings Banks Company
Balance sheet lending
Funds and asset Debit and credit cards • Savings Banks Non-life insurance
management • Savings Banks • Finnish P&C
• Sp-Fund Management • Central Bank of Lifestyle protection Insurance Company
Company Savings Banks insurance
• Sp-Life Insurance Statutory
Saving and life insurance ATMs and cash services Company pension insurance
• Sp-Life Insurance • Several service • ELO Pension
Company providers Leasing ad hire purchase Insurance Company
• Siemens Financial
Book-entry securities Clearing and settlement Services
• Savings Banks • Central Bank of
• SEB Savings Banks Trade Finance
• Danske Bank
Securities trade
• Account operator
Central Bank of
Savings Banks
• Broker S-Bank
24Consistent market share growth
Market share development of the Savings Banks Group in different segments*
7
6
31.12.2011
5
31.12.2012
31.12.2013
4
31.12.2014
%
31.12.2015
3
31.12.2016
31.12.2017
2
1
0
Deposits Mutual Funds Savings insurances ** Loans
Source: The Bank of Finland
* Market shares including households and non-profit organisations
**Market share for mutual funds is including funds which are registered in Finland and excluding funds which are in Savings Banks’ own investments
25Diversified client base and loan book across Finland
30 largest regions represent 60% of mortgage loans Complete loan book well diversified across Finland
As of December 2017 As of December 2017, including municipalities with more than 1,000 clients
26Loan portfolio with good credit quality
Loan exposure by collateral type (Dec 2017) Private customers / non-performing loans and loans in arrears
2% 3% Residential collateral (real
estates, shares of 1,60%
residential housing)
22 % Other real estate 1,40%
collaterals, other shares is
housing company or real 1,20%
estate company
Deposits, securities and
guarantees 1,00%
73 % 0,80%
Uncollateralized
0,60%
Loan portfolio development 0,40%
0,20%
9,00
8,00 0,00%
7,00
6,00
5,00
EUR billion
4,00 Private customers. Non-performing loans of total lending
3,00
Loans in arrears 30-89 days of total lending
2,00
1,00 Sp Mortgage Bank. Loans in arrears 30-89 days of total lending
0,00
Dec 2016 June 2017 Dec 2017
Sp Mortgage Bank does not have any non-performing loans
Private customers SME and agriculture
27Balancing between margins and growth
Margin development vs. Finnish banking sector Net interest margin* of the Savings Banks Group
2,0 3,5
1,8
3,0
1,6
1,4 2,5
1,2
2,0
%
% 1,0
1,5
0,8
0,6 1,0
0,4
0,5
0,2
0,0 0,0
Jun-17
Jun-10
Jun-11
Jun-12
Jun-13
Jun-14
Jun-15
Jun-16
Dec-10
Dec-11
Dec-12
Dec-13
Dec-14
Dec-15
Sep-16
Dec-16
Dec-17
Mar-10
Sep-10
Mar-11
Sep-11
Mar-12
Sep-12
Mar-13
Sep-13
Mar-14
Sep-14
Mar-15
Sep-15
Mar-16
Mar-17
Sep-17
Jun-11
Jun-13
Jun-10
Jun-12
Jun-14
Jun-15
Jun-16
Jun-17
Mar-10
Sep-10
Dec-10
Mar-11
Sep-11
Dec-11
Mar-12
Sep-12
Dec-12
Mar-13
Sep-13
Dec-13
Mar-14
Sep-14
Dec-14
Mar-15
Sep-15
Dec-15
Mar-16
Sep-16
Dec-17
Mar-17
Sep-17
Dec -17
Savings Banks Finnish banks Average lending rate Average deposit rate Difference
Source: The Bank of Finland *Lending and deposits rates include both household and corporate customers
• In the challenging market conditions, the Savings Banks Group has been able to maintain competitive pricing and
still continue to grow.
28Key financials
The Savings Banks Group’s key figures

                                         FY 2017                              FY 2016                              FY 2015                             FY 2014

   Profit before tax                   EUR 88.2m                            EUR 69.6m                            EUR 69.7m                           EUR 63.1m

   Net interest
                                      EUR 142.2m                           EUR 131.7m                           EUR 125.0m                          EUR 122.0m
   income

   Cost-to-income                         64.7%                                64.4%                                63.4%                               64.2%

                                    Amalgamation:                        Amalgamation:                        Amalgamation:                       Amalgamation:
   Capital
   adequacy                      - Total capital 19.1%                - Total capital 19.5%                - Total capital 18.8%               - Total capital 18.6%
                                     - CET1 18.2%                         - CET1 18.5%                         - CET1 17.8%                        - CET1 16.9%

   Leverage ratio*                         8.8%                                 9.1%                                 9.2%                                9.0%

   Loans and
                                       EUR 7.8bn                            EUR 7.0bn                            EUR 6.4bn                           EUR 5.9bn
   advances

   Total assets                       EUR 11.3bn                           EUR 10.4bn                            EUR 9.2bn                           EUR 8.4bn

   Personnel                              1,343                                1,270                                1,230                               1,161

   *The leverage ratio has been calculated according to the known regulation, and it describes the ratio of the Amalgamation’s Tier 1 capital to total liabilities.

                                                                                                                                                                       30
Strong underlying business performance
Income statement FY 2017 FY 2016 Change, % FY 2015
EUR 1,000
Net interest income 142,176 131,693 125,018
Net fee and commission income 79,159 71,428 68,850
Net trading income 3,156 -56 -1,350
Net investment income 39,065 17,809 20,526
Net life Insurance income 15,552 11,810 15,178
Other operating revenue 3,083 12,692 2,309
Total operating revenue 282,191 245,376 15.0% 230,531
Operating expenses -182,693 -168,792 -156,865
Net impairment loss on financial assets -13,265 -8,411 -6,127
Associate’s share of profits 1,977 1,430 2,160
Profit before tax 88,210 69,603 26.7% 69,699
Taxes -16,316 -12,406 -12,080
Profit 71,894 57,197 25.7% 57,619
31Strong capital adequacy and capital base
• The capital position of the Amalgamation of Savings
Banks was at a very strong level at the end of June Own funds (EUR million) 31.12.2017 31.12.2016 31.12.2015
2017. Common Equity Tier 1 (CET1) before
969.7 915.7 849.8
• The capital base is predominantly consisting of adjustments
common equity – CET1 ratio was 18.2% and total Regulatory adjustments to CET1 -30.6 -27.8 -25.3
capital ratio 19.1%. Common Equity Tier 1 (CET 1) capital 939.1 887.9 824.5
Additional Tier 1 (AT1) capital 0 0 0
• Tier 2 capital base amounted to EUR 45.5 million Tier 1 capital (T1 = CET1 + AT1) 939.1 887.9 824.5
and total capital base was EUR 984.6 million. Tier 2 (T2) capital before regulatory
45.5 48.7 44.8
• The current capital requirement for the adjustments
Tier 2 capital 45.5 48.7 49.7
Amalgamation is 11% consisting of:
Total capital (TC = T1 + T2) 984.6 936.6 874.3
• Statutory minimum capital adequacy
requirement of 8%. Capital ratios 31.12.2017 31.12.2016 31.12.2015
• Capital conservation buffer of 2.5% according Common Equity Tier 1 ratio, % 18.2 % 18.5 % 17.8 %
to the Act on Credit Institutions. Tier 1 ratio, % 18.2 % 18.5 % 17.8 %
• 0.5% Pillar 2 requirement set by FIN-FSA. Total capital ratio, % 19.1 % 19.5 % 18.8 %
• In May 2017, the Finnish Stability Authority set a
minimum requirement of own funds and eligible
liabilities (MREL) at Amalgamation level and this
requirement will be applied starting from 31
December 2018.
• Capital adequacy will be kept at strong levels also
going forward.
32Capital requirement driven by credit risk
• The Amalgamation’s credit risk and
Capital base (EUR million) 31.12.2017 31.12.2016 31.12.2015 31.12.2014
market risk for currency position are
calculated using the standard model. Total capital base 984.6 936.6 874.3 814.3
Operational risk capital requirement is
Capital requirements for credit risk 368.2 340.0 327.8 304.9
calculated with the basic method.
Capital requirement for CVA 5.8 7.9 8.4 9.9
• Major part of the capital requirement
comes from credit risk (89% at 31 Capital requirement for market risk 3.2 2.8 3.8 3.8
December 2017).
Capital requirement for operational risk 36.1 33.7 31.5 31.0
• The Amalgamation has no trading Total capital requirement 413.3 384.4 371.5 349.5
activity for own or customers’
Capital buffer
account. The member credit (after 8% minimum capital requirement)
571.3 552.2 502.8 464.8
institutions may have a so-called small
trading book as defined in article 94 of
the CRR.
• Capital requirement for market risk is
based on the currency risk, calculated
by combined positions from the
member banks.
33Funding overview
Funding vehicles of the Group
Savings Banks Group • Sp Mortgage Bank is the covered
bond funding vehicle of the
Group.
• CBSBF is the Group’s liquidity,
clearing and optimising centre,
Central Bank of Savings Banks Finland Sp Mortgage Bank offering a full-range of treasury
(CBSBF) (SPMB) services for the Group:
responsible for the Savings
Banks Group’s liquidity and
senior unsecured funding
for growth.
Senior
EBA ECB Covered implements the Savings
unsecured
clearing operations bonds
funding Banks Group’s liquidity
strategy.
Short-term
funding
operates in the money and
capital markets.
is the lender of last resort in
the Group.
Counterparties Investors Capital markets
35Liquidity reserve portfolio of the Savings Banks Group
Composition of liquid assets after haircuts, 31 December 2017
3% 1% 1% • CBSBF is responsible for liquidity
management of the Group including
14 % management of the total LCR on behalf
Central bank reserves of the Savings Banks and the
Government bonds Amalgamation.
Covered bonds
Notes and coins • Amalgamation’s LCR components
Corporate bonds
Liquid assets: EUR 1.272 million
81 %
Net outflows: EUR 960 million
LCR: 133%
36Balanced and diversified funding base
Amalgamation’s funding base, as of 31 December 2017 Amalgamation’s expected funding base, by end 2018
1% 2% 1% 2%
11 %
11 %
Debt to credit institutions Debt to credit institutions
Retail deposits Retail deposits
14% 12 %
Wholesale deposits Wholesale deposits
Cd's Cd's
Senior unsecured 6% Senior unsecured
3% Covered bonds Covered bonds
2%
3% Subordinated loans Subordinated loans
66 %
66 %
• In 2017, the Group’s net funding from the capital markets increased by EUR 500 million, consisting of
one benchmark covered bond issuance.
• During 2018, net capital market funding is expected to remain unchanged. However, due to maturing
funding there will be new senior issuance for EUR 300 million.
• During 2019-2020, net capital market funding is expected to amount to EUR 750 million with gross
issuance amounting to EUR 1.4 billion due to maturing senior funding.
37Contemplated transaction and indicative terms
Central Bank of Savings Banks Finland
Issuer
• Central Bank of Savings Banks Finland is
contemplating an issuance of a EUR-
Type Senior unsecured, unsubordinated denominated sub-benchmark Senior
Expected Issue Rating A- (S&P)
Unsecured FRN transaction with a 3-
year maturity.
Maturity 3 years
• The company is meeting fixed income
Size Sub-benchmark investors on 26th and 27th February and
a transaction will follow, subject to
Coupon Floating
market conditions.
Documentation The Issuer’s EMTN Programme
• Deutsche Bank, LBBW and Nordea have
Law English Law been mandated as lead managers.
Listing Irish Stock Exchange
Denominations EUR 100,000 + 100,000
Lead Managers Deutsche Bank, LBBW, Nordea
38Sp Mortgage Bank
Sp Mortgage Bank in brief

•   Sp Mortgage Bank Plc is the covered bond funding vehicle of Savings Banks Group
•   Licensed by the European Central Bank to issue covered bonds according to the Finnish covered bond
    legislation (Covered Bond Act (688/2010) or CBA)
•   Sp Mortgage Bank’s sole purpose is to raise funding for Savings Banks Group by issuing covered bonds with
    mortgage collateral
•   Sp Mortgage Bank is 100% owned by the Savings Banks in the Group
•   The covered bonds issued are rated AAA by S&P and are ECB eligible
•   In addition to the joint liability, investors in the covered bond will benefit from the ring-fenced structure of
    the cover pool. Sp Mortgage Bank benefits fully from the joint liability based on the Act on the
    Amalgamation of Deposit Banks

                                                             Sp Mortgage Bank’s covered bond programme complies
                                                             with European Covered Bond Council’s (ECBC) Covered
                                                             Bond Label

                                                             Read more about ECBC Covered Bond Label at www.coveredbondlabel.com

                                                                                                                            40
Sp Mortgage Bank - Operating model and roles
Borrowers
23 Savings Banks – Origination of loans, Servicing
Savings Bank’s Central Bank of
Union Co-op Savings
Business Banks Finland
Development Short-term liquidity
Support functions provider
Sp Mortage Bank
Support functions
Mortgage lender
Savings Banks Covered bond issuer
Services Ltd
Back office servicing
Swap
Investors counterparties
41Cover pool characteristics as of 31 December 2017
Pool size EUR 1,485.2 million
Collateral 100% Finnish prime mortgages
Geographical distribution Throughout Finland, a majority in growth centers and their close proximity
Average loan size EUR 92,100
Number of loans 16,133
Average LTV (indexed/unindexed) 58.5% / 58.4%
Average seasoning 33.1 months
Non-performing loans / loans in arrears 0 bp / 5 bps
Interest base 99.3% variable, 0.7% fixed
Over-collateralisation 48.5%
42Geographically well diversified cover pool
Regional distribution of cover pool and
Finland’s 10 largest cities(2)
• The cover pool is well diversified throughout Finland with a
majority in close proximity to key growth centers.
• Housing price development through the country has been
stable.
Regional distribution of cover pool as of 31 December 2017
3%
Region Major City Region’s Population(1) Mortgages, EUR mn Share of the pool
Uusimaa Helsinki 1,620,261 458 31 %
Varsinais-Suomi Turku 474,323 260 18 % OULU 5%
Pirkanmaa Tampere 506,114 210 14 %
Pohjois-Savo Kuopio 248,129 103 7%
Pohjois-Pohjanmaa Oulu 410,054 80 5%
Kanta-Häme Hämeenlinna 174,710 69 5% 7%
Päijät-Häme Lahti 201,615 61 4% 3% KUOPIO
Satakunta Pori 222,957 JYVÄSKYLÄ
55 4%
Lappi Rovaniemi 180,858 46 3% TAMPERE
Keski-Suomi Jyväskylä 275,780
4%
43 3% 14% 4%
Rest of Finland - 1,172,507 100 7%
TURKU
5% LAHTI
KOUVOLA
TOTAL 5,487,308 1,485 100 %
18%
31%VANTAA
Sources: (1) Statistics Finland: Finnish Regional Population 31.12.2015 HELSINKI
(2) The Association of Finnish Local and Regional Authorities: City population 1.1.2016 ESPOO
43Breakdown of cover pool as of 31 December 2017
LTV distribution Loan distribution by size
Loan balance, EUR thousand
Loan maturity profile Loan balance by origination year
44Underwriting criteria
Sp Mortgage Bank’s • Aligned with the overall credit policy of the Savings Banks Group
credit policy • Complies with the requirements of the CBA
• Customers must be identified and verified, also regarding age and legal capacity
Customer
identification • Customers’ background and financial position must be determined, including both external (credit bureau) and internal
payment defaults
Customer scoring • A customer is application scored every time when applying for a new mortgage
• Customers’ income is always verified
Income verification • For current customers income and source of the income can be checked on bank account details in the bank
• For new customers income is checked by using pay slips and/or taxation information
• A customer must have sufficient repayment abilities for the repayment of the loan
Assessment of the
customer’s
• When calculating customer’s available income for interest and loan management costs exposures to Amalgamation and
other parties are taken into account
repayment ability
• Stress test with a 6% fixed interest rate level and 25 years maximum repayment period
Follow-up
• Existing loan stock is scored on a monthly basis with a scoring model taking into account changes in customers’ payment
behaviour
45Collaterals, loan decision, servicing and collection
Collaterals Loan decision
• All collaterals are located in Finland • Preparation of a loan decision and actual loan
• Only residential purposes (real estates or shares decision must always be done by two separate
in housing companies) persons
• Only prior ranking pledges • Loan-to-Value ratio is max 70% or with a State
Guarantee up to 85%
• Must be valued by a valuer independent of the
credit decision process
• Either valuation maximum of one year old
• Both contract of sale and valuation
certicate Servicing and collection
• Genuine (not between related The originating Savings Banks are responsible for:
parties) recent contract of sale
• Servicing the Mortgage Loans together with the
• Or external qualified valuer Back Office company
• Revaluation quarterly based on the housing index • Collection / foreclosure processes as any non-
data provided by Statistics Finland performing Mortgage Loan is transferred back
to the originating Savings Bank
46Contact details
Kirsi Autiosalo Email: kirsi.autiosalo@saastopankki.fi
CEO, Central Bank of Savings Banks Finland Tel. +358 50 420 0867
Head of Group Funding
Member of Board, Sp Mortgage Bank
Kai Brander Email: kai.brander@saastopankki.fi
Head of Treasury, Central Bank of Savings Banks Finland Tel. +358 50 384 8220
Teollisuuskatu 33
00510 Helsinki
Finland
Read more at www.saastopankki.fi/debtinvestors
47Appendix
Central Bank of Savings Banks Finland rated ‘A- / A-2'
                  S&P Global Ratings Research Update dated April 28, 2017:
                  “We now consider that the Savings Bank Group of Finland, with Sp Central Bank as the group's central
                  credit institution, is operating as a cohesive banking group, demonstrated by a common strategy, unified
                  risk culture, and guidelines. Furthermore in line with its plans, the group has now established access to
                  both secured and unsecured funding, which allows it to resume growth of its lending business after
                  sluggish development due to funding constraints in 2013-2015. We now assess Savings Bank Group's
                  business risk position as moderate, in line with other regional peers operating in the Nordics.”
 A- / A-2
 stable outlook   “The group has started to benefit from its legal and operating setup in place since December 2014, seen in
                  a 10% recorded loan growth in 2016 and stable operating profitability. Organic growth made up about half
                  of the loan growth, mainly driven by retail mortgage lending. The other half resulted from the transfer of
                  the remaining loan assets from Aktia Bank, with whom the group cooperated in covered bond issuance.
                  We expect the transfer of remaining loan assets to be completed by May 2017. “

                  “At the same time, the group has increased its cross-selling activities--especially in life insurance and asset
                  management products—which we expect to lead to an increase in broad-based customers and a more
                  diversified operating revenue base. We expect initiatives to combine the specialized product companies in
                  the heart of the group to further improve the unified product offering. Similarly, the creation of a
                  groupwide joint back office by merging existing back office companies will gradually improve operating
                  efficiency. We expect the improving franchise to boost organic growth and profitability in 2017-2018.”

                  “In addition to the above, the group credit profile (GCP) reflects our 'a-‘ anchor for Finnish banks, and the
                  group's very strong capital and earnings, mainly due to our expectation of an increase in our risk-adjusted
                  capital (RAC) ratio to about 17.5%-18.0% in the next 12-24 months. It equally reflects the group's
                  moderate risk position, due to concentration risks in its loan book, partly mitigated by a high level of
                  collateralization; its average funding and adequate liquidity, owing to sound funding metrics; its sound
                  funding profile, dominated by customer deposits; and its comfortable liquidity position. We assess the
                  unsupported GCP at 'a-'.”

                                                                                                                       49
Act on Mortgage Credit Bank Operations 1/2
• Act on Mortgage Credit Bank Operations (CBA, statute 688/2010)
• Segregation of assets in the bond register (issued covered bonds, collateral, relevant derivative contracts)
• Covered bonds are issued either by specialized mortgage credit bank or any licensed credit institution authorized by
FIN-FSA to engage mortgage credit bank business
• Cover pool can consist of mortgage collateral (both residential and commercial) and public sector loans. LTV for
residential mortgage assets 70% and 60% for commercial mortgages.
• Matching collateral requirements
Total value of the cover pool must exceed the outstanding amount of issued covered bonds
Over-collateralization requirement set as net present value of the cover pool has to exceed that of the covered
bonds by 2%.
• Liquidity requirements
Average maturity of issued covered bonds must not exceed the average maturity of the mortgage loans in the
cover pool
For any 12 month period the accrued interest of the cover pool assets must exceed the total amount payable
for covered bonds and derivative transactions
• Swap counterparties to covered bond programs rank equally with bondholders if the issuer becomes insolvent. This
improves the chances of attracting third-party counterparties to provide hedging for the programs, even after the
issuer defaults.
• Streamlined set-up if the covered bond issuer becomes insolvent. Effective ring fencing of the assets will allow the
dedicated administrator to take charge of the cover pool to repay covered bonds when they fall due
50Act on Mortgage Credit Bank Operations 2/2
• Bankruptcy remoteness and preferential claim
– Covered bond shall be paid until its maturity in accordance with the terms and conditions of the covered bond
from the funds accruing on the cover pool assets of the covered bond before other claims
– Holders of covered bonds together with counterparties of registered derivatives and bankruptcy liquidity loans in
bankruptcy would rank pari passu and in respect of each Mortgage Loan included in the cover pool for a covered
bond, the priority of payment right in accordance with Section 25 of the CBA is limited to a maximum amount
which corresponds to 70% in respect of Housing Loans and to 60% in respect of Commercial Property Loans of
the current value of shares or real estate which stand as collateral
• Post-bankruptcy procedures
– When the issuer has entered into liquidation or bankruptcy proceedings, the FIN-FSA shall, without delay,
appoint a supervisor in accordance with Section 29 of the Finnish Act on the Financial Supervisory Authority to
protect the interests of creditors of covered bonds and creditor entities comparable to such and to enforce their
right to be heard
– In bankruptcy proceedings the courts will by operation of law appoint a bankruptcy administrator to administer
the bankruptcy estate. The cover pool will be run by the bankruptcy administrator, but the supervisor will
supervise the bankruptcy administrator, acting in the interest of the holders of the covered bonds.
– To the extent that claims of the Covered Bondholders in respect of the Covered Bonds are not met out of the
Cover Pool, the residual claims of the Covered Bondholders will rank pari passu with the unsecured and
unsubordinated obligations of the Issuer.
51Thank you! www.saastopankki.fi
You can also read