Presentation of 3Q and YTD Sep 2013 Results
              30 October 2013
←
→
Page content transcription
If your browser does not render page correctly, please read the page content below
Presentation of 3Q and YTD Sep 2013 Results
30 October 2013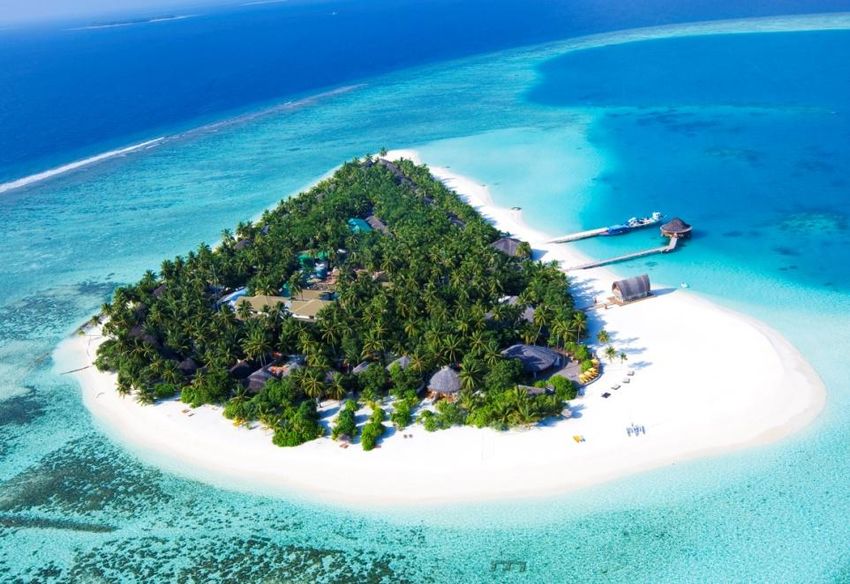
Disclaimer

The value of Stapled Securities and the income derived from them may fall as well as rise. Stapled Securities are not obligations of,
deposits in, or guaranteed by the H-REIT Manager or M&C Business Trust Management Limited, as trustee of CDL Hospitality Business
Trust (the “HBT Trustee-Manager”), or any of their respective affiliates.
An investment in Stapled Securities is subject to investment risks, including the possible loss of the principal amount invested. Investors
have no right to request that the H-REIT Manager and/or the HBT Trustee-Manager redeem or purchase their Stapled Securities while the
Stapled Securities are listed. It is intended that holders of the Stapled Securities may only deal in their Stapled Securities through trading
on Singapore Exchange Securities Trading Limited (the “SGX-ST”). Listing of the Stapled Securities on the SGX-ST does not guarantee a
liquid market for the Stapled Securities.
This presentation contains certain tables and other statistical analyses (the "Statistical Information") which have been prepared by the H-
REIT Manager and the HBT Trustee-Manager. Numerous assumptions were used in preparing the Statistical Information, which may or
may not be reflected herein. As such, no assurance can be given as to the Statistical Information’s accuracy, appropriateness or
completeness in any particular context, nor as to whether the Statistical Information and/or the assumptions upon which they are based
reflect present market conditions or future market performance. The Statistical Information should not be construed as either projections or
predictions or as legal, tax, financial or accounting advice.
Market data and certain industry forecasts used throughout this presentation were obtained from internal surveys, market research,
publicly available information and industry publications. Industry publications generally state that the information that they contain has
been obtained from sources believed to be reliable but that the accuracy and completeness of that information is not guaranteed. Similarly,
internal surveys, industry forecasts and market research, while believed to be reliable, have not been independently verified by the H-REIT
Manager or the HBT Trustee-Manager and neither the H-REIT Manager or the HBT Trustee-Manager makes any representations as to the
accuracy or completeness of such information.
This document may contain forward-looking statements that involve assumptions, risks and uncertainties. Actual future performance,
outcomes and results may differ materially from those expressed in forward-looking statements as a result of a number of risks,
uncertainties and assumptions. Representative examples of these factors include (without limitation) general industry and economic
conditions, interest rate trends, cost of capital and capital availability, competition from other developments or companies, shifts in
expected levels of occupancy rate, property rental income, charge out collections, changes in operating expenses (including employee
wages, benefits and training costs), governmental and public policy changes and the continued availability of financing in the amounts and
the terms necessary to support future business.
You are cautioned not to place undue reliance on these forward-looking statements, which are based on the current view of management
on future events.
This document and its contents shall not be disclosed without the prior written permission of the H-REIT Manager or HBT Trustee-
Manager.

                                                                                                                                                 2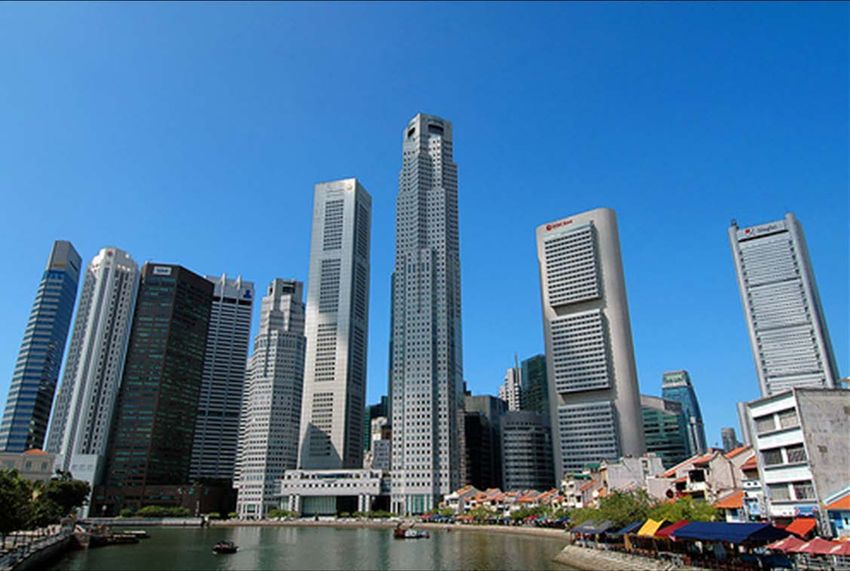
About CDL Hospitality Trusts
CDL Hospitality Trusts is a stapled group comprising CDL Hospitality Real Estate Investment Trust (“H-REIT”),
a real estate investment trust, and CDL Hospitality Business Trust (“HBT”), a business trust. CDL Hospitality
Trusts was listed on the Singapore Exchange Securities Trading Limited on 19 July 2006. M&C REIT
Management Limited is the manager of H-REIT.
H-REIT, the first hotel real estate investment trust in Singapore, is established with the principal investment
strategy of investing, directly or indirectly, in a diversified portfolio of income-producing real estate which is
primarily used for hospitality and/or hospitality-related purposes, whether wholly or partially, and real estate-
related assets in relation to the foregoing.
As at 30 September 2013, H-REIT owns 12 hotels and one resort with a total of 4,420 rooms, comprising six
hotels in Singapore (Orchard Hotel, Grand Copthorne Waterfront Hotel, M Hotel, Copthorne King’s Hotel,
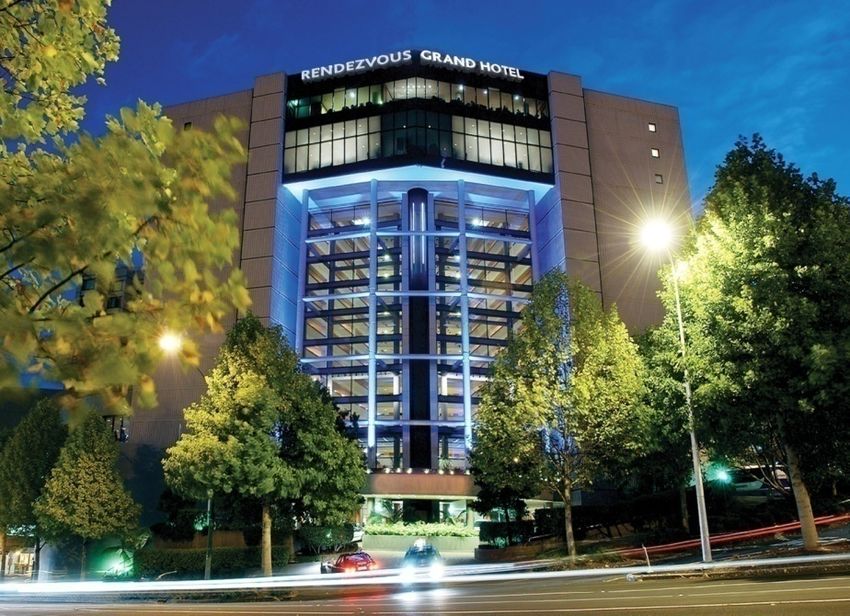
Novotel Singapore Clarke Quay and Studio M Hotel); one hotel in New Zealand’s gateway city of Auckland
(Rendezvous Grand Hotel Auckland); five hotels in Australia’s key gateway cities of Brisbane and Perth
(Novotel Brisbane, Mercure Brisbane, Ibis Brisbane, Mercure Perth and Ibis Perth); one resort located in the
Republic of Maldives (Angsana Velavaru), as well as the shopping arcade adjoining Orchard Hotel (Orchard
Hotel Shopping Arcade) in Singapore.
3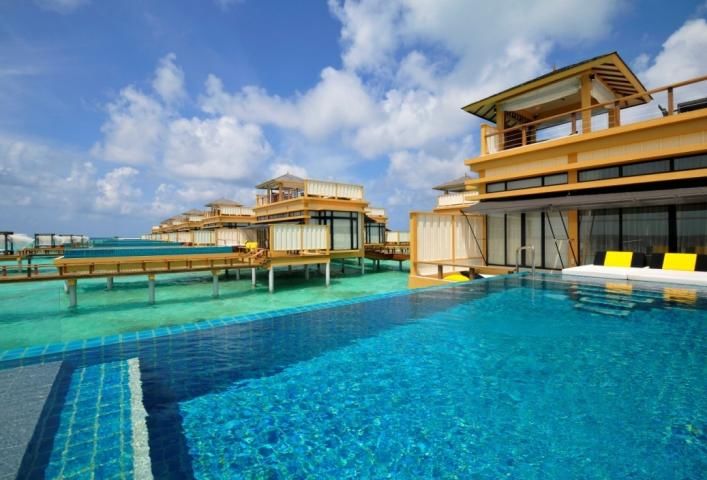
Table of Contents
Highlights

             5
Performance of CDL Hospitality Trusts

                                        10
Healthy Financial Position

                             18
Outlook

          23
Management Strategy

                      31
Annexe 33
Background and Structure
 of CDL Hospitality Trusts

                             33
Information on
CDL Hospitality Trusts Properties

                                    43
4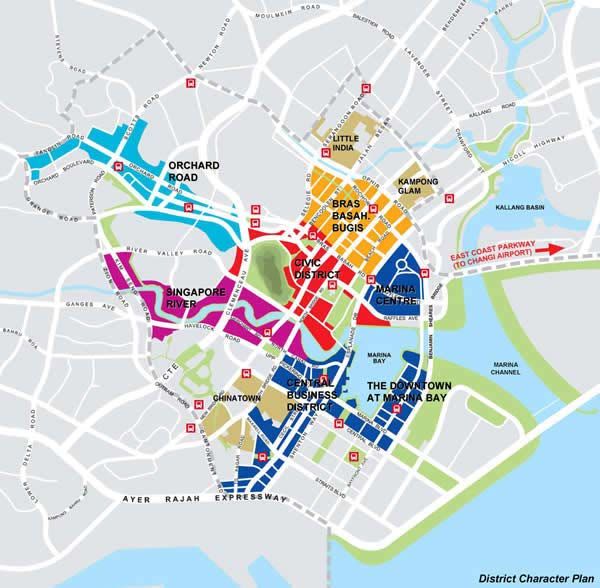
Highlights
5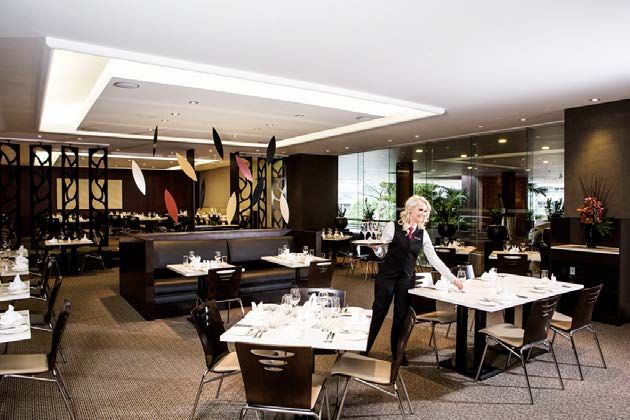
Executive Summary 1
Financial Highlights (3Q 2013)
Gross revenue of S$35.9 million for 3Q 2013 compared to S$36.1 million for the same period last year,
mainly due to:
Lower gross revenue from the Singapore Hotels
Mitigated by a S$1.9 million prorated minimum rent contribution (1) from the Angsana Velavaru, which
was acquired on 31 January 2013
3Q 2013 income available for distribution per Stapled Security of 2.93 Singapore cents (2)
CDLHT Financial Highlights (S$’000) 3Q ’13 3Q ’12 Variance
Gross Revenue 35,860 36,145 -0.8%
Net Property Income 33,039 33,606 -1.7%
Income Available for Distribution
28,566 (3) 29,211 -2.2%
(bef. deducting income retained for working capital)
(1) The gross revenue for the reporting period comprise a prorated minimum rent of US$500,000 per month (based on a current minimum rent of US$6.0 million per annum).
The excess of the income above the minimum rent will only be recognised in the fourth quarter results once the full year performance of Angsana Velavaru is determined.
(2) Represents income available for distribution per Stapled Security (before deducting income retained for working capital). Income available for distribution per Stapled
Security (after deducting income retained for working capital) for 3Q 2013 is 2.64 Singapore cents.
(3) Income available for distribution (after deducting income retained for working capital) for 3Q 2013 is S$25.7 million.
6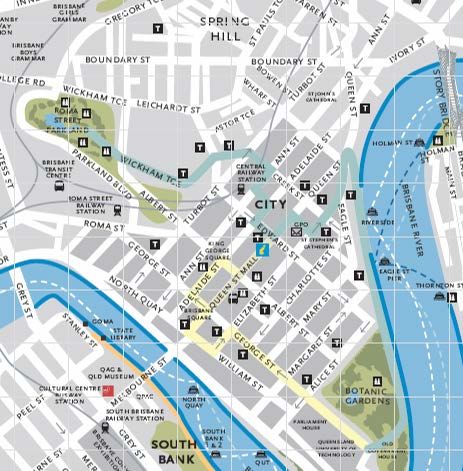
Executive Summary 2
Financial Highlights (YTD Sep 2013)
Gross revenue of S$109.4 million for YTD Sep 2013 compared to S$111.2 million for the same period
last year, mainly due to lower gross revenue from the Singapore Hotels, offset by higher revenue from
the Group's overseas properties
In YTD Sep 2013, CDLHT received a full year’s variable income of S$2.0 million (or A$1.6 million)
from its Australia Hotels as compared to S$1.8 million (or A$1.3 million) recognised in the same
period last year
S$5.0 million prorated minimum rent contribution from the Angsana Velavaru, which was acquired on
31 January 2013
YTD Sep 2013 income available for distribution per Stapled Security of 8.94 Singapore cents (1)
CDLHT Financial Highlights (S$’000) YTD Sep ’13 YTD Sep ’12 Variance
Gross Revenue 109,358 111,200 -1.7%
Net Property Income 100,929 103,731 -2.7%
Income Available for Distribution
86,910 (2) 90,422 -3.9%
(bef. deducting income retained for working capital)
(1) Represents income available for distribution per Stapled Security (before deducting income retained for working capital). Income available for distribution per Stapled
Security (after deducting income retained for working capital) for YTD Sep 2013 is 8.05 Singapore cents.
(2) Income available for distribution (after deducting income retained for working capital) for YTD Sep 2013 is S$78.2 million. 7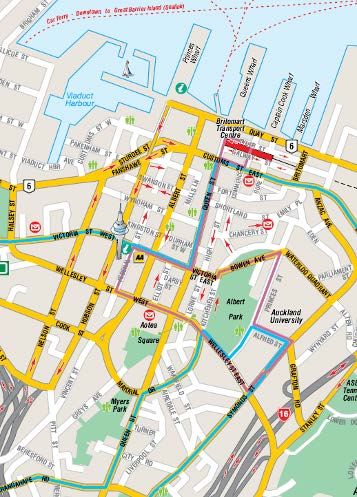
Executive Summary 3
Hotel Performance
Singapore market:
CDLHT Singapore Hotels’ performance was affected by:
Increased competition due to additional new supply of hotel rooms in the market
Reduction in corporate travel budgets due to an uncertain global economy
Overall, occupancies remained relatively high as the Singapore Hotels replaced the reduced
corporate business with leisure business, which was secured at lower rates
Australia market:
CDLHT Australia Hotels in Brisbane and Perth experienced weaker performance during the quarter
due to the slowing Australian economy and the mining sector
Defensive structure of the Australia Hotels provides CDLHT with a high proportion of fixed rent
8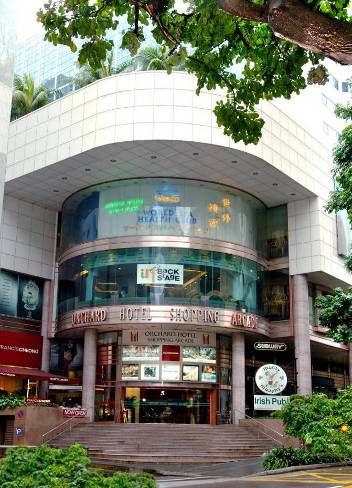
Executive Summary 4
Hotel Performance (con’t)
Maldives market:
Angsana Velavaru has performed well, registering a year-on-year (“y-o-y”) RevPAR growth of 13.9%
for the quarter ended 30 September 2013 (1)
New Zealand market:
Defensive triple net lease structure with fixed rent which escalates at 2.75% per annum
Healthy Gearing
CDLHT’s gearing as at 30 September 2013 is 28.1%
With a robust balance sheet and ample debt headroom, CDLHT will continue to focus on sourcing for
acquisition opportunities in the hospitality sector in the next 12 months
(1) For the purpose of year-on-year comparison, this assumes that H-REIT owns Angsana Velavaru for the three months ended 30 September 2012. 9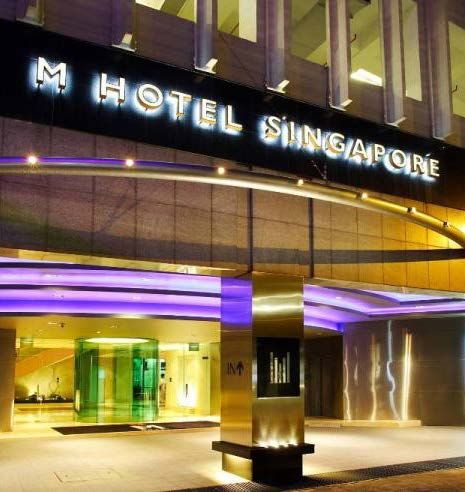
Performance of CDL Hospitality Trusts
10Singapore Hotels Performance
Performance of Singapore Hotels
CDLHT Singapore Hotels’ performance in 3Q 2013 was affected by:
Increased competition due to additional new supply of hotel rooms in the market
Reduction in corporate travel budgets due to an uncertain global economy
Overall, occupancies remained relatively high as the Singapore Hotels replaced the reduced
corporate business with leisure business, which was secured at lower rates
CDLHT Singapore Hotels 3Q ’13 3Q ’12 Variance YTD Sep ‘13 YTD Sep ’12 Variance
Occupancy 87.6% 88.3% -0.7 pp 87.5% 88.6% -1.1 pp
ARR S$218 S$231 -5.6% S$219 S$234 -6.4%
RevPAR S$191 S$204 -6.4% S$191 S$207 -7.7%
11Singapore Hotels Historical Performance Trend
CDLHT Singapore Hotels Quarterly Occupancy, ARR & RevPAR (1) (2)
5 Hotels 6 Hotels S$
100% 255
247 245
250
232 236
224 228
90% 222 220 217
216 215 230 235 236
208 210 207 231
201 205 211 226 224
197 196
191 195 199 194 195 219 220 218
80% 188 207 211 204 200
206
179 176 178 176 181 174 200 199
170 191 193 191
161
70% 151 150 152
134 150
60%
100
50%
85%86%90%89%84%87%86%84%75%75%86%89%84%88%92%90%86%88%89%89%88%89%88%89%87%88%88%
40% 50
1Q'11
2Q'11
3Q'11
4Q'11
1Q'07
2Q'07
3Q'07
4Q'07
1Q'08
2Q'08
3Q'08
4Q'08
1Q'09
2Q'09
3Q'09
4Q'09
1Q'10
2Q'10
3Q'10
4Q'10
1Q'12
2Q'12
3Q'12
4Q'12
1Q'13
2Q'13
3Q'13
Occ (5 Hotels) Occ (6 Hotels) ARR (5 Hotels) ARR (6 Hotels) RevPAR (5 Hotels) RevPAR (6 Hotels)
(1) Singapore Hotels comprise Orchard Hotel, Grand Copthorne Waterfront Hotel, M Hotel, Copthorne King’s Hotel, Novotel Singapore Clarke Quay and Studio M Hotel.
However, Studio M Hotel’s figures were only included from 3Q 2011 as it was acquired on 3 May 2011.
(2) The performance statistics of Singapore Hotels was computed on a pro forma basis for 1Q 2007 and 2Q 2007, assuming that Novotel Singapore Clarke Quay was acquired
on 1 January 2007. 12Overseas Hotels Performance
Performance of Australia Hotels
CDLHT Australia Hotels in Brisbane and Perth experienced weaker performance during the quarter due
to the slowing Australian economy and the mining sector
Fixed rent contribution for 3Q 2013 was S$3.9 million, down from S$4.4 million in 3Q 2012, attributable
to the weakening of the Australian Dollar
Defensive structure of the Australia Hotels provides CDLHT with a high proportion of fixed rent
Performance of Maldives Resort
Angsana Velavaru contributed S$1.9 million in gross revenue for 3Q 2013 and S$5.0 million for the first
eight months (based on prorated minimum rent contribution) after its acquisition on 31 January 2013
The resort has performed well, registering y-o-y RevPAR growth of 13.9% and 22.9% for the quarter and
eight months ended 30 September 2013 respectively (1)
Visitor arrivals for the Maldives grew 17.3% for the first seven months of 2013 compared to the same
period last year (2)
(1) For the purpose of year-on-year comparisons, this assumes that H-REIT owns Angsana Velavaru for the respective periods in 2012.
(2) Tourist Arrivals by Nationality, January – July 2013, Statistics Section, Ministry of Tourism, Arts and Culture, The Maldives, 12 August 2013 13CDLHT Y-o-Y Performance: 3Q ’12 Vs 3Q ’13
Gross Revenue Income Available For Distribution Per Unit (1)
S$ '000 -0.8%
Singapore
40,000 cents
36,145 35,860
3.50
-3.0%
30,000
3.02
3.00 2.93
20,000
3Q '12 3Q '13
2.50
Net Property Income
S$ '000
-1.7% 2.00
40,000
33,606 33,039
30,000
1.50
20,000 1.00
3Q '12 3Q '13 3Q '12 3Q '13
(1) Represents income available for distribution per Stapled Security (before deducting income retained for working capital). The income available for distribution per Stapled
Security (after deducting income retained for working capital) for 3Q 2013 is 2.64 Singapore cents. 14CDLHT Y-o-Y Performance:
YTD Sep ’12 Vs YTD Sep ’13
Gross Revenue Income Available For Distribution Per Unit (1)
S$ '000
-1.7% Singapore
120,000 cents
111,200 109,358
10.00 -4.4%
100,000
9.35
8.94
9.00
80,000
YTD Sep '12 YTD Sep '13
Net Property Income
8.00
S$ '000
120,000 -2.7%
103,731 7.00
100,929
100,000
80,000 6.00
YTD Sep '12 YTD Sep '13 YTD Sep '12 YTD Sep '13
(1) Represents income available for distribution per Stapled Security (before deducting income retained for working capital). The income available for distribution per Stapled
Security (after deducting income retained for working capital) for YTD Sep 2013 is 8.05 Singapore cents. 15Increase in CDLHT Total Property Value
Growth in Property Value
S$ M
2,133.5M Key:
2,029.8M 2,044.9M Angsana Velavaru
89
2,000 163 163
1,787.1M 163 Studio M Hotel
1,628.8M 265 261 261
253 Australia Hotel Portfolio
1,481.2M 1,501.6M 88 88
128 90
1,500 40 99 55 68 68 Rendezvous Grand Hotel Auckland
93 110 54 124 124
141 43 54 129
120 118 125
1,101.9M 232 232 232 Orchard Hotel Shopping Arcade
253
227 225 229
1,000 123 Copthorne King's Hotel
846.3M 35
275 296 304 304
101 266 267 276
35
86 M Hotel
191
162 334 350 350 350
309 315 322 Novotel Singapore Clarke Quay
500 267
234
Grand Copthorne Waterfront Hotel
385 458 423 413 429 450 454 454
330 Orchard Hotel
0
IPO 31/12/2006 31/12/2007 31/12/2008 12/31/2009 12/31/2010 12/31/2011 12/31/2012 Post
Angsana
Velavaru
Acquisition (1), (2), (3), (4)
Change
+ 30.2% + 47.8% - 9.1% +1.4% +19.0% + 13.6% + 0.7% + 4.3%
(%)
(1) Valuation of Australia Hotel Portfolio as at 31 December 2012, converted based on exchange rate of A$1 to S$1.2680.
(2) Valuation of Rendezvous Grand Hotel Auckland as at 31 December 2012, converted based on exchange rates of NZ$1 to S$1.0036.
(3) Valuation reports from Jones Lang LaSalle Property Consultants Pte Ltd for Singapore Hotels, Jones Lang LaSalle Hotels (NSW) Pty Limited for Australia Hotels, Bayleys
Valuations Limited for Rendezvous Grand Hotel Auckland and CBRE Pte Ltd for Angsana Velavaru.
(4) Valuation of Angsana Velavaru as at 16 November 2012, converted based on exchange rate of US$1 to S$1.2224.
16CDLHT Asset Portfolio
Breakdown of Portfolio Value by Geography and Property (1)
Overseas Portfolio 20.5% Singapore Portfolio 79.5%
Australia 12.2% Singapore 79.5%
Novotel Brisbane 4.2% Orchard Hotel 21.4%
Mercure & Ibis Brisbane 3.7% Grand Copthorne 16.4%
Mercure Perth 2.6% Waterfront Hotel
Ibis Perth 1.7% Novotel Singapore Clarke 14.2%
Quay
New Zealand 4.1%
M Hotel 10.9%
Rendezvous Grand 4.1%
Studio M Hotel 7.6%
Hotel Auckland
Copthorne King’s Hotel 5.8%
The Maldives 4.2%
Orchard Hotel Shopping 3.2%
Angsana Velavaru 4.2%
Arcade
(1) All investment properties, excluding Angsana Velavaru, were valued as at 31 December 2012. The Angsana Velavaru, which was acquired in January 2013, was valued as
at 16 November 2012. 17Healthy Financial Position
18Healthy Balance Sheet
With healthy gearing and ample debt headroom, CDLHT will continue to focus on sourcing for
acquisition opportunities
Debt Value (1) Debt to Assets Ratio
S$ M
676
700
615
600 29.7%
30% 28.1%
500
400
300
200
30 Jun '13 30 Sep '13 20%
Total Assets
S$ M
2,500 2,274 2,190 10%
2,000
1,500
1,000
500 0%
30 Jun '13 30 Sep '13 30 Jun '13 30 Sep '13
(1) Debt value is defined as bank borrowings and medium term notes, both of which are unsecured. 19Debt Facility Details
Unsecured Borrowings
Total of S$273.6 million MTN issued under the S$1 billion multi-currency MTN
Medium Term Notes programme
(“MTN”)
Tenure: 3-year and 5-year (fixed and floating rate notes)
S$200 million multi-currency committed RCF, of which S$60 million remains
unutilised
Revolving Credit
Facility (“RCF”) S$140 million was drawn down in August 2013 to repay part of the MTN which
matured in August 2013
Tenure: 3-year term
A$93.2 million (S$109.9 million) bank facility
Term Loan
Fully drawn down to fund the loan relating to Australia Hotels
Facility
Tenure: 3-year term
S$300 million uncommitted multi-currency bridging facility, of which approximately
S$208.7 million remains unutilised
Acquisition Facility
US$72.8 million (S$91.3 million) utilised to fund the acquisition of Angsana Velavaru (1)
Tenure: 1-year term (2)
(1) Subsequent to 30 September 2013, the 1-year bridge loan maturing January 2014 was refinanced with a 5-year fixed rate term loan facility.
(2) One-year term from first drawn down date (where the amount is drawn in multiple tranches). 20Credit Metrics and Debt Profile (1)
Credit Metrics Debt Currency Profile as at 30 Sep 2013
USD
Fitch Issuer Default Rating BBB- 15%
AUD
18%
SGD
Interest Coverage Ratio 8.7 x (2) 67%
Interest Rate Profile as at 30 Sep 2013 Interest Rate Profile as at 30 Oct 2013 (3)
Floating Fixed Floating Fixed
51% 49% 36% 64%
(1) Based on exchange rates of A$1=S$1.1788 and US$1=S$1.2542.
(2) Interest cover is computed using the YTD Sep 2013 net property income divided by the total interest paid/ payable in YTD Sep 2013.
(3) Subsequent to 30 September 2013, the 1-year bridge loan maturing January 2014 was refinanced with a 5-year fixed rate term loan facility. 21Debt Maturity Profile (1)
Debt Maturity Profile as at 30 Sep 2013 Debt Maturity Profile as at 30 Oct 2013 (2)
S$ million S$ million
300 300
250 250
214
200 200
161
120
100 84 100 84
70
0 0
0 0
2014 2015 2016 2017 2018 2014 2015 2016 2017 2018
(1) Based on exchange rates of A$1=S$1.1788 and US$1=S$1.2542.
(2) Subsequent to 30 September 2013, the 1-year bridge loan maturing January 2014 was refinanced with a 5-year fixed rate term loan facility. 22Outlook
23Continued Visitor Arrivals Growth (Singapore)
Visitor arrivals grew 8.5% y-o-y for the first eight months of 2013
FY 2012 visitor arrivals registered 10.0% y-o-y growth to 14.5 million from 13.2 million in FY 2011
Monthly Visitor Arrivals
Thousand
1,600
1,467
1,390
1,400 1,368 1,356
1,314
1,292 1,284
1,246 1,261 1,261
1,221 1,212 1,217
1,193
1,200 1,146 1,158 1,274
1,243
1,199 1,202 1,051
1,179
1,135 1,028
1,127
1,103 1,095 1,085
1,072 1,080
1,000 1,056 1,054 1,034
990 997 979
946 951 947 964
929 939
908
800 857
Jan Feb Mar Apr May Jun Jul Aug Sep Oct Nov Dec
2010 2011 2012 2013
Source: Singapore Tourism Board (STB) 24Geographical Mix of Top Markets (Singapore)
Indonesia, China and Malaysia make up the top three source markets
Geographical Mix of Visitor Arrivals Top 10 Inbound Markets
1Q 2013 (1) Y-o-Y Change for 1Q 2013 (1) (2)
Hong Kong 25.4%
Indonesia
18% Australia 20.4%
Others
25% China 19.5%
Japan 13.3%
India 9.0%
Hong Kong China Indonesia 6.0%
3% 17%
USA USA 5.3%
3%
Malaysia 1.5%
UK Malaysia
4% 8% UK 0.5%
Philippines India Australia Philippines 0.3%
4% 5% Japan 7%
6% -5.0% 5.0% 15.0% 25.0% 35.0%
(1) Based on the latest available statistics published on 16 October 2013.
(2) The top 10 inbound markets are ranked according to growth rates in descending order.
Source: Singapore Tourism Board (STB) 25STB Forecasts Growth in Visitor Arrivals
Historical and Forecasted Visitor Arrivals in Singapore
Million
18.0
14.8 to FY 2012 visitor arrivals
10-year CAGR = 6.7% 15.5 grew 10.0% y-o-y
15.0 14.5
13.2 STB’s estimate for
11.6 visitor arrivals in 2013
12.0
10.5 is between 14.8 million
10.3 10.1
9.8 9.7 9.7 to 15.5 million, implying
8.9
9.0 8.3 a 2.1% to 7.0% growth
7.6 from 2012
6.1
6.0 Visitor arrivals grew
8.5% y-o-y for the first
eight months of 2013
3.0
STB expects visitor
arrivals grow at a rate
0.0 of 3% to 4% over the
2002 2003 2004 2005 2006 2007 2008 2009 2010 2011 2012 2013
next decade
SARS Sub-Prime
Full Year Visitor Arrivals YTD August Visitor Arrivals STB’s Forecast
Source: Singapore Tourism Board (STB) 26Singapore’s Competitiveness and Vibrancy Supported
by Infrastructure and Product Development
Additional MICE One of Asia’s
venue (to be largest visual arts
completed in April institutions (to open
2014) in 2015)
National Art Gallery
T4 (to be completed
in 2017)
Revamping of T1 (to
be completed
in 2018)
T5 (to be completed
by 2028)
Will boost current
annual passenger
capacity from 66
million to 135 million
Sources: Channel NewsAsia, The Business Times, TODAY, The Edge and MyPaper
Singapore map: Wikimedia Commons
Photo Credit for Singapore Sports Hub: gyverchangphotos via Compfight cc
Other images courtesy of Singapore Tourism Board, The National Art Gallery, Wildlife Reserves Singapore, Resorts World Sentosa and www.sg 27Championing Singapore as
Asia’s Top MICE Destination
Government Initiatives
STB’s Tourism 2015: Strengthening
Singapore’s position as a leading
Convention & Exhibition city in Asia
One third of S$905 million
committed in 2012 for development
of MICE sector over the next 5
years
STB aims to raise the tourism
receipts contributions of the
BTMICE sector from S$5.6 billion in
2011 to S$10.5 billion by 2015
Accolades
Top International Meeting Country
(1) Union of International Associations 2012
(2) International Congress and Convention Association Global Rankings 2012
and City (1), Asia’s Top Convention
(3) TTG Travel Awards 2012 City (2), Best BT MICE City (3) and
(4) Business Traveller Asia-Pacific Travel Awards 2012
Sources: Singapore Tourism Board (STB), Ministry of Trade and Industry Singapore (MTI) and The Straits Times
Best Business City in Southeast
Photo Credit: besar bears via Asia (4)
Compfight cc
28More Supply (1) Expected in the Immediate Horizon
New room supply is expected to grow at a CAGR of 5.9% for the next 3 years
Operating environment expected to continue to be competitive with over 2,900 new rooms opening
in 2014
Current and Expected Hotel Room Supply in Singapore
No. of Hotel Rooms
3-year CAGR = 5.9%
65,000 3,506
61,265
2,921 6.1%
60,000 5.3%
3,216(2)
6.2%
55,000
51,622
50,000
45,000
40,000
35,000
2012 2013 2014 2015 Total 2015
Current estimated hotel supply Estimated future net hotel supply Estimated hotel supply by end-2015
(1) New supply of rooms is a summation of new rooms deducted by existing rooms taken out of inventory for redevelopment.
(2) An estimated room count of approximately 2,600 had opened in the first ten months of 2013.
Sources: Singapore Tourism Board (STB), Horwath HTL (as at Jul 2013) and CDLHT research 29Potential Supply of New Singapore Hotel Rooms
Until 2015
No. of Horwath Expected No. of Horwath Expected
Name of Hotel Location Name of Hotel Location
Rms Rating Opening Rms Rating Opening
Amaris Middle Road Singapore 38 Economy City Centre Opened Holiday Inn Express (Havelock) 448 Mid Tier City Centre 2014
The Daulat Hotel 16 Economy City Centre Opened Sofitel So Singapore (Ogilvy) 134 Upscale/Luxury City Centre 2014
Parkroyal at CBD 367 Mid Tier City Centre Opened Traders Hotel (former Phoenix
502 Upscale/Luxury City Centre 2014
Hotel)
Dorsett Hotel & Residences 285 Mid Tier City Centre Opened
Capitol 157 Upscale/Luxury City Centre 2014
Big Hotel (former Prime Centre) 308 Mid Tier City Centre Opened
Aqueen Hotel Geylang 100 Economy Outside City Centre 2014
Holiday Inn Express (Orchard) 220 Mid Tier City Centre Opened
Aqueen Hotel Tyrwhitt 145 Economy Outside City Centre 2014
Carlton City Hotel 386 Mid Tier City Centre Opened
Aqueen Hotel Little India 78 Economy Outside City Centre 2014
Pan Pacific Suites Beach Road 172 Upscale/Luxury City Centre Opened
Fragrance Hotel 90 Economy Outside City Centre 2014
Mövenpick Hotel Sentosa 21 Upscale/Luxury Sentosa Opened
Parc Sovereign 265 Mid Tier Outside City Centre 2014
Venue Hotel 81 Economy Outside City Centre Opened
One Farrer Hotel 250 Upscale/Luxury Outside City Centre 2014
Ramada Balestier 384 Mid Tier Outside City Centre Opened
Midlink Plaza Site 492 Mid Tier City Centre 2015
Changi Cove Hotel 130 Mid Tier Outside City Centre Opened
Robertson Quay Site 310 Mid Tier City Centre 2015
Village Hotel Katong 229 Mid Tier Outside City Centre Opened
South Beach Site 654 Upscale/Luxury City Centre 2015
China Place Boutique Hotel 37 Mid Tier City Centre 4Q 2013
Westin SG Marina Bay Beach Road Hotel Conversion 200 Upscale/Luxury City Centre 2015
305 Upscale/Luxury City Centre 4Q 2013
(Asia Square Tower 2)
New Heritage Hotel @ Sentosa 550 Upscale/Luxury Sentosa 2015
Aqueen Hotel Jalan Besar 75 Economy Outside City Centre 4Q 2013
Park Hotel Farrer Park 300 Mid Tier Outside City Centre 2015
Aqueen Hotel Paya Lebar 162 Economy Outside City Centre 4Q 2013
Park Hotel Alexandra 450 Upscale/Luxury Outside City Centre 2015
Hotel Grand Chancellor Orchard 488 Mid Tier City Centre 2014
Genting Singapore 550 Upscale/Luxury Outside City Centre 2015
Hotel Grand Central 264 Mid Tier City Centre 2014
Year No. of Rms Luxury / Upscale Mid-Tier Economy
2013 3,216 498 15% 2,346 73% 372 12%
2014 2,921 1,043 36% 1,465 50% 413 14%
2015 3,506 2,404 69% 1,102 31% 0 0%
Total (2013 – 2015) 9,643 3,945 41% 4,913 51% 785 8%
Source: Horwath HTL (as at July 2013) and CDLHT research 30Management Strategy
31Management Strategy
Acquisition Growth Strategy Asset Management Strategy
Pursue yield accretive, quality assets with Work closely with lessees to implement
investment rigour and discipline active revenue and cost management
Tap on potential pipeline from M&C / CDL Implement asset enhancement initiatives
Tap on global network for third party assets to optimise asset potential
Financial
Foundation
Capital Management Strategy
Maintain a healthy balance sheet
Enhance financial flexibility by maintaining
diversified sources of funding
32Background and Structure
of CDL Hospitality Trusts
33Background on CDLHT
Background Post IPO Performance
IPO on 19 July 2006
$3.00
Annoucement High (10 Jul ’07) Announcement of Announcement of Announcement of
Listed on SGX of Novotel
Clarke Quay
= S$2.66 Australia Hotels
Acquisition
Private Placement
= S$1.89
Angsana Velavaru
Acquisition =
Mainboard Acquisition
= S$2.01
= S$1.80 S$1.95
$2.50
Sponsored by IPO =
Millennium & S$0.83
Copthorne Hotels plc $2.00
(listed on LSE)
First Hotel REIT in $1.50
Asia ex Japan Announcement
of Equity Fund Announcement of 25 Oct '13
Raising Studio M = S$1.675
= S$2.28 Acquisition
$1.00
= S$1.94
Market Capitalisation Announcement of
Rendezvous Hotel
Auckland Acquisition
$0.50 = S$1.10
31 Dec'07 31 Dec '08 31 Dec '09 31 Dec '10 31 Dec'11 31 Dec '12
= S$2.35 = S$0.730 = S$1.75 = S$2.08 = S$1.55 = S$1.88
S$1.629 billion as of $0.00
25 October 2013
Sep/06
Sep/07
Sep/08
Sep/09
Sep/10
Sep/11
Sep/12
Sep/13
Jan/07
Jan/08
Jan/09
Jan/10
Jan/11
Jan/12
Jan/13
Nov/06
Nov/07
Nov/08
Nov/09
Nov/10
Nov/11
Nov/12
Jul/06
Jul/07
Jul/08
Jul/09
Jul/10
Jul/11
Jul/12
Jul/13
Mar/07
Mar/08
Mar/09
Mar/10
Mar/11
Mar/12
Mar/13
May/07
May/08
May/09
May/10
May/11
May/12
May/13
Source: Stapled Security price data from Bloomberg 34CDLHT Structure
Sponsor Investors
≈35.41% Holdings of Stapled Securities ≈64.59%
as at 30 Sep 2013 as at 30 Sep 2013
H-REIT Distributions HBT
Management
services Management
Stapling Deed services
M&C REIT M&C Business Trust
Management Limited H-REIT HBT(1) and acts on behalf
Management Limited
(H-REIT Manager) (owns hotels) of the holders of (HBT Trustee Manager)
Lease of
Hotels the HBT Units
Lease of
Acts on behalf of the Rent
Hotels
holders of H-REIT Units
DBS Master
Trustee
Lessees
Hotel
Hotel Manager
Manager(2)
(1) Currently dormant.
(2) To be appointed by HBT when HBT is activated.
Note: For simplicity, the diagram does not include the relationships in relation to Orchard Hotel Shopping Arcade. Orchard Hotel Shopping Arcade tenants will pay rent to H-REIT
directly and H-REIT Manager will manage Orchard Hotel Shopping Arcade directly. 35Blue Chip Sponsor and Parentage
Millennium & Copthorne Hotels plc City Developments Limited
One of the largest property developers in
Listed on the London Stock Exchange with
Singapore with a market capitalisation of
market capitalisation of ~ £1.9 billion (1)
~S$9.5 billion (1)
Debt to assets ratio of 10% as at 30 Jun 2013
Debt to assets ratio of 29% as at 30 Jun 2013
(1) As at 25 October 2013.
Source: Bloomberg 36Summary of Leases and Lease Structures
Orchard Hotel, Grand Copthorne Waterfront Hotel, M Hotel, Copthorne King’s Hotel:
Rent: 20% of Hotel's revenue + 20% of Hotel’s gross operating profit, with a fixed rent floor of S$26.4 m
Term of 20 years from Listing with 20-year option
Singapore IPO Orchard Hotel Shopping Arcade:
H-REIT receives rents direct from tenants
Portfolio & Studio M
Favourable Lease
Structure in Base Portfolio
Studio M Hotel:
Rent: 30% of Hotel’s revenue + 20% of Hotel’s gross operating profit, with a fixed rent floor of S$5.0 m for the initial 10
years of the lease
Term of 20 years from 3 May 2011 with 20+20+10 years option
Novotel Singapore Clarke Quay:
Singapore NCQ Rent: Hotel’s gross operating profit less Accor’s management fee, subject to minimum rent
Variable rental payment of more than 90% of gross operating profit, depending on Novotel Singapore Clarke Quay’s
Lease Structure with performance
Reserve and High Variable Minimum rent of S$6.5 million per year guaranteed by lessee / Accor S.A., subject to maximum rent reserve of S$6.5 million
Rent for the lease term
Term ~ 13.5 years from 7 June 2007, expiring 31 December 2020
37Summary of Leases and Lease Structures
New Zealand Rendezvous Grand Hotel Auckland:
Base rent + Variable rent
RGHA
Base rent escalates at 2.75% per annum
High Degree of Stability Term of 10 years from 7 September 2006 with 5 year option
Australia Portfolio Novotel, Mercure & Ibis Brisbane, Mercure & Ibis Perth:
Base rent + Variable rent
High Stability and Base rent: A$13.7 m per annum
Significant Upside Variable rent: 10% of portfolio’s net operating profit in excess of base rent
Potential Term ~ 11 years from 19 February 2010, expiring 30 April 2021
Angsana Velavaru:
Maldives Rent: Hotel’s gross operating profit less lessee’s management fee, subject to minimum rent
Angsana Velavaru Minimum rent of US$6.0 million per year guaranteed by lessee / Banyan Tree Holdings Limited, subject to maximum rent
reserve of US$6.0 million for the lease term
Rental Protection with
Substantial Share of the Tiered hotel management fees offers further downside protection to CDLHT and incentivises lessee to drive growth in gross
Upside operating profit while allowing CDLHT to enjoy a substantial share of the upside
Term of 10 years from 1 February 2013, expiring 31 January 2023
38Gross Revenue Breakdown:
3Q ’12 Vs 3Q ’13
Gross Revenue of CDLHT Properties
S$ M
-0.8%
45.0
Key: Y-o-Y % Change
Key:
40.0 S$36.1M Angsana Velavaru
Angsana Velavaru N.A.
S$35.9M
Australia Total
35.0 1.9 Rendezvous Hotel Auckland
Australia Portfolio - 10.8%
4.4 Orchard Hotel Shopping Arcade
3.9
Copthorne King’s Hotel + 3.7%
30.0 2.3 Rendezvous Grand Hotel Auckland
1.3 2.4 Studio M
2.4 1.3 M Hotel
Orchard Hotel Shopping Arcade - 2.9%
25.0 2.8
2.3 Novotel Singapore Clarke Quay
2.4 Grand Copthorne
Copthorne King’s Hotel Waterfront Hotel - 6.5%
4.0 Orchard Hotel
20.0 3.8
Studio M Hotel - 13.3%
6.1
15.0 5.9 M Hotel - 4.8%
10.0 6.1 Novotel Singapore Clarke Quay - 2.9%
5.7
Grand Copthorne Waterfront - 5.9%
5.0
6.7 6.2
Orchard Hotel - 7.4%
0.0
3Q '12 3Q '13
Note: Gross revenue figures may not add up to total due to rounding 39Gross Revenue Breakdown:
YTD Sep ’12 Vs YTD Sep ’13
Gross Revenue of CDLHT Properties
S$ M -1.7%
120.0 Key: Key: Y-o-Y % Change
S$111.2M
S$109.4M Angsana Velavaru
Angsana Velavaru N.A.
Australia Total
5.0
15.1 Rendezvous Hotel Auckland
100.0 Australia Portfolio - 3.6%
14.5 Orchard Hotel Shopping Arcade
7.0
Copthorne King’s Hotel
4.0 7.2 Rendezvous Grand Hotel Auckland + 3.4%
Studio M
80.0 7.7 3.9
M Hotel
6.6 Orchard Hotel Shopping Arcade - 2.5%
8.2 Novotel Singapore Clarke Quay
7.1
Grand Copthorne Waterfront Hotel
12.3 Copthorne King’s Hotel - 13.9%
60.0 11.6 Orchard Hotel
Studio M Hotel - 13.2%
17.8
16.8
40.0 M Hotel - 5.9%
18.2 Novotel Singapore Clarke Quay - 6.0%
17.3
20.0 - 5.2%
Grand Copthorne Waterfront
20.8 19.2
Orchard Hotel - 7.3%
0.0
YTD Sep '12 YTD Sep '13
Note: Gross revenue figures may not add up to total due to rounding 40CDLHT Asset Portfolio – Singapore
Property Orchard Grand M Hotel Copthorne Novotel Studio M Orchard Hotel Singapore
Hotel Copthorne King’s Hotel Singapore Hotel Shopping Portfolio
Waterfront Hotel Clarke Quay Arcade
Number of
656 574 413 310 403 360 N/A 2,716
Rooms
Valuation at 31
S$454.0 M S$350.0 M S$232.0 M S$124.4 M S$304.0 M S$163.0 M S$68.0 M S$1,695.4 M
December 2012
Acquisition Date July 2006 July 2006 July 2006 July 2006 June 2007 May 2011 July 2006 -
41CDLHT Asset Portfolio – Overseas
Property Rendezvous Novotel Mercure Ibis Mercure Ibis Perth Australia Angsana Overseas
Grand Hotel Brisbane Brisbane Brisbane Perth Portfolio Velavaru Portfolio
Auckland
Number of
452 296 194 218 239 192 1,139 113 1,704
Rooms
NZ$88.0M A$72.0M A$62.0M A$44.0M A$28.0M A$206.0M US$72.5M
Valuation (1) S$438.1M
(S$88.3M) (2) (S$91.3M) (3) (S$78.6M) (3) (S$55.8M) (3) (S$35.5M) (3) (S$261.2M) (3) (S$88.6M) (4)
Acquisition December February February February February February February January -
Date 2006 2010 2010 2010 2010 2010 2010 2013
-
Location New Zealand Australia Australia Australia Australia Australia Australia Maldives
(1) All investment properties, excluding Angsana Velavaru, were valued as at 31 December 2012. The Angsana Velavaru, which was acquired in January 2013, was valued as at 16
November 2012.
(2) Based on exchange rate of NZ$1 = S$1.0036.
(3) Based on exchange rate of A$1 = S$1.2680.
(4) Based on exchange rate of US$1 = S$1.2224.
42Information on
CDL Hospitality Trusts Properties
43Hotels in Strategic Locations
Singapore Hotels New Zealand Hotel
Orchard Hotel & Grand Copthorne Novotel
Rendezvous
Shopping Arcade Waterfront Hotel Singapore
Clarke Quay Grand Hotel
Auckland
H
H
H H
H
SINGAPORE
RIVER
CENTRAL MARINA BAY
BUSINESS SANDS H
DISTRICT
H
BUSINESS &
FINANCIAL
CENTRE SITE
Copthorne King’s Studio M Hotel M Hotel
Hotel AUCKLAND CITY CENTRE
44Hotels in Strategic Locations
Australia Hotels
Mercure Ibis Novotel Mercure
Brisbane Brisbane Brisbane Ibis Perth Perth
Brisbane CBD Perth CBD
H
H
H H
H
CBD AREA
45Resort in Premium Destination
Main Island of Angsana Velavaru
Malé Atoll
40 min
seaplane
flight
R
South
Nilandhe
Atoll
46Orchard Hotel, Singapore
Significant Highlights
656 rooms
Located on Orchard Road
Large pillar-less ballrooms & extensive conference facilities
Caters to both corporate and leisure segments
Accolades
Wine & Dine Singapore’s Top Restaurants 2013 – Orchard Café &
Noodles
Prestigious awards received by Hua Ting Restaurant:
Voted one of Asia’s finest restaurants and included in The Miele
Guide 2011 to 2013
Asia Tatler’s Best Restaurants 2008 to 2013
Singapore Tatler’s Best Restaurants 2006 to 2013
Wine & Dine Singapore’s Top Restaurants 2006 to 2013 (Three Star
Rating in 2013)
Singapore Green Hotel Award 2013 by Singapore Hotel Association
(SHA)
BCA Green Mark (Gold) 2011-2014
Singapore Service Class Certificate for business excellence in service
standards by Spring Singapore from 2011- June 2014
TripAdvisor Certificate of Excellence 2013
Best Concierge Award 2012 by Association of Rooms Division Executive
World Gourmet Series Awards of Excellence 2012
Masterchef Lap Fai - Asian Cuisine Chef of The Year
Hotel Security Award - Excellence Award 2012 by SHA and Singapore
Police Force (SPF)
47Grand Copthorne Waterfront, Singapore
Significant Highlights
574 rooms
Located between CBD & Orchard Road, within close
proximity to Robertson Quay, Boat Quay & Clarke Quay
One of the largest conference facilities in Singapore
Well positioned for the MICE market
Accolades
Prestigious awards received by Pontini:
Singapore Tatler’s Best Restaurants 2013
Wine and Dine Singapore’s Top Restaurants 2013
Executive Chef David Toh – At-Sunrise Global Chef Academy,
Mentor Chef 2013
PUB Water Efficient Building Award 2013 (Silver)
Hotel Security Award - Excellence Award 2013 by SHA and SPF
TripAdvisor Certificate of Excellence Award 2013 (Winner)
Singapore Service Class Certificate for business excellence in
service standards by Spring Singapore in 2012
ASEAN Green Hotel Award 2012-2013 by SHA
Luzerne Best Pastry Art Award 2012
Winner – Assistant Pastry Chef Tiffany Yeo
BCA Green Mark (Gold) 2011
Hospitality Asia Platinum Awards 2009 to 2011 by World Asia
Publishing, Singapore Series:
Best Pastry Chef
Third Place – Best Housekeeping Team
48M Hotel, Singapore
Significant Highlights
413 rooms
Located in the heart of the financial district
Close to government offices, integrated resorts
and Marina Bay
Strong following of business travellers
Accolades
Wine & Dine Singapore’s Top Restaurants 2013 – Cafe
2000 & The Buffet
BCA Green Mark (Gold) 2011-2014
PUB Water Efficient Building Award 2013 - 2016 (Silver)
ASEAN Green Hotel Award 2012-2014 by SHA
TripAdvisor Certificate of Excellence 2013
Singapore Green Hotel Award 2009 & 2011 by SHA
Hospitality Asia Platinum Awards 2009 – 2011 Singapore
Series - Best Deluxe Hotel & Top 5 for Best Business
Hotel
Hotel Security Award 2009 – 2012 by SHA and SPF
Simply Dining Singapore’s Top Restaurants 2009
Best Buffet Restaurant – The Buffet
Silver Star Award – Cafe 2000
Silver Star Award – The Buffet
49Copthorne King’s Hotel, Singapore
Significant Highlights
Boutique-style business hotel with 310 rooms
Located within close proximity to CBD, convention /
exhibition belt, Orchard Road, Robertson Quay, Boat
Quay and Clarke Quay
Strong corporate segment focus and specialty events
hotel host
Accolades
AsiaOne People’s Choice Awards 2013 – Top 3 Buffet
Restaurant
Wine & Dine Singapore’s Top Restaurants
2007 to 2013 – Tien Court
2005 to 2013 – Princess Terrace
Singapore Tatler’s Best Restaurants 2007 to 2013 –
Tien Court & Princess Terrace
Hotel Security Award - Excellence Award 2013 by
SHA and SPF
BCA Green Mark (Gold) 2012
Excellent Service Award 2004 - 2010 by SHA & Spring
Singapore
Top 10 Buffets in Singapore by AsiaOne People
Choice Awards 2009 & 2011
50Novotel Singapore Clarke Quay, Singapore
Significant Highlights
Prime mid-scale hotel with 403 rooms
Leasehold
Located in immediate proximity to Clarke Quay,
Robertson Quay and Boat Quay: Singapore’s premier
entertainment hub
Room touch ups, upgrading of all bathrooms and
renovation of Premier Lounge over the course of FY
2011 was completed in Jan 2012
Refurbishment of level 5 function and meeting rooms
in 2012
Accolades
BCA Green Mark (Gold Plus) 2013
Accor Asia Pacific GOPPAR Award 2012 – Highest
Gross Operating Profit per Available Room) in the
region
Accor Asia Pacific Sales Distribution Award 2012 –
Highest Web Distribution (Accor Site and 3rd Party) in
the region
EarthCheck Certified for its commitment to
environmental and sustainable development
ASEAN Green Hotel Standard Award for 2010 – 2011,
Singapore Green Hotel Award 2010 – 2011 by SHA
51Studio M Hotel, Singapore
Significant Highlights
360-room hotel opened in March 2010
Stylish and contemporary design set to capture growing
business and leisure segments
Vibrant lifestyle options near the Robertson Quay precinct
and in proximity to CBD, tourist attractions, integrated
resorts and convention centres
Accolades
Booking.com – “Outstanding Hotel Partner Award 2012”
TripAdvisor Travellers’ Choice 2012 – Top 4 Trendiest
Hotel in Singapore
AsiaOne Readers’ Choice Award 2010 – Top 3 Best
Boutique Hotel in Singapore
52Orchard Hotel Shopping Arcade, Singapore
Net Lettable Area ~ 5,933 sq m
JLL’s Valuation S$68.0M
Valuation psm (psf) S$11,461 psm (S$1,065 psf)
% of total valuation ~3.2%
Leasehold Interest 75 years from Listing Date
53Rendezvous Grand Hotel Auckland,
New Zealand
Significant Highlights
452 rooms – largest hotel in Auckland by rooms
Freehold
Located in the central business district and next to a major conference
centre
Accolades
EarthCheck Certified 2009 – 2013, Bronze
TripAdvisor Certificate of Excellence 2012-2013
Qualmark Ranking 4 Star Plus 2012-2013
National Culinary Fare 2012 - 1 Gold & 2 Silver award in Cocktail,
Wine and Beverage Service and Table Setting
Restaurant award for Pacific Restaurant Category Winner : Formal
Dining New Zealand Restaurant of the Year 2009
Sliver Medal for Service both at the New Zealand Culinary Fare 2009
54Novotel, Mercure and Ibis Hotels, Brisbane
Novotel Brisbane
Significant Highlights
Novotel Brisbane
4.5 star accommodation with 296 modern, well-appointed rooms and suites
Freehold
Located next to Central Station and the CBD, Queen Street Mall and the
Riverside boardwalk
Comprehensive conference and leisure facilities of ten dedicated rooms
with capacity for up to 350 delegates
Mercure Brisbane
Refurbishment of all rooms, lobby and restaurant completed in May 2011
EarthCheck Certified 2009 – 2011, Silver
Mercure Brisbane
4 star accommodation with 194 spacious and stylish rooms and suites,
overlooking the Brisbane River
Freehold
Located steps from the Queen Street Mall shopping precinct, Brisbane
Ibis Brisbane
Convention and Exhibition Centre
Three floors of function facilities and eleven conference rooms
Ibis Brisbane
3.5 star accommodation with 218 rooms
Freehold
Well-situated in the heart of the government and corporate precinct
55Mercure and Ibis Hotels, Perth
Mercure Perth Mercure Perth
Significant Highlights
Mercure Perth
4.0 star accommodation with 239 rooms and suites
Freehold
Offers six meeting rooms available for up to 350
delegates
Situated in Perth’s CBD and within walking distance Mercure Perth
to the Swan River, shopping and entertainment
Ibis Perth
3.5 star accommodation with 192 rooms
Freehold
Ibis Perth Ibis Perth
Located steps from the Murray and Hay Street
shopping belt within Perth’s CBD
Awarded Best Standard Accommodation by the
Perth Airport Western Australia Tourism Awards
2011
56Angsana Velavaru, The Maldives
Significant Highlights
113-villa resort opened in 2006, initially with 79 beachfront
villas, and 34 water villas were subsequently added in
2009
Exclusive cluster of standalone water villas positioned
~1km away from main island
Offers guests the opportunity to enjoy two distinct
experiences under one resort
The upmarket resort offers a wide range of dining, leisure
and spa options with more than a hundred activities
Accolades
World Luxury Spa Award 2013 – Best Luxury Beauty Spa
(Maldives)
2012 Gold Circle Awards - Agoda.com
Travart.com - “Save the Planet Awards 2009”
Class Top List – Voted one of the best resorts in the world
2009
World Travel Awards - Indian Ocean's Leading Diving
Resort 2007
57THANK YOU
58You can also read