Understanding Evictions in Canada through the Canadian Housing Survey - September, 2021
←
→
Page content transcription
If your browser does not render page correctly, please read the page content below
Understanding Evictions in
Canada through the Canadian
      Housing Survey

         September, 2021

            Silas Xuereb
            Andrea Craig
            Craig Jones

                           0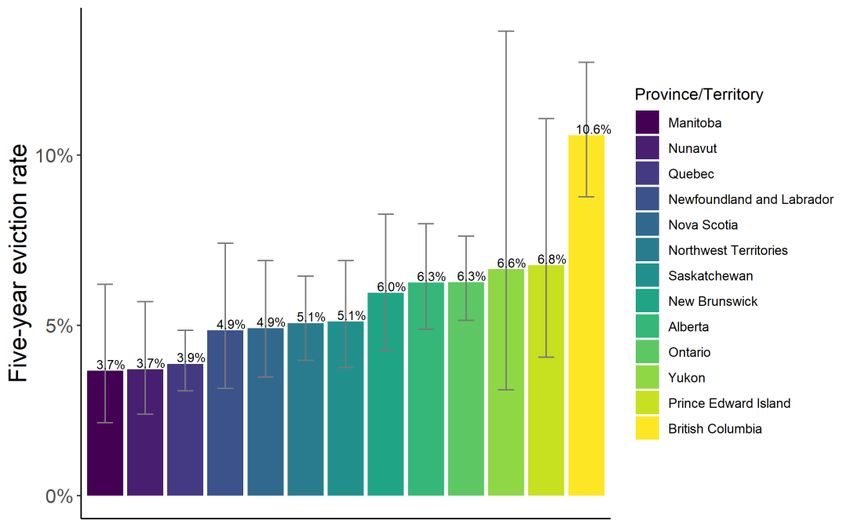
Understanding Evictions in Canada through the Canadian Housing Survey

             Understanding Evictions in Canada
           through the Canadian Housing Survey
Author
       Silas Xuereb, MA Economics, University of British Columbia

Supervised by
      Andrea Craig, Assistant Professor of Economics, University of British Columbia –
Okanagan

       Craig Jones, Research Coordinator, Housing Research Collaborative

                            Acknowledgements

This research was funded by UBC’s                   and Humanities Research Council
Balanced Supply of Housing Research                 (SSHRC), the Canadian Institute for Health
Cluster.                                            Research (CIHR), the Canadian Foundation
                                                    for Innovation (CFI), and Statistics Canada.
This research was supported by funds to             Although the research and analysis are
the Canadian Research Data Centre                   based on data from Statistics Canada, the
Network (CRDCN) from the Social Sciences            opinions expressed do not represent the
                                                    views of Statistics Canada.

                                               1
Understanding Evictions in Canada through the Canadian Housing Survey

                             Executive Summary

        During the COVID-19 pandemic                 years). Renter households whose shelter
evictions were widely acknowledged as a              costs were above 50% of their income are
public health problem and eviction bans were         also more likely to be evicted.
implemented across Canada. However,
despite extensive research on evictions in                   10.6% of renters in British Columbia
the United States, little is known about who         reported being evicted within 5 years, more
is affected by evictions in Canada and what          than any other province or territory whereas
their consequences are. In this research, I          less than 4% of renters were evicted within 5
use survey data from the nationally                  years in Manitoba, Québec, and Nunavut.
representative 2018 Community Housing                Vancouver experienced more evictions than
Survey (CHS) to estimate the percentage of           Toronto, Montreal and other Census
renters who were evicted during the five             Metropolitan Areas (CMAs). After controlling
years prior to data collection and the               for other sociodemographic characteristics,
percentage of renters whose previous move            being aged 45-54, living in British Columbia
was an eviction, for various demographic             and having a shelter cost to income ratio
groups and geographic regions. Renters are           above 50% are risk factors for eviction.
classified as having been evicted if the
survey respondent in their household
reported that their most recent move was                     Among survey respondents, renters’
forced and was from a rental property.               whose last move was an eviction have lower
                                                     self-reported levels of health and mental
                                                     health than other renters. These renters also
        I estimate that 1.3% of renters were         reported lower levels of life satisfaction,
evicted in Canada in the year prior to data          increased difficulty meeting their financial
collection and 6.6% of renters were evicted
                                                     needs and were more likely to be in core
in the previous five years. Men are slightly         housing      need.      Demographic        and
more likely to experience evictions than             socioeconomic characteristics did not fully
women. Evictions are concentrated among              attenuate these relations. Overall, I establish
adults between the ages of 45 and 54 (8.4%           that evictions are related to poor health and
experienced an eviction with 5 years), single        economic hardship for Canadian renters.
parents (7.9% experienced an eviction within         This research highlights the potential
5 years), and renters who identified as First        consequences of evictions for Canadian
Nations (although imprecise, I estimate that         renters and which demographic groups are
12.3% experienced an eviction within 5               most at risk eviction.

                                                2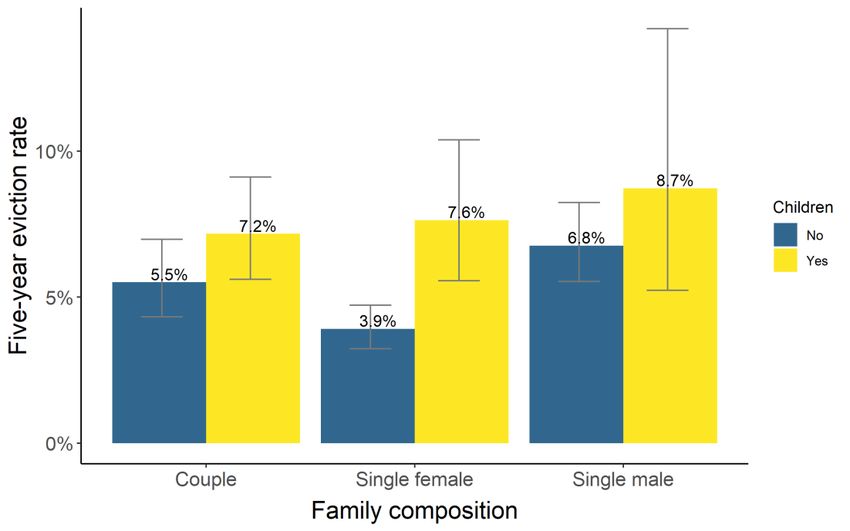
Understanding Evictions in Canada through the Canadian Housing Survey

                                       Introduction

         As average house prices doubled               evictions in Canada. Using a nationally
over the past 15 years in Canada, more                 representative sample of Canadian renters, I
young Canadians have been pushed out of                estimate eviction rates by gender, age,
the housing market. The homeownership                  ethnicity,    immigration      category    and
rate fell for the first time since 1971 in 2016,       education. At the level of renter households,
falling for all age groups except seniors              I estimate eviction rates by household
(Statistics Canada, 2017). According to the            income, shelter cost to income ratio, family
Canada Mortgage and Housing Corporation                composition, province of residence, and pay
(CMHC), renters are four times as likely to            special attention to the census metropolitan
live in an unaffordable housing (defined as            areas (CMAs) of Montréal, Toronto and
spending over 30% of one’s income on                   Vancouver. I then examine whether evictions
shelter costs) than homeowners (CMHC,                  are related to negative outcomes such as
2019). Nearly 27% of renter households                 lower life satisfaction, self-reported physical
were living in core housing need in 2016.              and mental health, living in core housing
Amidst this housing affordability crisis, the          need and increased difficulty in meeting
COVID-19 pandemic struck, exacerbating                 one’s financial needs.
the problem for millions of Canadians who
lost their source of income. It is estimated
that over 250,000 renter households                    Literature Review
accumulated rent arrears during the
pandemic (Tranjan, 2021), putting these
                                                                Although census data has shown that
households at risk of eviction. Although many
                                                       vulnerable populations such as single
provinces implemented bans on evictions
                                                       mothers and Indigenous peoples are more
during the early stages of the pandemic,
                                                       likely to live in unaffordable housing, I know
many of those bans were lifted during the fall
                                                       of no national research to date that has
of 2020 (CMHC, 2020a) despite cases of
                                                       assessed who is most likely to be affected by
COVID-19 reaching record levels at that
                                                       evictions in Canada. A recent ecological-
time. This led to thousands of Canadians
                                                       level study in Toronto finds that
being forced out of their homes amidst the
                                                       neighbourhoods with 36% Black populations
pandemic, as housing tribunals sped through
                                                       have eviction rates twice as high as those
cases to clear their backlogs (Dingman,
                                                       with 2% Black populations (Leon & Iveniuk,
2020). Recent modeling suggests that these
                                                       2020), suggesting that racialized populations
evictions may have even led to increased
                                                       are more likely to be evicted. They find no
spread of COVID-19 (Nande et al., 2021). As
                                                       relation between concentration of immigrant
Canada returns to some semblance of
                                                       households or female heads of households
normalcy, it is important to understand who
                                                       and      eviction    rates.   Previous     non-
was most affected by these evictions, where
                                                       representative individual-level studies, also
they were most concentrated and what their
                                                       based in Toronto, find that women, younger
consequences are so that policymakers can
                                                       people, and those with low incomes are over-
develop adequate policy solutions to support
                                                       represented among those facing eviction
those who were most impacted.
                                                       (LaPointe, 2004; McDonald & Cleghorn,
                                                       2008).
      In this paper, I use data from the 2018
Canadian Housing Survey (CHS) to analyze

                                                   3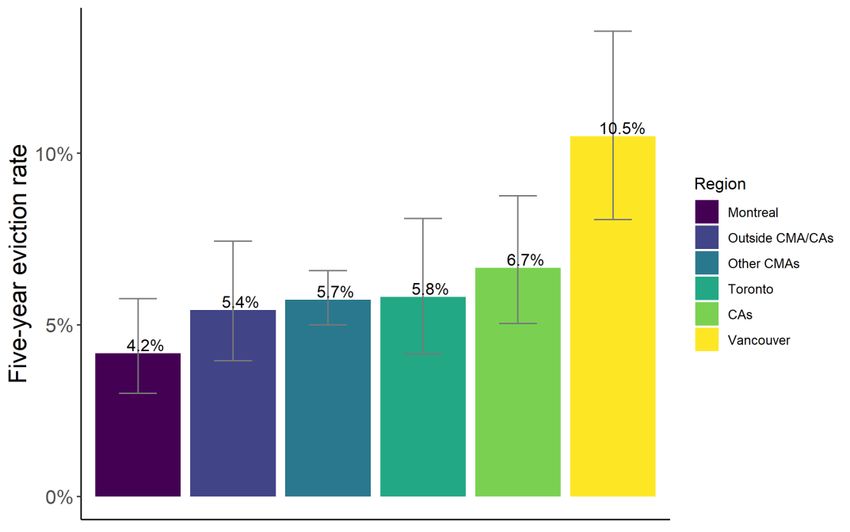
Understanding Evictions in Canada through the Canadian Housing Survey

        American research has had similar            have larger Black populations and higher
findings. An examination of court records of         poverty rates than the rest of the city (Leon &
evictions in Milwaukee finds that women              Iveniuk, 2020). There is also a link between
represented over 60% of evictions from 2003          gentrification and evictions in Toronto.
to 2007 (Desmond, 2012). Several studies             Neighbourhoods in the early stages of
find that Black and Hispanic tenants are             gentrification, characterized by increases in
more likely to be evicted than White tenants         the percentage of artists and people with
(Burgard et al., 2012; Desmond, 2012;                higher education living there, have higher
Lundberg & Donnelly, 2019). There is some            eviction rates (Chum, 2015). In the Metro
evidence that this racial discrepancy                Vancouver, evictions appear to be more
disappears when other factors such as                heavily concentrated in suburban cities such
income, education, and, crucially, rental            as Surrey, Port Coquitlam and Maple Ridge
payment history, are controlled for (Desmond         than in Vancouver and the closely
& Gershenson, 2017), but there is other              surrounding cities (Blomley et al., 2018).
evidence that discrimination directly plays a
role in the elevated rates of eviction for                   It is important to understand who is
Hispanic tenants who live in predominantly           most affected by evictions and where they
White neighbourhoods (Greenberg et al.,              are most likely to occur because evictions
2016). Families with more children have              can have significant negative consequences
elevated risk for eviction even after                for evicted tenants. Two qualitative studies of
controlling for rental payment history and           evicted tenants in Toronto found that an
other covariates (Desmond & Gershenson,
                                                     overwhelming majority of respondents said
2017). Evictions also exhibit a strong social        the eviction had a negative effect on their
gradient in the United States – 29% of               lives (Lapointe, 2004; McDonald & Cleghorn,
children below 50% of the poverty line               2008). Many indicated that the eviction had
experience an eviction before the age of 15          increased their stress and anxiety, with some
compared to only 5% of children above 300%           saying it led to drug relapse and depression.
of the poverty line (Lundberg & Donnelly,            A life-course analysis found that evictions
2019). A cross-national systematic review of         often caused a downward spiral of housing
psychosocial factors associated with eviction        quality that could even lead to homelessness
finds that financial hardship was the                for younger people (McDonald & Cleghorn,
strongest predictor of evictions (Tsai &             2008). A collection of studies of drug users in
Huang, 2019). Our research examines                  Vancouver finds that evictions increase the
whether these American patterns are also             likelihood     of    relapse    into    crystal
apparent in Canada.                                  methamphetamine use (Damon et al., 2019),
                                                     increase HIV viral load among HIV-positive
         Another open question about                 tenants (Kennedy, Kerr, et al., 2017), and
evictions in Canada is where they are most           increase the likelihood of experiencing
likely to take place – urban or rural areas,         violence (Kennedy, McNeil, et al., 2017)
inner city or suburban neighbourhoods, and           even after controlling for other known
in which provinces. Evidence on the                  covariates.
distribution of evictions in Canada is lacking
at the national and even provincial level but                Although I know of no quantitative
there has been research on which                     research that has examined the effects of
neighbourhoods are most affected by                  evictions on life satisfaction, health and
evictions at the city-level. Within Toronto,         economic hardship for a general sample of
eviction applications appear to be                   Canadian renters, such research exists for
concentrated in inner suburban areas such            American renters. Health, a strong predictor
as Scarborough and the Jane and Finch                of life satisfaction, is robustly related to
region. These neighbourhoods also tend to
                                                     evictions. A recent systematic review of 47

                                                 4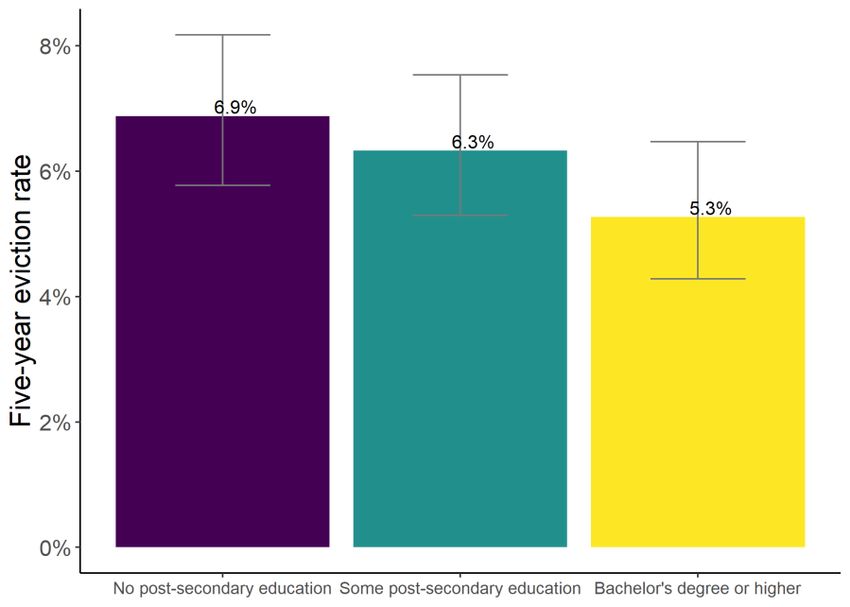
Understanding Evictions in Canada through the Canadian Housing Survey

articles examining the effects of forced               weight (Himmelstein & Desmond, 2021).
moves revealed that most studies found                 Cross-sectional research in Canada showed
forced moves were related to negative                  that being in rent arrears and borrowing
mental health outcomes such as depression              money to pay for rent are also risk factors for
and anxiety, and negative physical health              food insecurity (Kirkpatrick & Tarasuk, 2011).
outcomes such as poor self-reported health             Evictions are also related to material
and high blood pressure (Vásquez-Vera et               hardship     and      maternal     depression
al., 2017). One noteworthy quasi-                      (Desmond & Kimbro, 2015) and effects on
experimental study comparing individuals               material hardship and maternal health persist
evicted in New York from 2007 to 2016 to               for at least two years after the eviction.
individuals involved in housing court cases            Evictions lead to elevated levels of housing
who were not evicted found that evictions              instability and an increased likelihood of
increased the probability of hospitalization           using homeless shelters (Collinson & Read,
within the following two years by 3.5                  2018; Desmond et. al, 2015). Our research
percentage points, largely due to increased            examines whether evictions are related to
hospitalization rates for mental health                worse health outcomes in Canada, as has
problems (Collinson & Reed, 2018).                     been proven in the United States.
Longitudinal research has shown that
evictions are related to elevated risk of food
insecurity (Leifheit et al., 2020) and low birth

                                          Methods

Data                                                   questions were not asked in the Northwest
                                                       Territories because data collection was
                                                       conducted via the 2019 Northwest Territories
         This analysis uses data from the              Community Survey.
2018 Canadian Housing Survey (CHS). The
2018 CHS was the first wave of the CHS, a                      Data collected includes information
biannual      Statistics    Canada    survey           on households’ current housing situation,
sponsored by CMHC. Households were                     previous moves, satisfaction with their
invited to complete the survey online and              community,       and      socio-demographic
were contacted via telephone if they did not           characteristics. Households were weighted
complete the survey online. In Nunavut,                to account for non-response bias and then to
Yukon (except Whitehorse) and Yellowknife,             match the age, sex, income and household
in-person interviews were conducted                    size profile of each province. Respondents
instead. The overall response rate was 50%,            were also asked for demographic information
with a final sample size of 65,377 Canadians.          about other members of their household.
Individuals living in social and affordable            Missing data for key variables were imputed
housing and renters were oversampled to                by Statistics Canada using the nearest-
ensure accurate estimates could be                     neighbour imputation method. Only visible
computed for these subpopulations. CHS                 minority    status,   LGBTQ2IA+      status,
data collection occurred between November              education and shelter cost to income ratio
1, 2018, and March 31, 2019. Some

                                                   5
Understanding Evictions in Canada through the Canadian Housing Survey
had missing data in our dataset. In (evictions which took place a long time ago
regressions, I omit individuals whose shelter may not be representative of recent trends in
cost to income ratio and education are evictions) and the statistical power required
missing and retain individuals with missing to detect differences in eviction rates
visible minority status as a separate category between groups. I report annual eviction
because it is significantly related to evictions. rates at the national level but given the
limited number of evictions that occurred
To comply with Statistics Canada within the past year in this sample, few
reporting requirements, categories with small differences could be detected in annual
cell counts were merged with other eviction rates between groups. In the
categories for some demographic variables. appendix, I also report evictions as a
Individuals who did not identify their gender percentage of previous moves regardless of
as male or female were merged with when the move occurred (previous move
females, Black and Arab respondents were eviction rate).
combined into one category, South Asian,
Chinese, Filipino, Southeast Asian, West Eviction rates were estimated for
Asian, Korean and Japanese were combined various demographic groups at the individual
into an “Asian” category, Latin American and level and weighted to be representative of
multiple visible minorities were merged into the population of Canadian renters. I report
an “Other” category. Households for whom eviction rates by gender, age, ethnicity,
shelter cost to income ratio was classified as education and immigration category. For
“not applicable” were merged with shelter household characteristics, including family
cost to income ratios under 30%. This does composition, shelter cost to income ratio,
not imply that estimating eviction rates and adjusted household income (household total
their consequences for these subgroups is income divided by the square root of
not important. In fact, there may be household size; Statistics Canada, 2021c),
significant heterogeneity in eviction rates and social and affordable housing, eviction
among many of these subgroups. However, rates are estimated at the household level
data limitations did not permit us to do so. and weighted to the population of Canadian
renter households. Standard errors were
adjusted to account for the survey design
Estimation of eviction rates using sampling weights. While reported
standard errors were not adjusted for
sampling variance using bootstrapping,
Because our primary interest was the
inspection of several randomly selected
characteristics of those affected by evictions
standard errors revealed bootstrapping had
and the consequences of evictions, I limited
a negligible effect on standard errors (i.e., did
our sample to households that were renting
not change the estimated confidence
their current residence. Renter households
intervals when reported to one decimal
were classified as having experienced an
place). Likelihood ratio tests were used to
eviction if they indicated that their most
test whether eviction rates differed across
recent move was “Because [they] were
groups. Pairwise comparisons were
forced to move by a landlord, a bank or other
conducted if the likelihood ratio test had a p-
financial institution or the government” and
value less than 0.05. Significant differences
their previous residence was a rental
between groups are reported if the pairwise
property (i.e., they did not own it or live there
comparison has a p-value less than 0.05
rent free). Our primary measure of eviction
without adjustment for familywise error rates.
rates is the percentage of renters who
experienced an eviction within the past five
years (five-year eviction rate). This measure Due to Statistics Canada’s
was chosen to balance policy relevance restrictions on geographic analyses, eviction
6Understanding Evictions in Canada through the Canadian Housing Survey
rates are reported only at the provincial level so can be interpreted as the increase (if
and at the CMA level for Toronto, Montréal, greater than 1) or decrease in the odds of
and Vancouver. For Toronto, Montréal, and experiencing an eviction for a group relative
Vancouver, I also calculate eviction rates by to a reference group. Regressions are useful
distance to city center (defined as the to control for observed characteristics that
location of the central transit station in are related to evictions, but coefficients
downtown – Union Station in Toronto, le cannot be interpreted as causal effects due
Gare Centrale in Montréal, and Waterfront to potential bias from unobserved variables
Station in Vancouver) on evictions. and relations between observed covariates.
Respondents’ postal codes were converted
to latitudes and longitudes using Canada I also used linear and logistic
Post’s Postal Code Conversion File regression analyses to assess whether
(Statistics Canada, 2021b) and then experiencing an eviction was related to
converted to distances from the city center negative outcomes, depending on whether
using the geodist package in STATA (Picard, the outcome variable was binary.
2019). Households are assigned a location Experiencing an eviction was defined as
based on the location of their current one’s previous move being an eviction,
residence. Thus, to interpret estimated regardless of when the eviction took place.
eviction rates by geographic region as the As when estimating the effect of
percentage of renters evicted within that demographics on evictions, these
region relies on the assumption that regressions allow me to control for observed
households did not move between regions
demographic and socioeconomic
after being evicted, or, more weakly, that characteristics that are related to both
evicted households were equally likely to evictions and outcomes, but I do not attempt
move between regions as other households. to estimate the causal effect of evictions. I
cannot rule out the possibility that other
Growth in real rental prices by unobserved characteristics explain observed
province and CMA were calculated using relations between evictions and outcome
publicly available rental price data (CMHC, variables. Outcome variables include
2020b) to analyze whether growth in real respondents’ self-reported levels of
rents was associated with higher eviction economic hardship, life satisfaction, physical
rates. Growth in real rental prices was and mental health. Unlike demographic
calculated by adjusting rental prices for characteristics, these variables are only
inflation using the annual average Consumer available for survey respondents, not for all
Price Index (Statistics Canada, 2021a). household members, so results of these
analyses are not generalizable to the
population of Canadian renters.
Regression analyses
Economic hardship was measured
Logistic regression analyses are on a 5-point scale from “very easy” to “very
used to assess which demographic groups difficult” in response to the question “in the
were most at risk of eviction after controlling past 12 months, how difficult or easy was it
for other characteristics associated with for your household to meet its financial needs
evictions, such as age, province of residence in terms of transportation, housing, food,
and shelter cost to income ratios. Analyses clothing and other necessary expenses?”
are conducted using either an indicator for (Mental) health was assessed on a 5-point
experiencing an eviction within the past five scale from “poor” to “excellent” in response
years or an indicator for one’s previous move to the question “in general, how is your
being an eviction as the dependent variable. (mental) health?” Life satisfaction was not
Coefficients are reported as odds ratios and assessed in the Northwest Territories and
7Understanding Evictions in Canada through the Canadian Housing Survey
was measured on an 11-point scale from appropriate housing. Other outcome
“very dissatisfied” to “very satisfied” in variables include binary indicators for
response to the question “how do you feel whether the respondent experienced a
about your life as a whole right now?” Core decrease in dwelling, neighbourhood or life
housing need, a concept developed by the satisfaction over the past five years. For
CMHC, is an indicator for whether a these analyses, the definition of experiencing
household lives in unaffordable housing an eviction was restricted to evictions that
(defined as a shelter cost to income ratio occurred during the past five years.
greater than 30%), crowded housing, or
housing in need of major repairs and does
not have the required income level to acquire
Results
I estimate that 1.3% of renters (1.2%
of renter households) were evicted in
Sociodemographic
Canada in the year prior to data collection characteristics of renters
(roughly 2018). This is approximately
127,000 people living in 56,000 distinct who are evicted in Canada
households. Over the previous five years, I
estimate that 6.6% of renters (6.0% of renter Evictions are not evenly distributed
households) were evicted. 9.9% of renters across demographic groups in Canada. For
(9.6% of renter households) indicated that a full list of five-year and previous move
their most recent move (regardless of when eviction rates by demographic group, see
it occurred) was an eviction. Using the CHS, Table A1. I estimate that 7.2% of male
Statistics Canada estimated that 330,800 renters were evicted during the past five
Canadian households were forced to move years whereas 6.1% of female renters were
in the previous five years (Statistics Canada, evicted during the past five years. After
2019). My estimates suggest that five out of controlling for sociodemographic
six households that were forced to move characteristics1, there was no relation
were renters even though renters make up between gender and evictions (see Table
only about one third of Canadian A4). Figure 1 displays five-year eviction rates
households. by age group. The highest eviction rate is
observed among renters aged 45 to 54
(8.4%). Children and renters aged 45 and 54
are significantly more likely to be evicted than
younger adults and seniors. Renters over the
age of 75 have a lower five-year eviction rate
than every other age group (2.7%). After
11
Covariates for logistic regression analyses of eviction rates at the individual-level include gender, age group,
immigration category, ethnicity, a gender by ethnicity interaction, education, province of residence, family
composition, shelter cost to income ratio and an indicator for whether they received rental assistance or subsidized
rent at their previous residence.
8Understanding Evictions in Canada through the Canadian Housing Survey
controlling for other sociodemographic of being evicted and renters over the age of
characteristics, relative to renters aged 25 to 75 have lower odds of being evicted.
34, renters aged 45 to 54 have higher odds
Table 1. National eviction rates in Canada.
Previous move Five-year eviction Annual eviction Population
Population
eviction rate (%) rate (%) rate (%) size2
Individuals 9.9 6.6 1.3 9,749,659
[9.0, 10.8] [5.8, 7.5] [0.9, 1.8]
Households 9.6 6.0 1.2 4,640,884
[8.9, 10.4] [5.4, 6.6] [0.9, 1.5]
Note. 95% confidence intervals presented in brackets.
Figure 1. Five-year eviction rates by age group.
Note. Grey bars represent 95% confidence intervals.
2
Population size refers to the number of individual renters or renter households that the data are weighted to
represent. Statistics Canada does not permit releasing the sample size used to generate these estimates.
9Understanding Evictions in Canada through the Canadian Housing Survey
Figure 2 displays five-year eviction significantly higher than all other categories,
rates for households by family composition. single fathers have the highest five-year
Single women had significantly lower five- eviction rate (8.7%) and previous move
year eviction rates (3.9%) than all other eviction rate (15.6%), and significantly higher
family compositions. Combined across the odds of their previous move being an eviction
gender of the parent (see Table A2), single than single men after controlling for
parents have significantly higher five-year sociodemographic covariates3 (see Table
eviction rates than singles and higher A5). Single women have significantly lower
previous move eviction rates than singles odds of eviction within the past five years
and couples without children. Although not than single men.
Figure 2. Five-year eviction rates by household family composition.
Note. Grey bars represent 95% confidence intervals.
3
Covariates for logistic regression analyses of eviction rates at the household-level include province of residence,
family composition, shelter cost to income ratio and an indicator for whether they received rental assistance or
subsidized rent at their previous residence.
10Understanding Evictions in Canada through the Canadian Housing Survey
Figure 3 displays five-year eviction rates by other covariates (see Table A4). If Black
ethnicity. Although these results are not renters were less likely to report their
jointly statistically significant, Indigenous ethnicity than others, this could bias
peoples appear to have higher five-year estimated eviction rates by ethnicity and
eviction rates than other Canadian renters explain the discrepancy with previous
(10.0%). Indeed, Indigenous peoples have results.
marginally significantly higher eviction rates
than other Canadian renters when compared Figure 3 also displays five-year
to all other Canadian renters (see Table A1). eviction rates by immigration category.
In line with the national average, 6.6% of These results should be interpreted with
White Canadians were evicted in the caution as they include forced moves that
previous five years. These results do not occurred outside of Canada. Five-year
align with Leon and Iveniuk’s finding that eviction rates are significantly lower among
Toronto neighbourhoods with larger Black economic immigrants than among non-
populations were more likely to experience immigrants and refugees.
evictions (2020). I also found no evidence
that Black renters had higher eviction rates
than other renters in Toronto or Ontario (not Five-year eviction rates are similar for
reported). However, renters who did not members of the LGBTQ2IA+ community
report their ethnicity (2.5% of the sample) (6.8%) and other renters. Among renters who
have elevated eviction rates (11.1%) and this have ever experienced homelessness, the
is driven by males who did not report their previous move eviction rate was 18.7%,
ethnicity. Males who did not report their significantly more than the 9.1% for other
ethnicity have significantly higher odds of renters.
eviction than white males after controlling for
Figure 3. Eviction rates by ethnicity and immigration category.
Note. Grey bars represent 95% confidence intervals.
1Understanding Evictions in Canada through the Canadian Housing Survey
Eviction rates by There is a marginally significant
relationship between shelter cost to income
socioeconomic status ratios and evictions. Renter households
whose shelter costs are above half of their
In this section, I examine eviction rates in income have marginally higher five-year
Canada by variables related to eviction rates (8.8%) and significantly higher
socioeconomic status. Household income previous move eviction rates (11.8%) than
was adjusted by the square root of those with shelter costs less than 30% of
household size, an adjustment commonly their income (6.1% and 9.1%, respectively).
used by Statistics Canada (e.g., Statistics After controlling for other sociodemographic
Canada, 2021c). There is no significant characteristics, high shelter cost to income
relationship between household income and ratios increase the odds of having
household-level five-year eviction rates. experienced an eviction within the past five
Previous move eviction rates are significantly years (see Table A5).
lower among households with adjusted
annual income between $70,000 and
$90,000 than households with income under
$40,000 (see Table A2).
Figure 4. Five-year eviction rates by shelter cost to income ratio.
Note. Grey bars represent 95% confidence intervals.
The sample is restricted to renters at to complete their education. Although renters
least 25 years of age to assess the with at least a bachelor’s degree have lower
relationship between education and evictions five-year eviction rates than other renters,
without bias caused by renters who have yet the difference was not statistically significant.
1Understanding Evictions in Canada through the Canadian Housing Survey
Previous move eviction rates are significantly sociodemographic characteristics, having a
lower among renters with a bachelor’s bachelor’s degree is related to marginally
degree or higher (7.6%) than renters with no lower previous move eviction rates
(10.9%) or some post-secondary education compared to individuals with no post-
(10.3%). After controlling for other secondary education (see Table A4).
Figure 5. Five-year eviction rates by education level.
Note. Grey bars represent 95% confidence intervals.
I then examine the relation between between renter households’ who received
living in social and affordable housing (SAH) rental assistance or subsidized rent at their
and evictions. As shown in Figure 6, there is previous residence and other renter
no relation between currently living in SAH households. 9.7% of renter households who
and five-year eviction rates. Previous move received rental assistance or subsidized rent
eviction rates are higher among renter at their previous residence were evicted
households currently living in SAH (see within the past five years, significantly higher
Table A2). This could reflect that individuals than the 5.6% of other renter households
who were evicted were more likely to seek who were evicted. Previous affordable
out SAH after experiencing an eviction in the housing is related to increased odds of
past than they are today. Although data on eviction even after controlling for other
whether renters’ previous residence is SAH household characteristics (see Table A5).
was not available, I compare eviction rates
2Understanding Evictions in Canada through the Canadian Housing Survey
Figure 6. Five-year eviction rates by affordable housing status.
Note. Grey bars represent 95% confidence intervals. For current residences, affordable housing is defined as living in
Social and Affordable Housing as defined in the CHS. For previous residences, affordable housing is defined as rent
being subsidized or having received rental assistance.
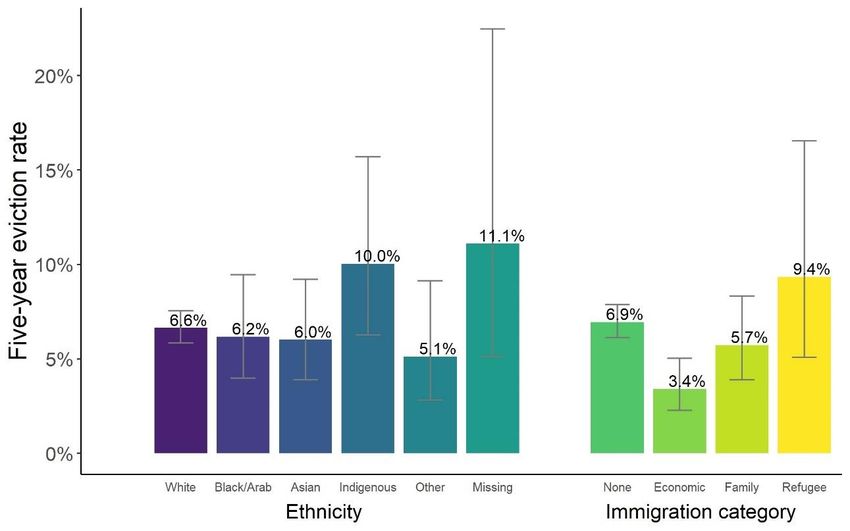
Geographic distribution of with 6.3% of renter households reporting
being evicted within the past five years. After
evictions in Canada controlling for other household
characteristics, living in British Columbia was
associated with 1.7 times higher odds of
Next, I examine the geographic being evicted within the previous five years
distribution of evictions across Canada. compared to Ontario. Québec, Manitoba,
Figure 7 displays estimated five-year eviction Northwest Territories and Nunavut were
rates for each province. Evictions are most associated with significantly lower odds of
common in British Columbia where I estimate eviction than Ontario. Table A3 also reports
that 10.6% of renter households were evicted average annual real growth in rents in each
in the past five years. At the other end of the province between 2013 and 2018. British
spectrum, evictions were much less common Columbia had the highest growth in real rents
in Manitoba, Nunavut and Québec, where I during this period although there is otherwise
estimate that less than 4% of renter no strong relation between growth in real
households were evicted within the past five rents and evictions.
years. Alberta and Ontario lie in the middle
1Understanding Evictions in Canada through the Canadian Housing Survey
Figure 7. Five-year eviction rates by province.
Note. Grey bars represent 95% confidence intervals.
Figure 8 displays eviction rates in Among these groups, evictions are most
Montréal, Toronto, and Vancouver, as well common in Vancouver and least common in
as in other CMAs, census agglomerations Montréal. Eviction rates in Toronto are
(CAs), and areas outside CMAs and CAs. similar to those in other CMAs and CAs.
1Understanding Evictions in Canada through the Canadian Housing Survey
Figure 8. Five-year eviction rates by region.
Note. Grey bars represent 95% confidence intervals.
Eviction rates are also estimated by Toronto or whether households are more
distance to city center in Montréal, Toronto likely to move away from the city center after
and Vancouver (sample sizes were being evicted.
insufficient to estimate five-year eviction
rates; see Table A6). There is no relationship
between distance from city center and Consequences of evictions
eviction rates in Montréal. In Toronto, I
estimate that 21.5% of renter households’
Finally, I examine whether evictions
most recent move was an eviction for
were linked to negative outcomes. Figure 9
households over 20km from the city center,
displays mean levels of self-reported
significantly higher than the 8.6% of renter
economic hardship, health, mental health
households 8-20km from the city center
and life satisfaction for renters whose
whose most recent move was an eviction
previous move was an eviction and renters
and the 7.8% of renter households within
whose previous move was not an eviction.
8km of the city center whose most recent
Renters whose most recent move was an
move was an eviction. In line with Blomley
eviction have significantly higher levels of
and colleagues (2018), Vancouver also
economic hardship than other renters. This
exhibits increasing eviction rates as distance
gap is partially explained by demographic
from the city center increases although the
characteristics and partially explained by
differences are not statistically significant. It
income and education (see Table A7).
is important to note that these distances
However, over 80% of the relationship
reflect renter households’ current location,
between evictions and economic hardship
not the location of their eviction. Thus I
cannot be explained by these variables. The
cannot conclude whether evictions are more
relationship between evictions and economic
common further from the city center in
hardship is stronger than that between either
2Understanding Evictions in Canada through the Canadian Housing Survey
shelter cost to income ratio or being a
refugee, and economic hardship.
Figure 9. Mean outcome variables by whether a renters’ previous move was an eviction.
Note. Grey bars represent 95% confidence intervals. All differences are significant at the 1% level. Economic
hardship, health and mental health were measured on a 0-4 scale (left axis) while life satisfaction was measured on a
0-10 scale (right axis).
Evictions are also related to worse whose most recent move was an eviction
self-reported health outcomes. Figure 9 were also over 3 percentage points more
shows that renters whose most recent move likely to be experiencing core housing need.
was an eviction have lower self-reported Renters who were evicted within the past five
physical and mental health than other years were more likely to report declines in
renters. Demographic characteristics, life, dwelling and neighbourhood satisfaction
income and education attenuate less than during the past five years than other renters.
half of this relationship (see Table A7). This All of these relations, with the exception of
evidence is in line with previous research that dwelling satisfaction, hold after controlling for
has consistently shown that evictions are demographic and socioeconomic controls.
related to negative health outcomes. Renters
3Understanding Evictions in Canada through the Canadian Housing Survey
Discussion
Limitations consequences from evictions so our
estimates of the effect of evictions on health
and economic hardship could also be
There are several limitations that should conservative.
be noted in this research. First, there are
several reasons that our estimates may in On the other hand, our measure of
fact underestimate eviction rates in Canada. evictions included forced moves that were
The question in the 2018 CHS used to caused by banks and governments as well
classify renters as being evicted only asked as landlords. Although any potential bias
respondents about their most recent move. here is likely small given that banks mainly
Evictions that were followed by a voluntary force homeowners, not renters, to move
move would not be included in our estimates. through foreclosures and governments rarely
Second, American research has shown that force renters to move in Canada, it is
survey data, like that used in this report, possible that some forced moves were
tends to underestimate evictions compared misclassified as evictions in this analysis.
to administrative data (Desmond & Kimbro, Another limitation of this study is that location
2015). Third, the sampling frame used for the was assessed based on the renters’ current
CHS excludes Indigenous peoples living on residence rather than the location from which
reserves and individuals experiencing they were evicted. If individuals are more
homelessness. Because there is some likely to move from one province or CMA to
evidence that these groups have higher another after being evicted, this could bias
eviction rates than the general population, our geographic results. However, given that
this may lead to an underestimation of the geographic units of analysis used in this
eviction rates. Individuals who experience report are large, this is unlikely to cause
homelessness after evictions are also likely significant bias.
to be experiencing the largest negative
Conclusion
Despite the limitations of this move was an eviction. Men, and especially
analysis, it represents the first attempt to single fathers, are especially at risk of
estimate eviction rates nationally and for eviction in Canada. Evictions are also more
various demographic groups and geographic common among households with children
regions in Canada. This research revealed and renters aged 45 to 54 than among
several novel findings. Overall, I estimate younger adults and seniors. While the
that 1.3% of renters, approximately 127,000 relation between ethnicity and evictions is not
people, were evicted in 2018. Approximately as strong as that observed in the United
965,000 Canadian renters’ most recent States, there is some evidence that
4Understanding Evictions in Canada through the Canadian Housing Survey
Indigenous renters are at higher risk of and lower self-reported health, mental health
eviction in Canada. Surprisingly, I do not find and life satisfaction. Although this does not
evidence that Black Canadians were more imply a causal link between evictions and
likely to experience evictions than other these outcomes, these relations cannot be
renters, as suggested by Leon and Iveniuk’s explained by demographic or socioeconomic
findings in Toronto (2020). As expected, I characteristics. Given the prevalence of
find households with higher shelter cost to evictions in Canada, and the existing causal
income ratios are more likely to be evicted, research in the United States which shows
while the relation between household income that evictions increase the likelihood of
and evictions is less clear. Renters who homelessness and hospitalization,
received rental assistance at their previous policymakers could work to alleviate the
residence were more likely to be evicted than unequal burden of evictions even without
other renters. further causal research.
Evictions are more common in British Further research on evictions will be
Columbia than any other province or territory. possible when the results of the 2020 CHS
10.6% of renters in British Columbia report are available. This round of the survey asked
being evicted within the past five years, more detailed questions on forced moves
almost four percentage points higher than which separate evictions from other forced
any other province or territory. Less than 4% moves and ask about all previous moves,
of renters in Québec, Manitoba and Nunavut rather than only households’ most recent
were evicted within the past five years. move. Future research should oversample
Eviction rates for Vancouver are similar to vulnerable groups such as Indigenous and
those in British Columbia as a whole and are Black individuals so that eviction rates can be
significantly higher than in Toronto, Montréal estimated for these subpopulations.
and other CMAs. Additional research should focus on
understanding why Indigenous Canadians,
In line with previous American single fathers and residents of British
research, I also find evidence that evictions Columbia are especially at risk of eviction.
are related to increased economic hardship,
5Understanding Evictions in Canada through the Canadian Housing Survey
References
Blomley, N., Perez, N., & Yan, A. (2018). Evictions in the private rental housing market in Metro
Vancouver – preliminary findings. (p. 14). Simon Fraser University.
Burgard, S. A., Seefeldt, K. S., & Zelner, S. (2012). Housing instability and health: Findings from
the Michigan recession and recovery study. Social Science & Medicine, 75(12), 2215–2224.
https://doi.org/10.1016/j.socscimed.2012.08.020
Chum, A. (2015). The impact of gentrification on residential evictions. Urban Geography, 36(7),
1083–1098. https://doi.org/10.1080/02723638.2015.1049480
CMHC. (2019). Characteristics of Households in Core Housing Need. https://www.cmhc-
schl.gc.ca/en/professionals/housing-markets-data-and-research/housing-data/data-
tables/household-characteristics/characteristics-households-core-housing-need-canada-pt-
cmas
CMHC. (2020a). COVID-19: Eviction Bans and Suspensions to Support Renters.
https://www.cmhc-schl.gc.ca/en/consumers/renting-a-home/covid-19-eviction-bans-and-
suspensions-to-support-renters
CMHC. (2020b). Urban Rental Market Survey Data: Average Rents in Urban Centres [Data set].
cmhc-schl.gc.ca/en/data-and-research/data-tables/urban-rental-market-survey-data-average-
rents-urban-centres
Collinson, R., & Reed, D. (2018). The Effects of Evictions on Low-Income Households. 82.
Damon, W., McNeil, R., Milloy, M.-J., Nosova, E., Kerr, T., & Hayashi, K. (2019). Residential
eviction predicts initiation of or relapse into crystal methamphetamine use among people who
inject drugs: A prospective cohort study. Journal of Public Health, 41(1), 36–45.
https://doi.org/10.1093/pubmed/fdx187
Desmond, M. (2012). Eviction and the Reproduction of Urban Poverty. American Journal of
Sociology, 118(1), 46.
Desmond, M., & Gershenson, C. (2017). Who gets evicted? Assessing individual,
neighborhood, and network factors. Social Science Research, 62, 362–377.
https://doi.org/10.1016/j.ssresearch.2016.08.017
6Understanding Evictions in Canada through the Canadian Housing Survey
Desmond, M., & Kimbro, R. T. (2015). Eviction’s Fallout: Housing, Hardship, and Health. Social
Forces, 94(1), 295–324. https://doi.org/10.1093/sf/sov044
Dingman, S. (2020, December 22). Ontario Landlord Tenant Board in chaos after five-month
shutdown. The Globe and Mail. https://www.theglobeandmail.com/canada/toronto/article-
ontario-landlord-tenant-board-in-chaos-after-five-month-shutdown/
Greenberg, D., Gershenson, C., & Desmond, M. (2016). Discrimination in Evictions: Empirical
Evidence and Legal Challenges. Harvard Civil Rights-Civil Liberties Law Review, 51(1), 115–
158.
Himmelstein, G., & Desmond, M. (2021). Association of Eviction With Adverse Birth Outcomes
Among Women in Georgia, 2000 to 2016. JAMA Pediatrics, 175(5), 494–500.
https://doi.org/10.1001/jamapediatrics.2020.6550
Kennedy, M. C., Kerr, T., McNeil, R., Parashar, S., Montaner, J., Wood, E., & Milloy, M.-J.
(2017). Residential Eviction and Risk of Detectable Plasma HIV-1 RNA Viral Load Among HIV-
Positive People Who Use Drugs. AIDS and Behavior, 21(3), 678–687.
https://doi.org/10.1007/s10461-016-1315-z
Kennedy, M. C., McNeil, R., Milloy, M.-J., Dong, H., Kerr, T., & Hayashi, K. (2017). Residential
eviction and exposure to violence among people who inject drugs in Vancouver, Canada.
International Journal of Drug Policy, 41, 59–64. https://doi.org/10.1016/j.drugpo.2016.12.017
Kirkpatrick, S. I., & Tarasuk, V. (2011). Housing Circumstances are Associated with Household
Food Access among Low-Income Urban Families. Journal of Urban Health, 88(2), 284–296.
https://doi.org/10.1007/s11524-010-9535-4
LaPointe, L. (2004). Analysis of evictions under the tenant Protection act in the city of toronto.
http://citeseerx.ist.psu.edu/viewdoc/download?doi=10.1.1.450.1724&rep=rep1&type=pdf
Leifheit, K. M., Schwartz, G. L., Pollack, C. E., Black, M. M., Edin, K. J., Althoff, K. N., &
Jennings, J. M. (2020). Eviction in early childhood and neighborhood poverty, food security, and
obesity in later childhood and adolescence: Evidence from a longitudinal birth cohort. SSM -
Population Health, 11, 100575. https://doi.org/10.1016/j.ssmph.2020.100575
Leon, S., & Iveniuk, J. (2020). Forced Out: Evictions, Race, and Poverty in Toronto (p. 23).
Wellesley Institute. https://www.wellesleyinstitute.com/wp-content/uploads/2020/08/Forced-Out-
Evictions-Race-and-Poverty-in-Toronto-.pdf
7Understanding Evictions in Canada through the Canadian Housing Survey
Lundberg, I., & Donnelly, L. (2019). A Research Note on the Prevalence of Housing Eviction
Among Children Born in U.S. Cities. Demography, 56(1), 391–404.
https://doi.org/10.1007/s13524-018-0735-y
McDonald, L., & Cleghorn, L. (2008). Evictions and Housing Instability (No. 134411). Human
Resources and Social Development Canada. http://www.grandparentfamily.com/wp-
content/uploads/2013/11/Evictions_and_Housing_Instability.pdf
Nande, A., Sheen, J., Walters, E. L., Klein, B., Chinazzi, M., Gheorghe, A. H., Adlam, B.,
Shinnick, J., Tejeda, M. F., Scarpino, S. V., Vespignani, A., Greenlee, A. J., Schneider, D.,
Levy, M. Z., & Hill, A. L. (2021). The effect of eviction moratoria on the transmission of SARS-
CoV-2. Nature Communications, 12(1), 2274. https://doi.org/10.1038/s41467-021-22521-5
Picard, R. (2019). GEODIST: Stata module to compute geographical distances. In Statistical
Software Components. Boston College Department of Economics.
https://ideas.repec.org/c/boc/bocode/s457147.html
Statistics Canada. (2017, October 25). The Daily — Housing in Canada: Key results from the
2016 Census. https://www150.statcan.gc.ca/n1/daily-quotidien/171025/dq171025c-eng.htm
Statistics Canada. (2019). Table 46-10-0044-01: Indicators related to moving.
https://doi.org/10.25318/4610004401-eng
Statistics Canada. (2021a). Consumer Price Index, annual average, not seasonally adjusted.
Statistics Canada. https://doi.org/10.25318/1810000501-eng
Statistics Canada. (2021b). Postal Code Conversion File, February 2021 Postal Codes, 2021
[Data set]. Abacus Data Network. https://hdl.handle.net/11272.1/AB2/SOQYLN
Statistics Canada. (2021c, March 23). The Daily—Canadian Income Survey, 2019.
https://www150.statcan.gc.ca/n1/daily-quotidien/210323/dq210323a-eng.htm
Tranjan, R. (2021, March 30). With more than 250,000 households in arrears, it’s time for rent
forgiveness. Policy Options. https://policyoptions.irpp.org/magazines/march-2021/with-more-
than-250000-households-in-arrears-its-time-for-rent-forgiveness/
Tsai, J., & Huang, M. (2019). Systematic review of psychosocial factors associated with
evictions. Health & Social Care in the Community, 27(3), e1–e9.
https://doi.org/10.1111/hsc.12619
8Understanding Evictions in Canada through the Canadian Housing Survey
Vásquez-Vera, H., Palència, L., Magna, I., Mena, C., Neira, J., & Borrell, C. (2017). The threat
of home eviction and its effects on health through the equity lens: A systematic review. Social
Science & Medicine, 175, 199–208. https://doi.org/10.1016/j.socscimed.2017.01.010
9Understanding Evictions in Canada through the Canadian Housing Survey
Appendix
Table A1. Eviction rates by individual demographic characteristics.
Group Five-year 95% CI P- Previous move 95% CI P-
eviction rate value eviction rate value
Gender 0.003 0.056
Male 7.2a [6.3, 8.2] 10.3 [9.3, 11.4]
Female 6.1b [5.3, 7.1] 9.5 [8.5, 10.5]
AgeUnderstanding Evictions in Canada through the Canadian Housing Survey
Economic 3.4b [2.3, 5.0] 5.0b [3.6, 6.9]
immigrants
Family immigrants 5.7ab [3.9, 8.3] 9.2a [6.8, 12.4]
Refugees/other 9.4a [5.1, 16.5] 10.1ab [5.8, 17.2]
immigrants
Education 0.121 0.001
No post-secondary 7.2 [6.2, 8.3] 10.9a [9.8, 12.2]
education
Some post- 6.3 [5.3, 7.5] 10.3a [9.0, 11.7]
secondary
education
Bachelor's degree 5.3 [4.3, 6.5] 7.6b [6.4, 9.0]
or higher
Population 9,749,659 9,749,659
(individuals)
Note. Cells that do not share subscripts differ significantly from other categories at the 5% level of significance.
Pairwise comparisons were only performed for comparisons with a joint p-value less than 0.05. Population for
education comparison is 6,799,577 renters 25 years of age or older.
11Understanding Evictions in Canada through the Canadian Housing Survey
Table A2. Eviction rates by household characteristics.
Group Five-year 95% CI P- Previous move 95% CI P-
eviction rate value eviction rate value
Family composition
Couple with 7.2ab [5.6, 9.1] 10.2ab [8.4, 12.4]
children
Couple 5.5ab [4.3, 7.0] 8.2a [6.8, 9.9]
Single parent 7.9a [6.0, 10.2] 0.031 12.6b [10.4, 15.2] 0.017
Single 5.3b [4.6, 6.1] 9.3a [8.4, 10.2]
Single father 8.7a [5.2, 14.2]Understanding Evictions in Canada through the Canadian Housing Survey
Table A3. Eviction rates and real growth rate in rent prices by location.
Group Five-year 95% CI Average Previous 95% CI
eviction rate annual real move
rent growth eviction rate
Province/Territory (p < 0.001) (p < 0.001)
Newfoundland 4.9ab [3.1, 7.4] 0.2 9.9ab [7.3, 13.3]
and Labrador
PEI 6.8ab [4.1, 11.1] 1.1 9.6ab [6.4, 14.2]
Nova Scotia 4.9ab [3.5, 6.9] 1.3 7.6ab [5.9, 9.8]
New Brunswick 6.0ab [4.3, 8.3] 0.6 10.7a [8.5, 13.3]
Québec 3.9a [3.1, 4.9] 0.6 7.0b [6.0, 8.3]
Ontario 6.3b [5.1, 7.6] 1.9 9.9a [8.6, 11.4]
Manitoba 3.7a [2.1, 6.2] 2.5 6.6b [4.8, 9.1]
Saskatchewan 5.1ab [3.8, 6.9] 0.0 8.0ab [6.3, 10.1]
Alberta 6.3b [4.9, 8.0] -0.5 9.6a [8, 11.6]
British Columbia 10.6c [8.8, 12.7] 3.3 15.8c [13.7, 18.1]
Yukon 6.6abc [3.1, 13.6] 13.5abc [7.4, 23.3]
NWT 5.1ab [4.0, 6.4] 6.9b [5.7, 8.3]
Nunavut 3.7ab [2.4, 5.7] 8.8ab [6.6, 11.7]
Region (p = 0.002) (p < 0.001)
Toronto 5.8ab [4.2, 8.1] 2.1 9.5ab [7.4, 12.1]
Montréal 4.2a [3.0, 5.8] 0.7 7.3a [5.8, 9.3]
Vancouver 10.5c [8.1, 13.6] 3.6 15.8c [12.9, 19.1]
Other CMAs 5.7ab [5.0, 6.6] 9.5b [8.6, 10.4]
CAs 6.7b [5.0, 8.8] 10.1b [8.2, 12.2]
Outside 5.4ab [4.0, 7.4] 8.5ab [6.8, 10.6]
CMAs/CAs
Population 4,640,884 4,640,884
(households)
Note. Cells that do not share subscripts differ significantly from each other at the 5% level of significance.
13Understanding Evictions in Canada through the Canadian Housing Survey
Table A4. Estimated odds ratios of sociodemographic characteristics on likelihood of eviction.
Eviction in past five years Previous move was an eviction
Variable OR 95% CI OR 95% CI
Gender (ref: male)
Female 1.032 [0.90, 1.19] 1.011 [0.90, 1.14]
Age (ref: 25-34)
0-14 0.921 [0.66, 1.28] 0.984 [0.75, 1.29]
15-24 1.092 [0.80, 1.49] 1.317** [1.01, 1.71]
35-44 1.071 [0.82, 1.40] 1.295** [1.02, 1.64]
45-54 1.372** [1.04, 1.81] 1.949*** [1.54, 2.47]
55-64 1.146 [0.86, 1.52] 1.911*** [1.51, 2.42]
65-74 0.773 [0.53, 1.13] 1.687*** [1.29, 2.22]
75+ 0.455*** [0.29, 0.72] 1.056 [0.76, 1.47]
Immigration category (ref: non-immigrant)
Economic 0.453*** [0.27, 0.75] 0.444*** [0.30, 0.66]
Family 0.779 [0.49, 1.24] 0.835 [0.58, 1.20]
Refugee/Other 1.24 [0.62, 2.46] 0.875 [0.46, 1.65]
Ethnicity × gender (ref: White male)
Black/Arab 0.848 [0.50, 1.44] 0.745 [0.48, 1.16]
Asian 0.851 [0.53, 1.37] 0.777 [0.52, 1.16]
Indigenous 1.378 [0.78, 2.42] 1.183 [0.75, 1.88]
Other 0.815 [0.39, 1.70] 0.735 [0.40, 1.37]
Not stated 2.419* [0.97, 6.03] 2.503*** [1.21, 5.19]
Female × Black 0.997 [0.69, 1.45] 1.002 [0.74, 1.36]
Female × Asian 0.956 [0.71, 1.29] 0.983 [0.77, 1.26]
Female × Indigenous 0.922 [0.59, 1.45] 0.954 [0.67, 1.37]
Female × Other 0.604 [0.29, 1.25] 0.696 [0.37, 1.29]
Female × Not stated 0.396* [0.14, 1.14] 0.397** [0.18, 0.88]
Education (ref: no post-secondary)
Some post-secondary 0.963 [0.76, 1.22] 1.022 [0.86, 1.22]
Bachelor’s or higher 0.806 [0.61, 1.06] 0.813* [0.65, 1.02]
Population size 9,553,700 9,553,700
Note. * p < 0.10, ** p < 0.05, *** p < 0.01. Coefficients reported are odds ratios from a logistic regression. Province,
shelter cost to income ratio, family composition and previous affordable housing were also included as controls.
14Understanding Evictions in Canada through the Canadian Housing Survey
Table A5. Estimated odds ratios of household characteristics on likelihood of eviction.
Eviction in past five years Previous move was an eviction
Variable OR 95% CI OR 95% CI
Family composition (ref: single man)
Couple with kids 1.10 [0.78, 1.55] 0.99 [0.75, 1.30]
Couple 0.86 [0.62, 1.20] 0.81 [0.63, 1.05]
Single father 1.29 [0.70, 2.39] 1.57** [1.01, 2.44]
Single mother 1.06 [0.71, 1.59] 1.07 [0.79, 1.46]
Single woman 0.56*** [0.42, 0.76] 0.76** [0.62, 0.95]
Previous residence was affordable housing
Yes 1.80*** [1.31, 2.48] 1.71*** [1.34, 2.17]
Shelter cost to income ratio (ref: 50% 1.45** [1.06, 1.99] 1.27** [1.00, 1.62]
Province (ref: Ontario)
Newfoundland and
Labrador 0.74 [0.44, 1.23] 0.96 [0.66, 1.40]
Prince Edward Island 1.15 [0.65, 2.03] 1.01 [0.64, 1.61]
Nova Scotia 0.82 [0.54, 1.25] 0.78 [0.56, 1.07]
New Brunswick 1.03 [0.68, 1.55] 1.14 [0.85, 1.54]
Québec 0.64*** [0.47, 0.89] 0.72*** [0.57, 0.91]
Manitoba 0.57* [0.32, 1.04] 0.64** [0.44, 0.94]
Saskatchewan 0.80 [0.55, 1.18] 0.78 [0.58, 1.05]
Alberta 1.01 [0.72, 1.41] 0.98 [0.76, 1.28]
British Columbia 1.77*** [1.31, 2.38] 1.71*** [1.36, 2.16]
Yukon 0.99 [0.42, 2.32] 1.31 [0.66, 2.58]
Northwest Territories 0.75* [0.53, 1.05] 0.64*** [0.49, 0.83]
Nunavut 0.41*** [0.24, 0.70] 0.67** [0.45, 0.98]
Population size 4,640,884 4,640,884
Note. * p < 0.10, ** p < 0.05, ***
p < 0.01. Coefficients reported are odds ratios from a logistic regression.
15You can also read