PNB Housing Finance Ltd - Issuer Profile February 2018 Ratings
←
→
Page content transcription
If your browser does not render page correctly, please read the page content below

Ratings

  PNB Housing Finance Ltd
  Issuer Profile
  February 2018
About CRISIL Issuer Profile

CRISIL Issuer Profile is part of CRISIL Ratings’ ongoing efforts to enhance lenders’ and investors’ understanding of
the credit risk profiles of large and regular issuers in India’s debt market and banking system.

Analytical Contacts:

Krishnan Sitaraman                                            Ajit Velonie
Senior Director – CRISIL Ratings                              Director – Financial Sector Ratings
Email: krishnan.sitaraman@crisil.com                          Email: ajit.velonie@crisil.com

Subhasri Narayanan                                            Rahul Malik
Associate Director, LCG-Rating Finance Sector                 Manager - Financial Sector Ratings
Email: subhasri.narayanan@crisil.com                          rahul.malik@crisil.com
Contents                                                                                                                                                 Page
Company Description . . . . . . . . . . . . . . . . . . . . . . . . . . . . . . . . . . . . . . . . . . . . . . . . . . . . . . . . . . . . . . . . . . . 2
Shareholding Pattern as on December 31, 2017 . . . . . . . . . . . . . . . . . . . . . . . . . . . . . . . . . . . . . . . . . . . . . . . 2
Key Milestones. . . . . . . . . . . . . . . . . . . . . . . . . . . . . . . . . . . . . . . . . . . . . . . . . . . . . . . . . . . . . . . . . . . . . . . . 3
Crisil Rated Debt Instruments . . . . . . . . . . . . . . . . . . . . . . . . . . . . . . . . . . . . . . . . . . . . . . . . . . . . . . . . . . . . 4
Rating history. . . . . . . . . . . . . . . . . . . . . . . . . . . . . . . . . . . . . . . . . . . . . . . . . . . . . . . . . . . . . . . . . . . . . . . . . 4
Board of Directors . . . . . . . . . . . . . . . . . . . . . . . . . . . . . . . . . . . . . . . . . . . . . . . . . . . . . . . . . . . . . . . . . . . . . 5
Top Management . . . . . . . . . . . . . . . . . . . . . . . . . . . . . . . . . . . . . . . . . . . . . . . . . . . . . . . . . . . . . . . . . . . . . . 6
PNB Housing’s Organisation Structure . . . . . . . . . . . . . . . . . . . . . . . . . . . . . . . . . . . . . . . . . . . . . . . . . . . . . 7
Summary Credit Risk Profile . . . . . . . . . . . . . . . . . . . . . . . . . . . . . . . . . . . . . . . . . . . . . . . . . . . . . . . . . . . . . 8
Detailed Credit Risk Profile . . . . . . . . . . . . . . . . . . . . . . . . . . . . . . . . . . . . . . . . . . . . . . . . . . . . . . . . . . . . . . 9
     -    Expectation of Strong Support From Promoter Shareholder, PNB . . . . . . . . . . . . . . . . . . . . . . . . . . . . 9
     -    Market Position . . . . . . . . . . . . . . . . . . . . . . . . . . . . . . . . . . . . . . . . . . . . . . . . . . . . . . . . . . . . . . . . . 10
     -    Asset Quality . . . . . . . . . . . . . . . . . . . . . . . . . . . . . . . . . . . . . . . . . . . . . . . . . . . . . . . . . . . . . . . . . . . 12
     -    Resources . . . . . . . . . . . . . . . . . . . . . . . . . . . . . . . . . . . . . . . . . . . . . . . . . . . . . . . . . . . . . . . . . . . . . 13
     -    Capital Adequacy. . . . . . . . . . . . . . . . . . . . . . . . . . . . . . . . . . . . . . . . . . . . . . . . . . . . . . . . . . . . . . . . 14
     -    Earnings . . . . . . . . . . . . . . . . . . . . . . . . . . . . . . . . . . . . . . . . . . . . . . . . . . . . . . . . . . . . . . . . . . . . . . 15
     -    ALM and Liquidity . . . . . . . . . . . . . . . . . . . . . . . . . . . . . . . . . . . . . . . . . . . . . . . . . . . . . . . . . . . . . . . 16
     -    Management . . . . . . . . . . . . . . . . . . . . . . . . . . . . . . . . . . . . . . . . . . . . . . . . . . . . . . . . . . . . . . . . . . . 16
Product and Process overview . . . . . . . . . . . . . . . . . . . . . . . . . . . . . . . . . . . . . . . . . . . . . . . . . . . . . . . . . . . 17
     -    Product Overview. . . . . . . . . . . . . . . . . . . . . . . . . . . . . . . . . . . . . . . . . . . . . . . . . . . . . . . . . . . . . . . . 17
     -   Process Overview. . . . . . . . . . . . . . . . . . . . . . . . . . . . . . . . . . . . . . . . . . . . . . . . . . . . . . . . . . . . . . . . 18
     -   Loan Underwriting and Risk Structure . . . . . . . . . . . . . . . . . . . . . . . . . . . . . . . . . . . . . . . . . . . . . . . . 19
     -   Collection Process . . . . . . . . . . . . . . . . . . . . . . . . . . . . . . . . . . . . . . . . . . . . . . . . . . . . . . . . . . . . . . . 19
Collection Process . . . . . . . . . . . . . . . . . . . . . . . . . . . . . . . . . . . . . . . . . . . . . . . . . . . . . . . . . . . . . . . . . . . . 20
PNB Housing in Comparison with other HFCs. . . . . . . . . . . . . . . . . . . . . . . . . . . . . . . . . . . . . . . . . . . . . . . . 23
Key Financials . . . . . . . . . . . . . . . . . . . . . . . . . . . . . . . . . . . . . . . . . . . . . . . . . . . . . . . . . . . . . . . . . . . . . . . 24
Detailed Organisation Structure . . . . . . . . . . . . . . . . . . . . . . . . . . . . . . . . . . . . . . . . . . . . . . . . . . . . . . . . . 26
Ratings
Company Description
About the company
PNB Housing is amongst top five housing finance companies (HFCs) in India. The company benefits from the
strong brand of PNB as well as from its customer-oriented business model which enables it to maintain strong
growth. It has a pan-India presence through a network of 73 branches as on September 30, 2017.
PNB Housing provides retail housing loans for construction, purchase, repair, and upgradation of houses, as well
as purchase of residential plots. It also provides loans against property (LAP) and loans for commercial property.
On the wholesale side, the company provides construction finance, lease rental discounting (LRD) and Corporate
term loans (CTL) to real estate developers.
Shareholding Pattern as on December 31, 2017
37.3% Quality Investment Holdings
33.0%
Punjab National Bank
17.1%
Foreign Institutional Investor
(FII)/Foreign Portfolio Investors (FPI)
6.5%
Mutual Funds
4.3%
Public & Others
1.4%
Bodies Corporates
0.5%
Financial Institutions / Banks
2Key Milestones
— As on December 29, 2017, the market capitalisation of PNB Housing stood at
Rs 22,316 crore
2018 — AUM crossed Rs 50,000 crore as on September 30, 2017
— AUM cross Rs.41000 crore as on March 31, 2017
— Raised Rs.3000 crore from the IPO in November 2016 and listing on NSE & BSE
2017 — Raised ECB of USD 150 million from Asian Development Bank (ADB) in June 2016
— During fiscal 2017, Destimoney Enterprises Limited transferred equity shares in PNB
Housing to its holding Company i.e. Quality Investments Holdings pursuant to in specie
distribution of its assets as per winding up scheme.
— Raised third and final tranche of rights issue of Rs.300 crore
2016 — Deposits cross Rs.7000 crore as on March 31, 2016
— AUM cross Rs.27000 crore as on March 31,2016
— Raised Rs.500 crore through green bonds from IFC
— Raised second tranche of rights issue of Rs.300 crore
— AUM cross Rs.16800 crore as on March 31, 2015
— Deposits cross Rs.4800 crore as on March 31, 2015
2015 — In February 2015, NSR Partners sold its stake in Destimoney to a new strategic investor, the
Carlyle Group
— Raised ECB of USD 100 million from International Finance Corporation (IFC)
— Raised first tranche of rights issue of Rs.400 crore
2014 — AUM cross Rs.10000 crore as on March 31, 2014
— Deposits cross Rs.1500 crore as on March 31, 2014
PNB Housing celebrates its silver jubilee year; starts reaping benefits of project Kshitij –AUM
2013 reach Rs.6620 crore as on March 31, 2013
2012 Destimoney’s stake increases to 49% on conversion of CCDs into equity
— PNB Housing initiates ‘Kshitij’ – a business process transformation and
reengineering (BPR) project
— Destimoney infuses Rs.137 crore capital into PNB Housing in the form of
2010
compulsorily convertible debentures (CCDs)
2009 PNB sells 26% stake in PNB Housing to Destimoney
2006 Assets under management (AUM) cross Rs.1000 crore
1988 Incorporated as a wholly owned subsidiary of PNB
3Ratings
CRISIL Rated Debt Instruments
CRISIL has been rating PNB Housing's debt instruments since 1995. The rated debt instruments are:
Table 1: PNB Housing's CRISIL-rated debt instrument details
Instruments Rs. Crore Rating
Non-convertible Debentures 4600 CRISIL AA+/Stable
Bonds 1100 CRISIL AA+/Stable
Lower Tier-II Bonds 500 CRISIL AA+/Stable
Long-Term Bank Facilities 4000 CRISIL AA+/Stable
Commercial Paper Programme 16000 CRISIL A1+
Fixed Deposit Programme 14500 FAAA/Stable
Rating History
Date Rating Outlook Rating Action
June 2017 CRISIL AA+/FAAA/CRISIL A1+ Stable Revision in outlook
March 2016 CRISIL AA+/FAAA/CRISIL A1+ Negative Revision in outlook
Rating upgrade on long-term debt
December 2013 CRISIL AA+/FAAA/CRISIL A1+ Stable
instruments and fixed deposit programme
July 2013 CRISIL AA/FAA+/CRISIL A1+ Positive Revision in outlook
Rating downgrade on long-term debt
February 2010 CRISIL AA/FAA+/CRISIL A1+ Stable instruments and fixed deposit programme
Ratings on long-term debt instruments and
fixed deposit programme placed on
December 2009 CRISIL AA+/FAAA/CRISIL A1+ -
'Ratings Watch with Developing
Implications'
April 2009 CRISIL AA+/FAAA/CRISIL A1+ Negative Revision in outlook
Rating upgrade on long-term debt
September 2004 CRISIL AA+/FAAA/CRISIL A1+ Stable
instruments and fixed deposit programme
September 2003 CRISIL AA/FAA+/CRISIL A1+ Stable -
August 2002 CRISIL AA/FAA+ - -
July 2002 FAA+ - Rating upgrade on fixed deposit programme
October 2000 FAA- - Rating upgrade on fixed deposit programme
December 1999 FA+ - Rating upgrade on fixed deposit programme
Rating downgrade on fixed deposit
December 1998 FA- -
programme
September 1995 FA - -
4Board of Directors
Name Designation Profile
Shri Sunil Mehta Chairperson A seasoned banker with over 35 years of rich
MD and CEO, PNB (PNB Nominee) experience in various administrative and functional
capacities at Branches, Zonal, Head Offices. Prior to
assuming the position of MD & CEO of Punjab National
Bank, he was Executive Director of Corporation Bank.
Dr. Ram S Sangapure Director Executive Director of PNB. Prior to joining PNB, he had
Executive Director, PNB (PNB Nominee) worked with IDBI Bank and Central Bank of India.
Mr. Sunil Kaul Director He has over 25 years’ experience in corporate and
(Carlyle Group Nominee) consumer banking of which more than 15 years have
been in Asia. He has served as the president of
Citibank Japan, overseeing the banks corporate and
retail banking operations. He concurrently served as
the chairman of Citi’s credit card and consumer
finance companies in Japan.
He retired from Citibank in June 2000 after working for
Mr. Shital Kumar Jain Independent Director
more than 31 years. He held the post of Senior Credit
Officer for more than 18 years
A chartered accountant with an experience of over 30
Mr Ashwani Kumar Gupta Independent Director years in corporate finance, treasury, capital
management and asset reconstruction.
Mr. R Chandrasekaran Independent Director He is the Executive Vice Chairman of Cognizant India
He is Professor of Finance XLRI Jamshedpur, Xavier
Prof. (Dr) Gourav Vallabh Independent Director
School of Management, Jamshedpur
Mr. Nilesh S Vikamsey Independent Director He is senior partner at KHIMJI KUNVERJI & CO,
Chartered Accountants.
Mrs. Shubhalakshmi Panse Independent Director She has 38 years’ experience in the field of Banking,
particularly in Corporate Credit appraisal, Credit
Monitoring, NPA management, Planning, Project
appraisal and also in Economics, Finance and
Information Technology
Mr. Sanjaya Gupta Managing Director He has experience of over 30 years in the financial
industry spanning organisations like HDFC Ltd, ABN
Amro Bank NV, AIG INC
5Ratings
Top Management
Name Designation Experience in Years
Mr. Sanjaya Gupta Managing Director 30 years
Mr. Shaji Varghese ED & Business Head 22 years
Mr. Ajay Gupta ED & Chief Risk Officer 27 years
Mr. Nitant Desai Chief Centralised Operations and Technology Officer 33 years
Mr. Anshul Bhargava Chief People Officer 25 years
Mr. Sanjay Jain Company Secretary and Head Compliance 29 years
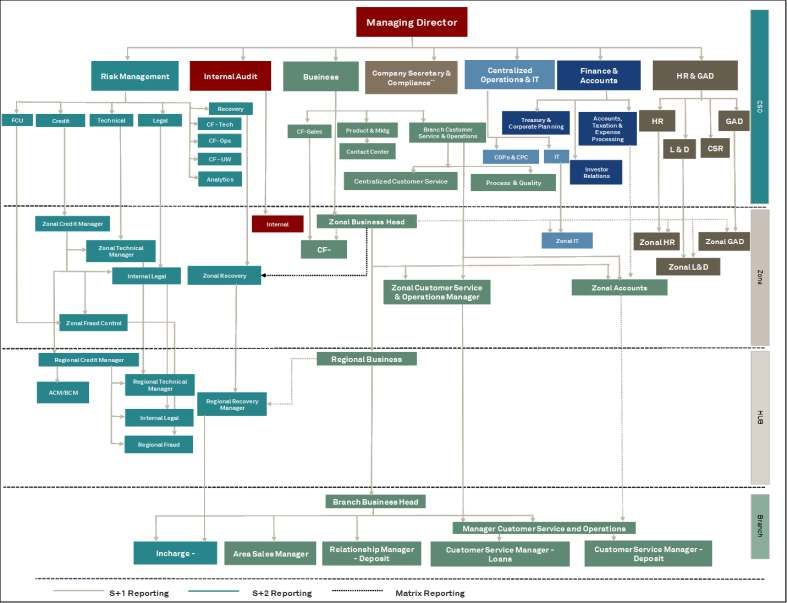
6PNB Housing's Organisation Structure: Summary
Managing Director
Company Secretary & Centralized Finance &
Risk Management Internal Audit Business Operations & IT HR & GAD
Compliance`` Accounts
CSO
Recovery
FCU Credit Technical Legal Treasury & Accounts,
CF - Tech Taxation &
HR GAD
Corporate Planning
CF-Sales Product & Mktg Branch Customer Expense
Service & Operations
CF- Ops Processing
Contact Center L&D CSR
CF - UW COPs & CPC IT
Investor
Analytics Cent ralized Customer Service Relations
Process & Quality
7Ratings
Summary Credit Risk Profile
Parent Support
— PNB Housing continues to benefit from the expectation of support from its promoter shareholder, PNB given the
increasing strategic importance of PNB Housing to PNB and the latter’s high moral obligation.
Business risk profile Financial risk profile
Market position Capital adequacy
— Fifth-largest player among HFCs; however, market — Comfortable capitalisation with net worth and Tier-I
share in overall housing finance is moderate capital adequacy ratio (CAR) of Rs. 5880 crore and
— AUM grew by 47% (y-o-y) to Rs. 51,320 crore as on 13.99%, respectively, as on September 30, 2017
September 30, 2017; company to maintain higher- — The company raised Rs. 3000 crore through an IPO in
than-industry average growth over the medium term November 2016, and this will support its strong growth
— AUM comprised of housing loans (59%), construction plans in the medium -term
finance (12%), LAP# (21%), and corporate term loan* — Adjusted Gearing decreased to 8.1 times as on
(8%) as on September 30, 2017 September 30, 2017 given the infusion through the IPO.
— AUM is well diversified across India; with northern, Over the medium-term, gearing is expected to remain
western and southern India contributing around 34%, between 11-12 times on a steady state basis
37% and 29%, respectively, as on September 30, 2017 — Comfortable net worth coverage of net non-
performing assets (NPAs) provides cushion against
asset-side risks
Asset Quality Earnings
— PNB Housing has robust credit underwriting, — Average earnings profile with return on assets (RoA,
monitoring, and collection processes annualised) of 1.63% in the first half of fiscal 2018.
Profitability to remain lower than industry average
— Two-year lagged gross NPAs have remained
over the near -term because of continued investment
comfortable at 0.51% as on March 31, 2017, supported
in infrastructure, technology, manpower and
by improved systems and processes
processes to support scale-up of operations
— Impact of seasoning, however, remains to be seen — Profitability expected to improve gradually over the
given the strong growth over the past four years, medium -term, supported by enhanced operating
especially in the non-housing portfolio efficiencies with ramp-up of operations
— Ability to maintain asset quality while increasing scale — Net interest margins (NIMs) expected to remain stable
remains a monitorable despite high proportion of non-housing loans, given
the increased focus on highly competitive salaried
customer segment for growth in the housing loan
segment
Resources Liquidity
— Well-diversified resource profile comprising bank — Comfortable asset-liability management (ALM) profile
loans, bonds debentures, fixed deposits, NHB with manageable negative cumulative mismatches
refinance and external commercial borrowings and — Policy of maintaining unutilised bank lines/liquid
green bonds. investments for cash outflows over the next two
— Second largest deposit base among HFCs months
— Significant increase in focus on relatively stable fixed — Adequate unutilised bank lines of Rs. 923 crore as on
deposits (23% of borrowings as on September 2017) September 30, 2017
over the past two years to lend stability and diversify
the investor profile
— Better than peers’ cost of borrowing
Management
— Management has strong domain knowledge and established track record; instrumental in transformation of PNB
Housing into a professionally managed company
# LAP includes Retail LAP (16%) + Retail LRD (2%) + NRPL (3%)
* Corporate term loan includes corporate term loan (5%) + corporate LRD (3%)
8Detailed Credit Risk Profile
Expectation of Support from Promoter Shareholder, PNB
— PNB Housing continues to benefit from the expectation of support from its promoter shareholder, PNB
(33% ownership currently) given the increasing strategic importance of PNB Housing to PNB and the
latter’s high moral obligation towards PNB Housing. While PNB’s stake has reduced from 51% following an
initial public offering (IPO) and offer for sale (OFS), CRISIL believes the bank will remain the key strategic
shareholder of PNB Housing and will continue to play a key role in the latter’s strategic decision-making
process.
— PNB will continue to have representation on the board of PNB Housing. PNB’s Managing Director and Chief
Executive Officer is the Chairperson of PNB Housing and one Executive Director of PNB is part of the
company’s Board of Directors.
— PNB Housing will continue to benefit from common branding with its parent, which is a leading public
sector bank in India, having a strong retail and corporate presence.
— PNB Housing’s strategic importance remains high for its parent, as the company’s loan portfolio grew at a
healthy pace over the past four years, and constitutes around 81% of the overall housing loan portfolio of
the PNB group.
CRISIL believes that PNB Housing will continue to benefit from the expectation of support from its
promoter shareholder, PNB, over the medium term. The extent of ownership by, and support from, PNB, and
any change in CRISIL’s opinion on PNB Housing’s strategic importance to PNB, or any change in CRISIL’s
ratings on PNB, will, however, remain key rating sensitivity factors.
9Ratings
Market Position
Chart 1: Trend in AUM
600
513
500 415 42
400 30 110
Rs '00 Crore
276 92 57
300 17
173 44
64
200 106 9
66 25
44 304
4 12 249
100 27 6
17 21 108
170
46 69
-
Mar-13 Mar-14 Mar-15 Mar-16 Mar-17 Sep-17
As on
Housing Construction Finance LAP# Corporate Term loan*
#LAP includes Retail LAP +Retail LRD+ NRPL
*Corporate term loan includes corporate term loan + Corporate LRD
CRISIL believes that the company will maintain its above-industry-average growth rate over the next few years,
which will result in increase in its market share in the highly competitive industry
— The company has managed to develop a good in-house team which has sourced 64% of the incremental
business in the first half of fiscal 2018. A total of 21 underwriting hubs support its operations and will
support the scale-up over the medium-term.
Chart 2: Portfolio Constitution** Chart 3: Geographical Split**
*Corporate
Term Loans
8%
Construction
Finance South North
12% 29% 34%
Home Loans
#LAP 59%
21%
West
37%
**based on AUM **based on AUM
#LAP includes Retail LAP +Retail LRD+ NRPL
*Corporate term loan includes corporate term loan + Corporate LRD
10Over the medium -term, PNB Housing is expected to maintain a similar proportion of housing loans, non-housing
loans (loans against property and corporate term loans) and construction finance.
— Within the housing loan segment, focus remains on sourcing business from employees of large corporates by
offering competitive value proposition relative to other lenders. In the home loan portfolio, salaried segment
accounted for 65% of the total home loan as on September 30, 2017 compared to 61% as on March 31, 2016.
— About 33% of the incremental housing loan business continues to be from self-employed—higher-income
individuals with relatively higher-ticket-size loans and better debt-servicing capacity. PNB Housing also
intends to increase its focus on affordable housing segment given the strong demand potential and strong
impetus given to the sector by the Government of India.
— In line with target customer and product strategy, PNB Housing has expanded its branch network to 73 by
September 30, 2017. The company has opened 10 new branches in the first half of fiscal 2018.
While PNB Housing is the fifth-largest and the fastest-growing HFC, it is still a relatively small player in the
overall housing finance market, which is dominated by banks. Furthermore, it faces intense competition
from both banks and other housing finance companies given their strong focus on mortgage finance.
Notwithstanding, CRISIL believes PNB Housing is well poised to continue to report higher than industry
average growth in AUM
11Ratings
Asset Quality
— PNB Housing’s gross non-performing assets (NPAs) have declined steadily over the past four years
supported by complete revamp of business model and continued focus on recoveries from delinquencies in
old portfolio. Its gross NPAs at 0.34% as on September 30, 2017, were significantly lower than that of many
of its peers.
— Even on a segment wise basis, GNPAs remain comfortable. However, impact of seasoning is yet to be seen
as nearly 77% of the loan book is relatively new, having a tenor of less than 24 months. Furthermore, given
the rising proportion of large-ticket wholesale loans, asset quality performance in this segment remains to
be seen.
— Strong credit underwriting, monitoring, and collection mechanisms support its asset quality:
¡ Centralised hubs for standardised credit decision-making process.
¡ Strengthened the underwriting team by induction of qualified and experienced subject matter experts.
¡ Dedicated team at head office for underwriting construction finance.
¡ Regular review of all large value loans and the delinquent portfolio.
¡ Focused risk management team for monitoring the portfolio risk characteristics. Detailed portfolio
analysis on a regular basis to evaluate the portfolio quality.
¡ Regular portfolio review by the Credit Committee of Board of PNB Housing to identify early warning
signs.
¡ Streamlined collection process through centralised recovery monitoring, dedicated collection
resources at branches, and regular follow-up from hubs.
Chart 4 : Trend in Gross NPAs Chart 5: Segment-wise Gross NPAs
1.40
1.17 *
CTL 0.00%
1.20
1.00 0.85
CF 0.17%
0.80
Percent
0.56 0.56
0.52 0.51
0.60 #
LAP 0.42%
0.32
0.40
0.20 0.22 0.22
0.20 HL 0.39%
0.00
Mar 13 Mar-14 Mar-15 Mar-16 Mar-17 0.00% 0.10% 0.20% 0.30% 0.40% 0.50%
Gross NPA 2 year Lagged Gross NPA
Gross NPAs as on Sept 30, 2017
#LAP includes Retail LAP +Retail LRD+ NRPL
*Corporate term loan includes corporate term loan + Corporate LRD
Further, PNB Housing’s average weighted loan-to-value (LTV) ratio across segments remain comfortable
80%
70%
60%
50%
40%
30% 68% 68%
60%
20% 49%
10%
0%
Housing Loan LAP Construction Finance Corporate Term Loans
CRISIL believes PNB Housing’s focus on strengthening and standardising its systems and processes has
started to yield benefits for the company. Reported asset quality metrics have remained better than the
industry average; however, seasoning in the portfolio is limited. The company’s ability to manage asset
quality along with increasing scale remains a key monitorable, especially for its non-housing loan book.
12Resources
— Resource profile is well-diversified with adequate proportion of wholesale and retail borrowings. The
company benefits from the PNB brand in accessing both institutional and retail investors, especially long-
term investors such as insurance companies, provident, and pension funds.
— A significant proportion of its funding is long-term to match the long tenure of its loan portfolio.
— PNB Housing has increased focus on mobilising relatively stable retail fixed deposits. Significant
investments have been made in building teams, technology and systems to mobilise retail fixed deposits
and enhance customer service. PNB Housing is one of the few HFCs to have such high proportion of
relatively stable retail fixed deposits and plans to further increase the share of deposits in the near-term.
— PNB Housing had a competitive cost of borrowing of 7.9% (annualised) for the first half of fiscal 2018 against
8.6% for fiscal 2017 and 8.7% for fiscal 2016.
— Further, PNB Housing has managed to attract diversified set of investors for their issuances
Chart 6: Trend in Resource Mix Chart 7: Trend in Cost of Borrowing
10.0
100% 4 2 4 3 9.2 9.3 9.3
13 10
19 12 15
8.6 8.7 8.6
80% 15 11 8
9.0
14 6
8
7.9
27 23
28 8.0
Percent
60%
41 27
42 7
7
40% 22 8 7.0
20% 41 46
34 36 6.0
31 27
0% 5.0
Mar 13 Mar 14 Mar-15 Mar 16 Mar 17 Sep-17 2011-12 2012-13 2013-14 2014-15 2015-16 2016-17 Sep-17
As on
For the period
Bond & Debentures Banks (TL & OD) Fixed Deposits
Borrowing cost
NHB Refinance Commercial Paper ECB
Chart 8: investors in bonds Chart 9: investors in CP
Trusts 39.3%
Mutual Funds 19.7%
Other Bodies Corporates 9.6%
Financial Institutions 9.4% Banks
40%
Non-Nationalised Banks 8.7% Mutual
Funds
Nationalised Banks 8.6% 60%
Foreign Portfolio Investors
3.4%
(Corporate)
Central Government Organisation 1.2%
Others 0.1%
CRISIL believes PNB Housing will maintain a well-diversified resource profile and competitive borrowing
costs over the medium term.
13Ratings
Capitalisation
— PNB Housing has comfortable capitalisation metrics with networth, and Tier-I, and overall CAR of Rs. 5880
crore, 13.99%, and 18.38%, respectively, as on September 30, 2017.
— PNB Housing’s adjusted gearing (including securitisation) was 8.1 times as on September 30, 2017. PNB
Housing plans to maintain gearing between 11-12 times on a steady-state basis over the medium term.
— PNB Housing’s capitalisation has been supported by regular equity capital support from its shareholders
over the past few years. In November 2016, PNB Housing raised Rs. 3000 crore via an IPO which will support
its strong growth plans over the medium -term.
— PNB Housing had very high networth coverage of net NPAs at 46 times, as on September 30, 2017, which
provides adequate cushion against asset-side risks.
Chart 10: Trend in Net worth and Net Chart 11: Trend in Capital Adequacy Ratios
worth to Net NPAs Ratios
7,000 14.0 25.0
12.4 21.62
6,000 11.1 11.0 10.9 12.0 18.38
20.0
5,000 10.0
8.1 14.40
15.0 13.40 13.80 12.70
Rs. Crore
4,000 6.9 8.0
Percent
Times
16.48
13.99
3,000 6.0
10.0
10.41
2,000 4.0 10.38
9.78
9.04
5.0
1,000 2.0
621 935 1581 2146 5577 5880
- 0.0 0.0
Mar-13 Mar-14 Mar-15 Mar-16 Mar-17 Sep-17 Mar-13 Mar-14 Mar-15 Mar-16 Mar-17 Sep-17
As on As on
Adjusted Networth (LHS) Gearing (RHS)
Overall CAR Tier 1 CAR
CRISIL believes PNB Housing’s successful listing has enhanced its ability to raise equity capital and will
regularly support its ambitious growth plans, improve accretions to net worth, and maintain steady-state
gearing between 11-12 times will remain key monitorables.
14Earnings
— PNB Housing’s return on assets (RoA) has improved to 1.63% for the first half ended September 2017
against 1.44% for fiscal 2017; in line with industry average, however, sustainability of the improvement in
profitability needs to be demonstrated.
— Operating costs for PNB housing remained high mainly because of the large investment in the enterprise
system solution, people, infrastructure, and refurbishment of branches. These investments will yield
benefits as the company scales up operations. Increase in operating costs has also been because of an
increase in the cost of loan acquisition, driven by higher-than-industry-average growth, which the company
amortises over the average tenure of loans. Operating expenses will remain high over the near term
primarily because of the branch expansion plans to support the company’s future growth plans and
increased spend on the advertising campaign.
— PNB Housing’s profitability will improve further over the medium-term, supported primarily by increased
operating efficiencies. PNB Housing’s earnings profile remains susceptible to increase in credit costs
because of the impact of seasoning of loan book and increase in delinquencies in the non-housing loan
portfolio. Furthermore, the company’s ability to maintain interest spreads amid increased competition
remains to be seen.
— Company has made contingency reserve of INR 65.48 Crore as on Sep-17.
Chart 12: Trend in RoA and RoE Chart 13: RoA (annualised) breakup for first half
ended September 2017
% %
1.80 1.63 20.00
17.49
1.60 15.75 1.30 15.59 18.00
1.44 0.90%
1.40 16.00
1.48 14.00
1.20 1.34 0.41%
16.33 1.28 13.57 13.72 12.00
1.00
10.00
0.80 0.87%
8.00 3.80%
0.60
6.00
0.40 4.00
0.20 1.63%
2.00
0.00 0.00
2012-13 2013-14 2014-15 2015-16 2016-17 H1
2017-18 NIM Opex Credit Cost Tax Post-Tax
RoA
Return on assets (LHS) Return on Equity (RHS)
CRISIL believes PNB Housing’s ability to increase its scale of operations to leverage significant upfront
investments while maintaining its asset quality, and hence, controlling credit costs, will be key to achieving
gradual improvement in its earnings profile.
15Ratings
ALM and Liquidity
— PNB Housing has a comfortable ALM profile, with positive cumulative mismatches in maturity buckets of up
to one year as on September 30, 2017. The company has positive cumulative mismatches in the first
maturity bucket of up to 30 days, supported by liquid investments.
— PNB Housing has a policy of maintaining unutilised bank lines/liquid investments to meet cash outflows
over the next two months.
- PNB Housing has adequate liquidity in the form of unutilised bank lines of Rs.923 crore, including from
the parent PNB (Rs.155 crore as on September 30, 2017)
— PNB Housing has investment in Statutory Liquidity Ratio (SLR) securities of Rs.1103 crore, against a
requirement of Rs 1,089 crore and in current investment of Rs. 2173 crore as on September 30, 2017
Management
— Despite PNB being a large promoter shareholder, in line with the private-partnership model with its
strategic partner, PNB Housing is being managed by an independent management team. The management
team under the leadership of Mr. Sanjaya Gupta has played a key role in transformation of PNB Housing’s
business model and improvement in the performance over the past five years.
— The top management team has strong domain knowledge and experience of over 25 years in the mortgage
business with leading private sector financial services companies. Experienced professionals from the
industry have been inducted to lead separate business verticals. About 65% of the employees are post-
graduates or have professional qualifications.
— PNB Housing’s focus is on building capacity, improving efficiency, and fostering a performance-driven
culture across the organisation.
16ProductandProcessoverview
ProductOverview
— PNB Housing provides retail housing loans for construction, purchase, repair, and upgrade of houses. It also
provides loans against property (LAP), loans for commercial property and loans for purchase of residential
plots. On the wholesale front, the company provides, construction finance to builders/developers and lease
rental discounting/corporate term loan to corporates.
Average Ticket Size Average LTV Residual Tenor
As on September 30, 2017
(Rs.Crore) (Percent) (Years)$
Home Loans 0.31 68 17
- Salaried 0.28 72 18
- Self-employed 0.40 63 15
Loan Against Property# 0.54 49 12
- Salaried 0.23 50 14
- Self-employed 0.71 48 11
Construction Finance 56.96 68 4
*
Corporate Term Loan 74.52 60 9
$
for fully disbursed cases
#
Loan against property includes Retail LRD and NRPL
*
Corporate Term Loan includes Wholesale LRD
Chart 14: Occupation-wise loan asset break-up as on September 30, 2017
Individual home loan salaried
8%
Housing loan;Self employed
12%
39% LAP #
3%
NRPL
18% Construction Finance
Corporate term loan*
20%
# *
LAP includes Retail LRD, Corporate Term Loan (CTL) includes wholesale LRD
17Ratings
Process Overview
Chart 15 - Incremental sourcing mix as on 30th September 2017
64% 36% Inhouse Channels
Third Party
Based on retail disbursements of fiscal 2017
— PNB Housing intends to significantly increase its focus on in-house channels for business – direct sales
team and branches/referrals continue to contribute more than 59% to the overall disbursement of fiscal
2017.
— PNB Housing also plans to focus on increased construction finance business through relationship
management with the real estate developers.
18Loan Underwriting and Risk Structure
— The entire loan appraisal and monitoring happens through the enterprise system solutions.
— Underwriting at hubs: To manage the increasing scale of business and for better control and standardised
processes, PNB Housing follows a hub-and-spoke model. It has fully equipped 21 hubs (Noida, Bengaluru
(3), Jaipur, Chandigarh, South Delhi, Chennai, Hyderabad, Dehradun, Lucknow, Kolkata, Kochi, Ahmedabad,
Pune (2), Indore, Coimbatore, Mumbai (2) and Surat ) to process the business of 73 branches across India.
Each hub has a team of underwriters and subject matter experts such as legal, technical, and fraud
containment unit to manage end-to-end credit processing for all branches within their vicinity.
Underwriters have authority limits as per their experience and vintage
— Technical services group: A group of civil engineers formulate policies and processes to evaluate projects
for home loans and conduct periodic review of the approved projects along with conducting valuation of
non-home loans also.
— Legal team: A team of internal legal experts for legal verification of all loan applications.
— Fraud control unit (FCU): A team of experts has been set up to identify frauds at the early stage of loan
processing. PNB Housing has empanelled FCU vendors for its branches. Each hub to have one FCU expert to
strengthen fraud control process.
Further, with the ongoing technological innovations in lending space, PNB Housing has introduced various
digital initiatives which will not only replace some of the physical processes in part/full but will also mitigate
the risk of fraud.
19Ratings
Collection Process
PNB Housing has created a robust collection mechanism as part of its BPR exercise. Some of the initiatives
are:
— Increased focus on replacing external agencies with in-house collection resources to have better control
and cost effectiveness
— New incentive scheme for recovery executives
— Periodical portfolio scrub through credit bureaus to counter early warning signals
— Development of mobile application framework for collection resources for better supervision
0 dpd
1-29 dpd
—Telecalling
30-89 dpd
— Telecalling
90-179 dpd
— Field visit — Soft dunning
— Letters letter — SARFAESI notice 180+ dpd
— Legal notice under section 13(2)
— SARFAESI notice
— Field visit — Banking of security under section
post dated cheques 13(4)
— Follow-up by
collection — Publication in news
— Physical
agency/in-house papers
possession
team — Field visit
— Letters to
Builder/Tenant/
Third party
property occupants
— Property valuation
— Initiate section 138
20Business process transformation and re-engineering (BPR) initiative
In 2011, PNB Housing has successfully implemented a comprehensive business process transformation and re-
engineering exercise ‘Kshitij’. The exercise was aimed at combing the solidity and stability of the traditional public
sector with nimble responsiveness and dynamism of the private sector. The transformation included revamping of
business processes, organisational restructuring, relook at policies, creating and implementing a strong and
scalable target operating model, upgradation of information technology, and changing service delivery model.
The BPR initiative has changed the face of PNB Housing and resulted in significant improvement in its competitive
position and scale of operations. The revamped business model has transformed the company into a
contemporary and customer-centric organisation. The BPR exercise is enabling the company to continue to
achieve higher-than-industry-average growth in its loan book. The BPR exercise has also resulted in significant
changes in functions such as credit underwriting and monitoring, back-office operations, and human resources.
Change in origination and sourcing strategy, target customer segment, and enhanced customer service
— Changes in product composition, customer profile, and ticket size
— Branches focused on origination, collection, and enhancing customer service, while relegating other
functions to centralised processing hubs
— Introduced in-house sales team to reach out to new customers along with tapping of quality direct sales
agents
— Besides the branch delivery model, channels of distribution such as customer service portal and toll free
call centres have been created to make services easily accessible
Credit underwriting, monitoring, and recovery
— Standardisation of policies and processes across the business origination and credit chain, and building
robust capacities to evaluate risks
— Creation of separate credit underwriting regional hubs to enhance quality of credit decisions and
productivity
— Induction of in-house legal, technical, and property valuation specialists from industry
— Appointment of senior fraud specialists and dedicated collection resources at branches
Repositioning of PNB Housing brand
— Re-launch of company website to enhance brand image, provide online and easy access to product
information, and source business
— Refurbishment of all offices to enhance efficiency and customer convenience
— Brand positioning designed around the theme 'Ghar Ki Baat' signifying the level of comfort experienced by
customers
— Launch of multimedia brand campaign in January 2016 with major spends on Television backed by balanced
mix of radio, digital, print and outdoor
— Improved brand visibility achieved through remodelling of logo and brand guidelines
21Ratings
— Change in organisation structure and strengthening of management team by inducting experienced
industry professionals to lead business verticals
— Implementation of enterprise system solution, which will cover all business activities, resulting in
automation of all processes, furthering business growth, and improved efficiency and quality
Human capital and people initiatives
— Defining and mapping roles, and aligning employee skill sets
— New performance management system with revised pay scales commensurate with industry standards
— Revamped rewards and recognition programme across functions
— Focus on building capability through training programmes to develop functional, behavioural, and
leadership competencies
Information Technology
— Technology innovation has been driven by Enterprise System Solution (ESS) and its seamless integration
with all the activities of the organization. The ESS has enabled business automation eradicating manual
efforts and improved operational efficiency across all functions leading to enhanced customer service
standards.
— The technology initiatives are designed to make the overall business framework more scalable, secure and
supporting sustainable business growth. The architecture of Enterprise System Solution, being agile,
secured, scalable & modular, has paved the way for various initiatives, realizing its vision to provide a
collaborative business environment among frontend team, customers and business partners, further
making the transactions and sharing of information easy and user friendly.
— The customer portal module provides customers with a single-window online view of their relationship
with the company and a self-service platform.
— Digital initiative for our business associates have redefined the ease of doing business with PNB Housing
and enabled them to render better customer service. Similarly tablet based digital collection initiative has
enabled improvement in productivity of recovery agent by complete automation of recovery process.
— The robust, agile, modular and yet simple IT infrastructure ensures that information is secured throughout
the lifecycle of a customer relationship. Through its data centres, the company ensure data security,
integrity, scalability and business continuity.
22PNB Housing in Comparison with other HFCs
Chart 16: Trend in AUM growth rate Chart 17: Trend in gross NPAs (2 year lagged)
1.4
70% 63%
60% 59% 1.2
1.2 1.2 1.1
60% 67%
51% 1.0
1.0 1.0
50%
1.1
Per cent
Per cent
40% 0.8 0.9
30% 0.6
0.6
20% 24%
23% 0.4 0.5 0.5
21% 20%
10% 20%
0.2
0%
2013 2014 2015 2016 2017 0.0
-10% 2013 2014 2015 2016 2017
As on March 31
For the year ended March 31,
PNBHFL HFCs
PNBHFL HFC
Chart 18: Trend in cost of borrowing Chart 19: Trend in adjusted gearing
9.9 13.0 12.4
10.0 9.7
12.0
9.8
9.5
11.0
9.1 11.1 11.0
9.3 9.3 10.0 10.9
Per cent
9.0
8.7
Times
9.0
8.5 8.7 8.0 7.4 7.5 8.6
8.6
8.6 8.1 8.1
7.0
8.0 6.9
6.0
7.5 5.0
2013 2014 2015 2016 2017 2013 2014 2015 2016 2017
For the year ended March 31, For the year ended March 31,
PNBHFL HFCs
PNBHFL HFCs
Chart 20: Trend in NIMs Chart 21: Trend in return on assets
4.0
3.4 3.5 2.6
3.2 3.2 3.3
3.5 2.4
2.2 2.2
3.0 2.1
2.2 2.0
3.0 3.0
Per cent
2.9 2.9 2.9
Per cent
2.5 2.0 1.9
2.0 1.8
1.5 1.6
1.4 1.5
1.0
1.4
1.2 1.3 1.3 1.3
0.5
1.0
0.0 2013 2014 2015 2016 2017
2013 2014 2015 2016 2017 For the year ended March 31,
For the year ended March 31,
PNBHFL HFCs PNBHFL HFCs
Note: HFC industry data based on CRISIL estimates
23Ratings
Key Financials
As at / For the Year ended March 31 2017 2016 2015 2014 2013
Total Loan Disbursements Rs.crore 20639 14456 9440 5500 3682
Assets Under Management Rs.crore 41492 27555 17297 10591 6620
Equity Capital Rs.crore 166 127 104 66 50
Reported Networth Rs.crore 5577 2146 1581 935 621
Adjusted Networth* Rs.crore 5577 2146 1581 935 621
Total Adjusted Borrowing (including Securitisation) Rs.crore 38618 26537 17272 10289 6902
Total Assets Rs.crore 42960 29671 19033 11685 7833
Funds Deployed Rs.crore 41854 28961 18597 11311 7563
Interest Income Rs.crore 3640 2546 1671 1056 634
Total Income Rs.crore 3908 2696 1777 1116 661
Interest Expense Rs.crore 2644 1860 1265 801 462
Operating Expenses Rs.crore 357 252 178 109 61
Credit Costs Rs.crore 103 83 38 30 12
Profit After Tax Rs.crore 524 326 196 127 92
Ratios
Interest income/ Average funds deployed % 10.28 10.70 11.17 11.19 10.67
Interest expense/Average borrowings % 8.60 8.70 9.34 9.32 8.64
Cost to income % 28.24 29.66 34.75 34.50 30.53
PAT/ Average total Assets % 1.44 1.34 1.28 1.30 1.48
PAT/ Average adjusted net worth % 13.57 17.49 15.59 16.33 15.75
Gross NPA % 0.22 0.22 0.20 0.32 0.56
Gross NPA ( 2 year lagged) % 0.51 0.56 0.52 0.85 1.17
NNPA % 0.15 0.14 0.07 0.20 0.35
Capital adequacy % 21.62 12.70 13.76 13.40 14.40
Total adjusted gearing (including securitisation) Times 6.92 12.37 10.92 11.01 11.12
*Adjusted for compulsory convertible debentures of Rs.137 crore
#Cost to income ratio is calculated as: operating expense/ (Total Income-Interest Expense)*100
24Key Financials
As on / For the half year ended September 30 Sept 2017 Sept 2016
Total Loan Disbursements Rs.crore 15179 10175
Assets Under Management Rs.crore 51320 34896
Equity Capital Rs.crore 167 127
Reported Net Worth Rs.crore 5880 2379
Total Adjusted Borrowing (including Securitization) Rs.crore 47643 34139
Total Assets Rs.crore 53740 35435
Interest Income Rs.crore 2319 1730
Total Income Rs.crore 2508 1833
Interest Expense Rs.crore 1589 1293
Total Income (net of interest expenses) Rs.crore 919 540
Operating Expenses Rs.crore 218 181
Provisioning Costs Rs.crore 98 5
Profit After Tax Rs.crore 393 234
Ratios
PAT/Average Total Assets % 1.63 1.44
PAT/Average Adjusted Net Worth % 13.72 20.69
Gross NPAs % 0.34 0.26
Net NPAs % 0.26 0.18
Overall Capital Adequacy Ratio % 18.38 13.16
Reported Gearing Times 7.67 13.23
Adjusted Gearing (including Securitisation) Times 8.10 14.35
2526
Ratings
Detailed organisation structureNotes
Ratings

          Notes
Disclaimer: This report (Report) is prepared by CRISIL Limited (CRISIL) at the request of Srinivasa Fashions Pvt Ltd (Client). This report may include or refer to information and materials provided by the Client and/or obtained by CRISIL from sources that CRISIL considers reliable (together, “Materials”). In preparing this Report, CRISIL does not independently validate any such Materials and assumes those Materials are accurate. CRISIL does not guarantee the accuracy, adequacy or completeness of any Material contained in or referred to in the Report. While CRISIL takes reasonable care in preparing the Report, CRISIL shall not be responsible for any errors or omissions in or for the results obtained from the use of or the decisions made based on, the Report. The Report is not audit, rating, verification, investigation, certification, fraud detection exercise or a forensic analysis of the Client or the entity to which such Report pertains. The Report is neither solicitation of any kind nor an investment advice or an offer to invest or divest from any securities, instruments, facilities or otherwise enter into any deal or transaction with the entity to which the Report pertains. The Report should not be the basis for any investment decision within the meaning of any applicable laws or regulations. The user of the Report should rely on their own judgment and take their own professional advice before acting on the Report in any way. The user takes full responsibility for the use of and the decisions made based on the Report. While portions of Materials are included in the Report, CRISIL makes all reasonable attempts to attribute credits to the source of the Materials; however, even if a particular source of a Material is not so attributed, CRISIL stakes no claim to any such Material in the form as provided to or made accessible to CRISIL. No third party whose Material is included or referenced in this Report under credit to it, assumes any liability towards the user with respect to such Material. Neither CRISIL nor its directors, employees and representatives accept any liability with regard to any access, use of or reliance on, the report and that CRISIL expressly disclaim all such liability. Any third-party brands, names or trademarks contained in the report belong to the relevant third parties. The report contains CRISIL’s view as at the date of the report based on available Material. CRISIL does not assume an obligation to update the report where updated materials are available or to notify anyone that an updated report is available. This Report may not be reproduced or redistributed or communicated directly or indirectly in any form or published or copied in whole or in part except as authorized by CRISIL. Unless CRISIL has expressly agreed in writing, this report is not intended for use outside India. By accessing and/or using any part of the report, the user accepts the foregoing disclaimers and exclusion of liability.
About CRISIL Limited
CRISIL is an agile and innovative, global analytics company driven by its mission of making markets function
better. We are India’s foremost provider of ratings, data, research, analytics and solutions. A strong track record of
growth, culture of innovation and global footprint sets us apart. We have delivered independent opinions,
actionable insights, and efficient solutions to over 100,000 customers.
We are majority owned by S&P Global Inc., a leading provider of transparent and independent ratings,
benchmarks, analytics and data to the capital and commodity markets worldwide.

About CRISIL Ratings
CRISIL Ratings is part of CRISIL Limited (“CRISIL”). We pioneered the concept of credit rating in India in 1987.
CRISIL is registered in India as a credit rating agency with the Securities and Exchange Board of India (“SEBI”).
With a tradition of independence, analytical rigour and innovation, CRISIL sets the standards in the credit rating
business. We rate the entire range of debt instruments, such as, bank loans, certificates of deposit, commercial
paper, non-convertible / convertible / partially convertible bonds and debentures, perpetual bonds, bank hybrid
capital instruments, asset-backed and mortgage-backed securities, partial guarantees and other structured
debt instruments. We have rated over 24,500 large and mid-scale corporates and financial institutions. CRISIL has
also instituted several innovations in India in the rating business, including rating municipal bonds, partially
guaranteed instruments and microfinance institutions. We also pioneered a globally unique rating service for
Micro, Small and Medium Enterprises (MSMEs) and significantly extended the accessibility to rating services to a
wider market. Over 1,10,000 MSMEs have been rated by us.

CRISIL Privacy Notice
CRISIL respects your privacy. We use your contact information, such as your name, address, and email id, to fulfil your request
and service your account and to provide you with additional information from CRISIL and other parts of S&P Global Inc. and its
subsidiaries (collectively, the “Company) you may find of interest.

For further information, or to let us know your preferences with respect to receiving marketing materials, please visit
www.crisil.com/privacy. You can view the Company’s Customer Privacy at https://www.spglobal.com/privacy

Last updated: April 2016

Argentina   |   China    |   Hong Kong   |    India   |   Poland   |   Singapore     |   UK   |   USA

CRISIL Limited: CRISIL House, Central Avenue, Hiranandani Business Park, Powai, Mumbai – 400076. India
Phone: + 91 22 3342 3000 | Fax: + 91 22 3342 3001 | www.crisil.com
  /company/crisil       @CRISILLimited       /CRISILLimited    /user/CRISILLimited
You can also read