2021 Mid-Year Residential Real Estate Update for Elmore County
←
→
Page content transcription
If your browser does not render page correctly, please read the page content below
2021 Mid-Year Residential
                         Real Estate Update
                         for Elmore County
                                             Presented by Breanna Vanstrom, MBA, RCE, CAE
                                            Boise Regional REALTORS® Chief Executive Officer

                                Released July 19, 2021, as part of the Elmore County Housing Summit

Copyright © 2021 Boise Regional REALTORS®
Elmore County home prices are being driven by…

Persistent and historically low inventory
of existing homes compared to demand,
  exaggerated by a lack of consistent
        new construction supply.

Copyright © 2021 Boise Regional REALTORS®
Elmore County Housing Summit — July 19, 2021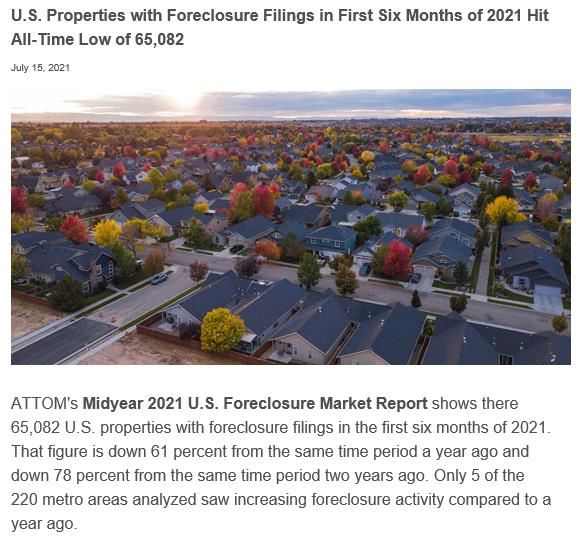
New Housing Units Completed in the U.S., 1968-2020
The data are for new housing units within a variety of property types, including single-family homes, condos, townhomes, apartments, and multi-family buildings, but excluding manufactured homes. The red line shows the
historical average over this time period, nearly 1.4 million completions per year. Between 1996-2007, 2.8 million more units were built than would have been expected based on the historical average. While the drop off in
activity allowed the market to absorb the oversupply, since 2008, 5.5 million fewer units were built than would have been expected per the historical average, and because the construction industry was unable to rebound
quickly, the country has been significantly below historical levels for more than a decade, all while the population continued to increase.
2,105,250 Units Built (1973)
2,100,000
Baby Boomers began “aging into” homeownership around 1966, and the 1,989,000 Units Built (2006)
HUD Act of 1968 funded the construction of 1.7M units and expanded
access to credit through the creation of Ginnie Mae Regulatory changes to housing policy and
lending standards throughout the 1990s
1,900,000 expanded access to credit, increasing demand,
just before Millennials began “aging into”
homeownership around 2000. Demand
further accelerated after 9/11.
1,700,000
1,500,000
1,300,000
1,100,000
900,000
700,000
500,000
1982
2001
2020
1968
1969
1970
1971
1972
1973
1974
1975
1976
1977
1978
1979
1980
1981
1983
1984
1985
1986
1987
1988
1989
1990
1991
1992
1993
1994
1995
1996
1997
1998
1999
2000
2002
2003
2004
2005
2006
2007
2008
2009
2010
2011
2012
2013
2014
2015
2016
2017
2018
2019
Copyright © 2021 Boise Regional REALTORS®
Source: U.S. Census Bureau and U.S. Department of Housing and Urban Development, retrieved from FRED.
Elmore County Housing Summit — July 19, 2021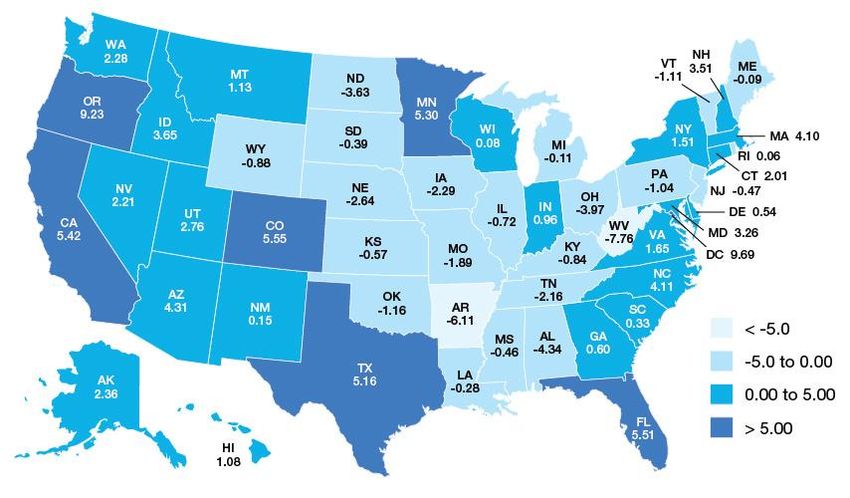
Total U.S. Population by Age and Generation as of 2020

                         Youngest Potential           Average FTHB
                        Homebuyers (18 Years         was 48 Years Old
                         Old; born in 2002)           (born in 1972)

      Copyright © 2021 Boise Regional REALTORS®
                                                                        Sources: Knoema per the U.S. Census Bureau and the National Association of REALTORS®.
      Elmore County Housing Summit — July 19, 2021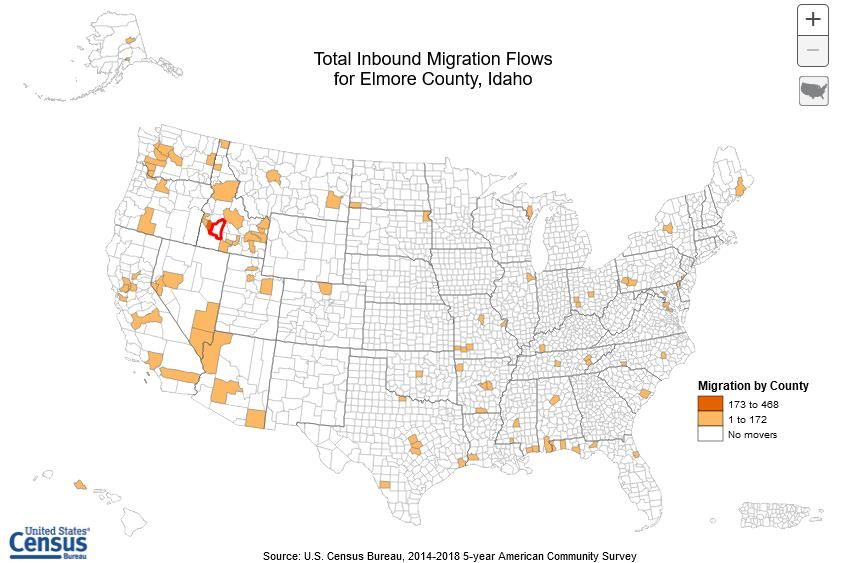
Majority of States Faced Housing Deficits, December 2020
Housing units refer to individual single-family homes, apartments, and manufactured homes available for purchase or rent. States shaded dark blue had the largest deficits as of 2020, primarily on the coasts and adjacent
states. Those shaded light blue have an oversupply of housing units, based on population, vacancy rates, interstate migration patterns, and existing housing stock. Freddie Mac estimated 29 states had housing deficits in
2020, most notably in OR, CA, CO, TX, MN, and FL, putting added pressure on adjacent states. They estimated the U.S. needs up to 3.3 million more units to accommodate household formations, to replace older existing
units, meet any second home demand, and to maintain some level of year-round vacancy. The U.S. Department of Housing and Urban Development (HUD) found similar numbers, estimating 2.7 million units are needed.

                   Copyright © 2021 Boise Regional REALTORS®
                                                                                                                                    Sources: Freddie Mac and the U.S. Department of Housing and Urban Development’s Office of Policy Development and Research.
                   Elmore County Housing Summit — July 19, 2021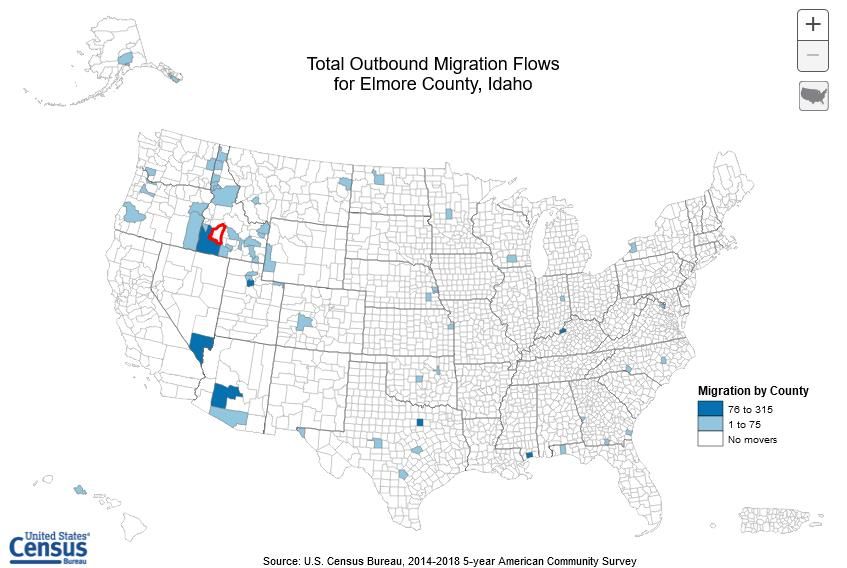
Change in Households and Housing Units, 2011–2019
Per U.S. Census Bureau definitions, a “household” refers to an occupied housing unit, and a “housing unit” includes houses, apartments, or a single room intended to be separate living quarters. While housing units were
being added throughout this time period, construction remained historically low. However, household formation grew faster than new units, causing the vacancy rate for to drop, further exacerbating the housing deficit.

                                                                                                                                                                       % Chg in Households             % Chg in Housing Units
                                                                                                13.0%

                                                                                                                          11.3%                                          11.3%

                       7.2%

                                                  5.5%

                                                                                                                                                                                                        3.4%

                                      U.S.                                                                    Idaho                                                               Elmore County

                   Copyright © 2021 Boise Regional REALTORS®
                                                                                                                                                                           Sources: Federal Reserve Bank of St. Louis and U.S. Census Bureau.
                   Elmore County Housing Summit — July 19, 2021
Changes in Vacancy Rates, Monthly Mortgage and Rent Payments
and Household Income for Elmore County, 2010–2019
As households formed rose faster than the rate of new construction, vacancy rates dropped during this time, especially for rentals — down 72.2% between 2010 and 2019. While the median household income rose for both
owner- and renter-occupied households, 6.6% and 11.2% respectively, the increase in monthly rent payments far outpaced the gains in income, while falling mortgage rates resulted in a decrease in mortgage payments.

 Vacancy Rate                                                                  Median Monthly Payment                                                  Median Household Income

 18.0                                                                          $1,000                                                                   $70,000

 16.0                                                                           $900
                                                                                                                                            $833        $60,000
                                                                                $800                                                        $799
 14.0

                                                                                $700                                                                    $50,000
 12.0

                                                                                $600
                                                                                                                                                        $40,000
 10.0
                                                                                $500              Rents increased 26.6% during this
  8.0                                                                                               time, while median mortgage                         $30,000
                                                                                $400
                                                                                                   payments decreased by 12.8%,
  6.0                                                                                               due to mortgage rates, which
                                                                                $300                                                                    $20,000
                                                                                                   eventually made owning more
  4.0
                                                                                $200                   affordable than renting.                                                            Renter-Occupied Households
                                                                                                                                                        $10,000
  2.0                                                                           $100
                                                                                                                                                                                           Owner-Occupied Households

  0.0                                                                             $-                                                                        $-
        2010   2011    2012   2013   2014   2015   2016   2017   2018   2019            2010 2011 2012 2013 2014 2015 2016 2017 2018 2019                         2010 2011 2012 2013 2014 2015 2016 2017 2018 2019

                           Renter-Occupied Households                                              Renter-Occupied Households
                           Owner-Occupied Households                                               Owner-Occupied Households

                      Copyright © 2021 Boise Regional REALTORS®
                                                                                                                                                                     Sources: Federal Reserve Bank of St. Louis and U.S. Census Bureau.
                      Elmore County Housing Summit — July 19, 2021
Lack of Housing Types Restricts Units and Density and Increases Prices
Elmore County’s housing stock is primarily single-unit properties, at 75.6%, another 13.8% being structures with 2 or more units (including condos, townhomes, apartments, and other multi-family property types) and the
remaining 10.6% comprised of manufactured/mobile homes. Multi-unit structures, in particular, allow for greater density on a parcel, while also generally being more affordable as the land and other construction costs can be
spread across the entire project. In comparison, Ada County’s housing stock is approximately 78% single-family homes, 18% multi-unit structures, and less than 4% are manufactured homes.

                                                                    Share of Housing
                                                                      Stock, 1-Unit
                                                                         75.6%
                                                                                                                                                              Share of Housing
                                                                                                                                                               Stock, 2+ Units
                                                                                                                                                                   13.8%

                                                                                                                                                            Share of
                                                                                                                                                          Housing Stock,
                                                                                                                                                          Manufactured
                                                                                                                                                             10.6%
                   Copyright © 2021 Boise Regional REALTORS®
                                                                                                                                                                                                            Source: U.S. Census Bureau.
                   Elmore County Housing Summit — July 19, 2021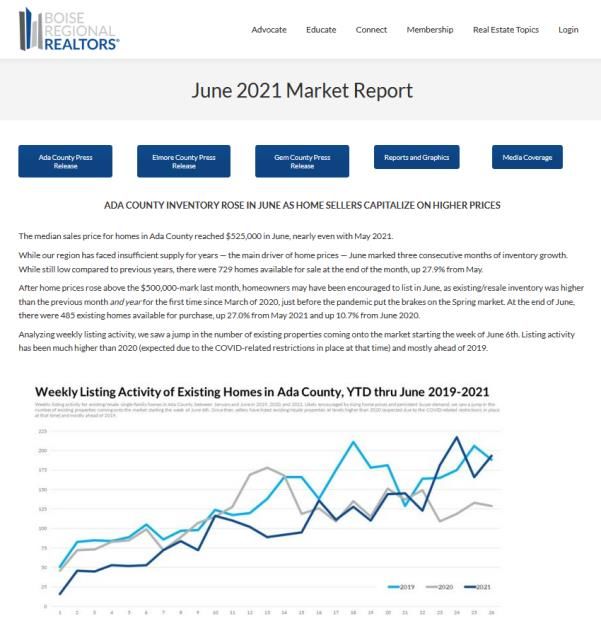
Some Factors Limiting                                                     Some Factors Driving Demand
Existing Housing Supply                                                   for Housing
•   Underbuilding and construction delays adding pressure to existing     •   Millennials “aging into” homeownership and driving the growth in
    homes because they’re... built.                                           household formation.

•   More people “aging in place” possibly exacerbated by COVID-19         •   Growth in the economy pre-COVID provided more employment
    concerns at senior facilities.                                            opportunities, and a quick decline in post-COVID unemployment
                                                                              claims, back to 2019 levels in the Boise MSA.
•   Concerns of COVID-19 kept some homeowners from listing or
    allowing in-person showings.                                          •   The “Great Resignation” has led to more early retirements, while
                                                                              the “Great Migration” continues to be fueled by people who can
•   Investors picked up SFHs during the Great Recession still                 WFH, allowing both groups to move... anywhere.
    holding many as rentals — although by absorbing the excess and
    distressed supply, it did help stop prices from continuing to fall.   •   Easier to get to Boise with more flights than ever, including
                                                                              eight added since 2020, including Atlanta, Palm Springs, Nashville,
•   Surge in refis have made current mortgage payments more                   Orange County, Austin, Pullman/Moscow, Everett, and NYC.
    affordable.
                                                                          •   Historically high levels of equity and savings coupled with
•   Despite historically high equity and low mortgage rates, some             historically low mortgage rates.
    homeowners feel they cannot “trade up” due to increased prices.
                                                                          •   Fear of missing out on purchasing a home in one of the “hottest”
•   Homeowners delay listing until they find their next home, which           housing markets in the country.
    takes longer due to limited inventory.

           Copyright © 2021 Boise Regional REALTORS®
           Elmore County Housing Summit — July 19, 2021
Months Supply of Inventory for Elmore County, January 2007—June 2021
Activity for existing and new single-family homes combined between Jan 2007–Jun 2021. Months Supply of Inventory (MSI) takes the number of homes for sale divided by the average number of sales by month for the
preceding twelve months. A balanced market—not favoring buyers or sellers—is typically between 4-6 months of supply. As of June 2021, MSI for Ada County was at just 0.9 months, meaning, if no additional homes were
listed starting July 1st, the supply of homes for sale would run out in less than one month. Thankfully, the number of new listings has been increasing in recent weeks.

22.0

20.0

18.0

16.0

14.0

12.0

10.0

 8.0

 6.0
                                                  Balanced Market
 4.0

 2.0
                                                                                                                                                                                                                             0.9
 0.0

            Nov
            Nov

            Nov

            Nov

            Nov

            Nov
       Jan 2012

            Nov

            Nov

            Nov

            Nov

            Nov

            Nov

            Nov

            Nov
       Jan 2007

            May

       Jan 2008

            May

       Jan 2009

            May

       Jan 2010

            May

       Jan 2011

            May

            May

       Jan 2013

            May

       Jan 2021
       Jan 2014

            May

       Jan 2015

            May

       Jan 2016

            May

       Jan 2017

            May
            Mar

       Jan 2018

            May

       Jan 2019

            May
            July

       Jan 2020

            May
            July

            May
            Mar

             Jul

            Mar

             Jul

            Mar

             Jul

            Mar

             Jul

            Mar

             Jul

            Mar

             Jul

            Mar

             Jul

            Mar

             Jul

            Mar

             Jul

            Mar

             Jul

             Jul

            Mar

             Jul

            Mar

            Mar

            Mar
            Sep
            Sep

            Sep

            Sep

            Sep

            Sep

            Sep

            Sep

            Sep

            Sep

            Sep

            Sep

            Sep

            Sep
                  Copyright © 2021 Boise Regional REALTORS®
                                                                                                                                                                                      Source: Intermountain MLS as of July 8, 2021.
                  Elmore County Housing Summit — July 19, 2021
Average Market Times for Existing Homes in Elmore County, YTD thru June
Activity for existing/resale single-family homes between Jan-Jun in the years noted. The “Active to Pending” columns represent the Days on Market (DOM) metric, which is the average number of days a home has been listed
in an active status in IMLS. While DOM has been trending down, the time it takes to close a transaction (“Pending to Closed”) has remained at 38 days, on average, since 2011. During this phase of the transaction, the
REALTORS®, lenders, escrow officers, etc., are working through any inspections, repairs, appraisals, and title work to facilitate the transfer of property between the buyer and seller. With DOM falling below the 30-day mark
in 2020, it means that homes are selling faster than they can be counted in month-end inventory data. This is adding to the perception of “no” inventory, when really, homes are just going under contract faster than ever.
0 10 20 30 Days
30 40 50 60 70 80 90 100 110 120 130 140 150 160 170
2011 131 37
2012 131 37
2013 119 46
2014 107 42
2015 90 39
2016 95 42
2017 72 43
2018 43 38
2019 30 37 Active to Pending (Avg Days)
aka Days on Market (DOM)
2020 21 36
Pending to Closed (Avg Days)
2021 14 34
Copyright © 2021 Boise Regional REALTORS®
Source: Intermountain MLS as of July 8, 2021.
Elmore County Housing Summit — July 19, 2021Percent of Original List Price Received by Price Range
for Existing Homes in Elmore County, YTD through June
Activity for existing/resale single-family homes that closed between January–June in 2020 and 2021. Over the past few months, buyers began competing on price as the percent paid over the original list price was up
compared to last year. Since April, buyers have paid 100% or more, on average. Lower mortgage rates are allowing some buyers to make these over-asking offers due to their increased purchase power. Watch this metric for
any changes to buyers’ willingness or ability to continue competing on price.
Average of % OLP Average of $ OLP
Price Range
YTD 2020 YTD 2021 YTD 2020 YTD 2021
$250,000 or less 98.2% 101.3% ($3,154) $2,527
$250,000-499,999 96.7% 101.5% ($12,720) $3,111
$500,000-749,999 -- 99.6% -- ($2,690)
All Price Ranges Combined 97.8% 101.4% ($5,398) $2,681
Copyright © 2021 Boise Regional REALTORS®
Source: Intermountain MLS as of July 8, 2021.
Elmore County Housing Summit — July 19, 2021Market Metrics to Watch…
• Days on Market
• Weekly Listing Activity
• Average List Price
• Percent of Original List Price Received
• Price Changes and Listings in “Back on
Market” Status
• Mortgage Rates and Purchase
Applications
Copyright © 2021 Boise Regional REALTORS®
Elmore County Housing Summit — July 19, 2021Monthly Average List Price and Percent of Original List Price Received
for Existing Homes in Elmore County, Jan 2019–Jun 2021
Activity for existing/resale single-family homes that closed between January 2019–June 2021. The lack of housing compared to demand continues to drive home prices up, which in turn, increases the average list price for
new listings. Over the past few months, buyers were willing to pay those higher list prices and more, as the percent paid over the original list price has also been rising. Since April, buyers have paid 100% or more, on average.
Lower mortgage rates are allowing some buyers to make these over-asking offers due to their increased purchase power. Watch this metric for any changes to buyers’ willingness or ability to continue competing on price.
$350,000 102.0%
101.0%
$300,000
100.0%
$250,000
99.0%
98.0%
$200,000
97.0%
$150,000
96.0%
$100,000 95.0%
Jan Feb Mar Apr May June July Aug Sep Oct Nov Dec Jan Feb Mar Apr May June July Aug Sep Oct Nov Dec Jan Feb Mar Apr May Jun
2019 2020 2021
Average List Price % of Original List Price Received
Copyright © 2021 Boise Regional REALTORS®
Source: Intermountain MLS as of July 8, 2021.
Elmore County Housing Summit — July 19, 2021Weekly Listing Activity of Existing Homes in Elmore County, YTD thru June
Weekly listing activity for existing/resale single-family homes in Elmore County, between January and June in 2019, 2020, and 2021. Listing activity has not returned to levels seen in previous years, with 192 and 154 homes
added through June, in 2019 and 2020, respectively. So far in 2021, only 139 homes have been listed for sale, 9.6% lower than last year, and 27.6% lower than 2019. The small numbers can make this chart a bit “noisy.”
18 2019 2020 2021
16
14
12
10
8
6
4
2
0
1 2 3 4 5 6 7 8 9 10 11 12 13 14 15 16 17 18 19 20 21 22 23 24 25 26
Week Number
Copyright © 2021 Boise Regional REALTORS®
Source: Intermountain MLS as of July 8, 2021.
Elmore County Housing Summit — July 19, 2021Weekly “Back on Market” and “Price Change” Activity for Existing Homes
in Ada, Canyon, Elmore, and Gem Counties Combined, YTD 2021 thru June
Another metric to watch is the number of active listings in the “Back on Market” or “Price Change” status in IMLS each week. Price changes reflect adjustments sellers made, where “Back on Market” status indicates an offer
was accepted, but for whatever reason fell through and the home was re-listed. While this activity has been quite limited, it has been up slightly over the past few weeks.
11
9 9
8
7
5
4 4 4 4
3 3 3 3
2 2 2 2 2 2
1 1 1 1
5/30/2021
1/10/2021
1/17/2021
1/24/2021
1/31/2021
2/14/2021
2/21/2021
2/28/2021
3/14/2021
3/21/2021
3/28/2021
4/11/2021
4/18/2021
4/25/2021
5/16/2021
5/23/2021
6/13/2021
6/20/2021
6/27/2021
1/3/2021
2/7/2021
3/7/2021
4/4/2021
5/2/2021
5/9/2021
6/6/2021
Week Ending
Copyright © 2021 Boise Regional REALTORS®
Source: Intermountain MLS as of July 8, 2021.
Elmore County Housing Summit — July 19, 2021Mortgages Rates and Insights Copyright © 2021 Boise Regional REALTORS® Elmore County Housing Summit — July 19, 2021
Historical Annual 30-Year Fixed Mortgage Rates for the U.S., 1971-2021
The rate shown for 2021 is as of June. Since today’s rates are often compared to those from the 1980s, annual data since 1971 has been included for reference, but past rates have no meaningful impact on today’s buyers.
What has had an impact is the increased purchase power today compared to the previous market peak in June 2006 — down 55% since then, and down 5.7% since June 2020 — helping some homebuyers purchase despite
rising prices, especially for those rolling equity from a recent home sale into their next purchase.
18%
16%
14%
12%
10%
Jun 2006
8%
6.68%
6%
4%
2% Jun 2021
2.98%
0%
1971
1972
1973
1974
1975
1976
1977
1978
1979
1980
1981
1982
1983
1984
1985
1986
1987
1988
1989
1990
1991
1992
1993
1994
1995
1996
1997
1998
1999
2000
2001
2002
2003
2004
2005
2006
2007
2008
2009
2010
2011
2012
2013
2014
2015
2016
2017
2018
2019
2020
Jun 2021
Copyright © 2021 Boise Regional REALTORS® Sources: Freddie Mac, 30-Year Fixed Rate Mortgage Average, retrieved from FRED, Federal Reserve Bank of St. Louis, July 8, 2021.
Elmore County Housing Summit — July 19, 2021Elmore County Prices Rising Faster than Rates Can Offset Monthly Payments
Activity for existing and new construction single-family homes combined, YTD thru June for the years noted. Despite lower rates, the recent increase in sales prices has increased monthly mortgage payments by $198,
on average, compared to 2020 when it was $75 less than in 2019. Estimated monthly mortgage payment is based on the median sales price and mortgage rate noted, assumes a 20% down payment, and represents
principal and interest payments only. A mortgagee’s actual payment will depend on credit, mortgage rate received, down payment, purchase price, etc.
3.16%
$300,000
$1,031
$215,500 $833
2.98%
YTD 2020 YTD 2021 YTD 2020 YTD 2021 YTD 2020 YTD 2021
Median Sales Price (+39.2%) 30-Yr Fixed Mortgage Rate (-5.69%) Est. Monthly Payment (+23.7%)
Elmore County National Average Principal & Interest Only
Copyright © 2021 Boise Regional REALTORS® Sources: Federal Reserve Bank of St. Louis and Intermountain MLS as of July 8, 2021.
Elmore County Housing Summit — July 19, 2021“States that saw the greatest decline in foreclosure
starts from the same time last year included… Idaho
(down 78 percent)” reflects 113 filings statewide.
Copyright © 2021 Boise Regional REALTORS®
Elmore County Housing Summit — July 19, 2021Share of Closed Sales that were Distressed in Elmore County, 2008–2021 YTD
2021
60% figures based on six months of activity (Jan-Jun) while all others are full years. Distressed properties are those listed in IMLS as “HUD Owned,” “In Foreclosure,” “REO/Bank Owned,” or “Potential Short Sale.” Distressed
activity peaked in 2011 with 117 distressed sales and has been dropping ever since. Halfway through 2021, there have been no distressed sales, and as of July 18, 2021, there was just one active distressed listings in IMLS.
50% 48.1%
45.7%
41.9%
40% 38.4%
34.2%
30%
26.0%
20%
17.4% 16.8%
10% 8.1%
3.4%
1.5% 1.0%
0.3% 0.0%
0%
2008 2009 2010 2011 2012 2013 2014 2015 2016 2017 2018 2019 2020 2021 YTD
Copyright © 2021 Boise Regional REALTORS® Source: Intermountain MLS as of July 8, 2021.
Elmore County Housing Summit — July 19, 2021Share of Closed Sales by Financing or Cash in Elmore County, 2008–2021 YTD
2021 figures based on six months of activity (Jan-Jun) while all others are full years. Analysis based on the “How Sold” field in IMLS, with financing comprised of those marked as “Conventional,” “FHA,” or “VA.” While most
home sold with a mortgage, the share of cash sales has held at a consistent level over the past few years.
87.2% 87.6% 88.9% 88.4%
12.8% 12.4% 11.1% 11.6%
2018 2019 2020 2021 YTD
Share of Sales - Financing Share of Sales - Cash
Copyright © 2021 Boise Regional REALTORS® Source: Intermountain MLS as of July 8, 2021.
Elmore County Housing Summit — July 19, 2021Average Gain in Homeowner Equity, Year-Over-Year through Q1-2021
For the second year, Idaho had the highest year-over-year average increase of any state, at $70,900, compared to $24,400 through Q1-2020.
Copyright © 2021 Boise Regional REALTORS® Sources: CoreLogic and Twitter.
Elmore County Housing Summit — July 19, 2021Total Inbound Migration Flows for Elmore County, 2014-2018
During this period, 77.3% of residents did not move. For those that did, 47.5% moved within Elmore County, 31.0% moved from another state, 13.7%
moved from another county in Idaho, and the remaining 7.8% moved from abroad. Based on data from April 2021, the average list price for the counties
noted was 13.4% higher than Elmore County’s, demonstrating our comparative affordability which continues to drive in-migration from higher priced areas.
Top 10 U.S. Counties
from which new residents
moved into Elmore County:
1. Ada County, ID
2. Wayne County, NC
3. Cochise County, AZ
4. Anchorage County, AK
5. Sacramento County, CA
6. Okaloosa County, FL
7. Dimmit County, TX
8. Bingham County, ID
9. Knox County, TN
10. Twin Falls County, ID
Copyright © 2021 Boise Regional REALTORS® NOTE: The net migration increased the population by 3.5% between 2017 and 2018 which results in different percentages compared
Elmore County Housing Summit — July 19, 2021 to the outbound numbers also included in this report. Source: U.S. Census Bureau 2014-2018 5-year American Community Survey.Median List Prices as of April 2021 Median List Price % Difference from Elmore County
Elmore County, ID $305,000 --
Where new residents moved from…
Ada County, ID $548,495 179.8%
Wayne County, NC $204,900 67.2%
Cochise County, AZ $270,000 88.5%
Anchorage County, AK $350,000 114.8%
Sacramento County, CA $492,450 161.5%
Okaloosa County, FL $329,000 107.9%
Dimmit County, TX $166,800 54.7%
Bingham County, ID $299,900 98.3%
Knox County, TN $372,400 122.1%
Twin Falls County, ID $423,573 138.9%
Copyright © 2021 Boise Regional REALTORS®
Sources: realtor.com, based on select counties from the U.S. Census Bureau 2014-2018 5-year American Community Survey.
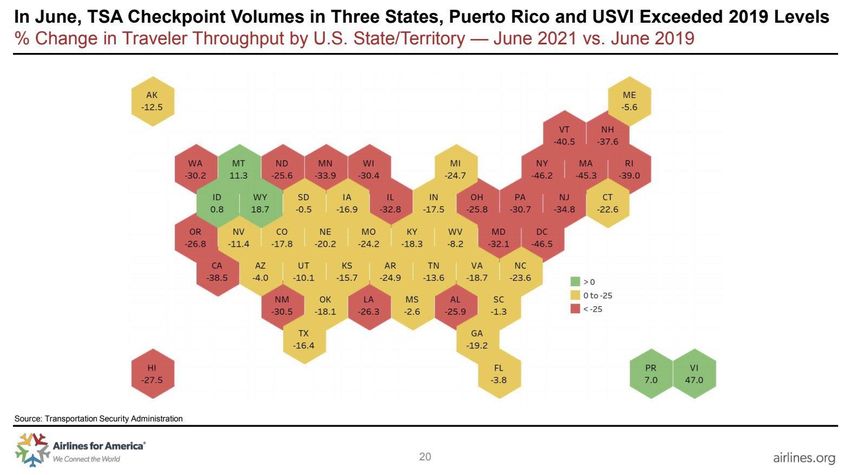
Elmore County Housing Summit — July 19, 2021Copyright © 2021 Boise Regional REALTORS® Sources: Airlines for America and Twitter. Elmore County Housing Summit — July 19, 2021
Total Outbound Migration Flows for Elmore County, 2014-2018
                                                     During this period, 80.0% of residents did not move. For those that did, 55.8% moved within Elmore County, 29.2% moved to
                                                another state, and the other 15.0% moved to another county in Idaho. Based on data from April 2021, the average list price for the
                                               counties noted was 32.6% higher than Elmore County’s, although we know much of the relocation is related to military assignments.

                                                                                                                                Top 10 U.S. Counties to which
                                                                                                                                Elmore County residents moved:

                                                                                                                                1.      Ada County, ID
                                                                                                                                2.      Jefferson County, KY
                                                                                                                                3.      Harrison County, MS
                                                                                                                                4.      Salt Lake County, UT
                                                                                                                                5.      Tarrant County, TX
                                                                                                                                6.      Owyhee County, ID
                                                                                                                                7.      Maricopa County, AZ
                                                                                                                                8.      Clark County, NV
                                                                                                                                9.      Bingham County, ID
                                                                                                                                10.     Davis County, UT

Copyright © 2021 Boise Regional REALTORS®                                    NOTE: The net migration increased the population by 3.5% between 2017 and 2018 which results in different percentages compared
Elmore County Housing Summit — July 19, 2021                                  to the outbound numbers also included in this report. Source: U.S. Census Bureau 2014-2018 5-year American Community Survey.
Median List Prices as of April 2021 Median List Price % Difference from Elmore County
Elmore County, ID $305,000 --
Where Elmore County residents moved to…
Ada County, ID $548,495 179.8%
Jefferson County, KY $255,000 83.6%
Harrison County, MS $259,000 84.9%
Salt Lake County, UT $582,475 191.0%
Tarrant County, TX $339,925 111.5%
Owyhee County, ID $405,000 132.8%
Maricopa County, AZ $477,450 156.5%
Clark County, NV $380,000 124.6%
Bingham County, ID $299,900 98.3%
Davis County, UT $497,300 163.0%
Copyright © 2021 Boise Regional REALTORS®
Sources: realtor.com, based on select counties from the U.S. Census Bureau 2014-2018 5-year American Community Survey.
Elmore County Housing Summit — July 19, 2021Median Sales Prices around Idaho, Year-to-Date through June 2021
Median sales price (MSP) year-to-date through June 2021 for counties in BRR’s service area (Ada, Elmore, and Gem), those in the Boise City Metropolitan Statistical Area (MSA; Ada, Boise, Canyon, Gem,
and Owyhee), and others in the list of top counties to which Ada County residents moved to between 2014-2018 per the U.S. Census.
Selected Counties Existing/Resale New Construction
(in alphabetical order)
YTD thru June 2020 YOY % Chg YTD thru June 2020 YOY % Chg
Ada County $489,900 +40.3% $483,151 +17.6%
Bannock County $260,625 +31.0% $367,380 +14.19%
Boise County $444,930 +29.0% $333,396 +37.2%
Bonneville County $335,000 +45.7% $315,500 -10.0%
Canyon County $370,000 +42.3% $418,260 +40.1%
Elmore County $291,000 +41.3% $347,500 +23.9%
Gem County $362,750 +31.2% $382,400 +25.5%
Latah County $332,000 +23.4% $360,000 -19.8%
Owyhee County $309,000 +28.8% $353,312 +39.9%
Twin Falls County $297,000 +38.0% $359,362 +24.0%
Copyright © 2021 Boise Regional REALTORS® Sources: U.S. Census Bureau 2014-2018 5-year American Community Survey; Snake River Multiple Listing Service;
Elmore County Housing Summit — July 19, 2021 Greater Pocatello Association of REALTORS® Multiple Listing Service; and Intermountain MLS as of July 8, 2021.BRR’s Monthly Buyer and Seller Survey (In Development)
Each month, BRR members who participated in the Circle of Excellence Awards Program will receive an email asking them to share details about any transactions they’ve represented over the past few weeks — why
their clients made a move, where they moved to and from, how the client connected with their REALTOR®, whether the buyer was an investor or FTHB, etc. The goal is to compile real-time data about the reasons
people are moving to and from our area to share insights back with survey participants and BRR members. This survey was launched in April 2021 and while the data received so far are not representative of all activity,
initial results are provided for reference to illustration the kind of information we’re seeking to provide…
Top 3 Cities Buyers Moved From and
Their Reason for Buying in Ada County
1. Boise (Desire to live in a different area;
Desire for larger home; Desire to own) Top Referral Sources for Listings
2. Los Angeles (Desire for a new or custom-
built home; Investment purposes) 1. Referral from friend, neighbor, or relative
3. Meridian (Desire to own) 2. Past client
3. Personal contact from REALTOR®
4. Website contact from seller
Top 3 Cities Ada County Sellers Move To 5. Open house
and Their Reason for Selling
1. Boise (Desire to live in a different area) Top Referral Sources for Buyers
2. Kuna (Change in family situation)
3. Meridian (Home was too small; Change 1. Referral from friend, neighbor, or relative
in family situation) 2. Past client
3. Website contact from seller
4. Referred by another REALTOR®
5. Website contact via property inquiry
Copyright © 2021 Boise Regional REALTORS® Sources: Boise Regional REALTORS® and Intermountain MLS as of July 8, 2021.
Elmore County Housing Summit — July 19, 2021Impact of the Pandemic Copyright © 2021 Boise Regional REALTORS® Elmore County Housing Summit — July 19, 2021
Copyright © 2021 Boise Regional REALTORS®
Elmore County Housing Summit — July 19, 2021
Existing Homes Sold Off-Market in Elmore County, 2006-2021 YTD
Activity for existing/resale single-family homes between 2006-2020 + 2021 YTD thru Jun. For our purposes, an off-market sale has zero days on market or is an Unpublished Sold in IMLS. Off-market activity is not counted as
inventory but will show up as a pending or close sales in our market reports, and, put downward pressure on the days on market metric. Concerns about in-person showings related to COVID-19 may have contributed to the
uptick in off-market activity in 2020 and into 2021. Two other common reasons is when a homeowner is ready to sell but wants to find a home before they list, or they wants to make repairs before going on the market but
allows the listing to be shared within their agent’s brokerage. And with high demand, it’s likely the brokerage has an interested buyer and can put an offer together before the home is listed; however, there are MLS rules and
standards in the REALTORS® Code of Ethics about this practice and it should only be done at the seller’s request for specific reasons.

                                                                                                                                                                                                          49

                                                                                                                                                                                                                          40

                                                                                                                                                                                          30

                                                                                                                                                                             18
                                                                                                                                                               13

       6                           5                                         6                          5                           5             5
                                                                  3                       4                           3
                     2                           2

      2006         2007          2008          2009          2010          2011          2012          2013          2014         2015          2016          2017          2018          2019           2020         2021 YTD

                   Copyright © 2021 Boise Regional REALTORS®
                                                                                                                                                                                             Source: Intermountain MLS as of July 8, 2021.
                   Elmore County Housing Summit — July 19, 2021
In 2020, we discussed whether we would experience a V- or W-shaped recovery, and
cited a few positive trends in place at that time…
• Low vacancy rates — so not as many empty houses in place if foreclosures would have increased —
which have further decreased due to the insufficient supply vs. demand
• Low mortgage delinquency rates — which, as noted, has gone even lower, especially in Idaho
• Large home equity cushion — which, as noted, has further increased, particularly in Idaho
• Pent-up buyer demand paired with lower debt payments, higher personal savings rates, and low
mortgage rates (3.2% in 2020 vs. 6.4% in 2006) — which has increased as rates decreased
• Comparative affordability vs. nearby markets, plus desire to relocate from dense metros — while
relocations have continued, affordability has worsened due to the insufficient supply vs. demand
Copyright © 2021 Boise Regional REALTORS® NOTE: Recovery measured by Gross Domestic Product (GDP) Output. Sources: forbes.com/sites/dimawilliams/2020/07/10/is-it-going-to-get-better-before-it-gets-worse-
Elmore County Housing Summit — July 19, 2021 five-experts-share-predictions-for-the-us-housing-market-in-the-second-half-of-2020/#25a305aa7026; corelogic.com/insights-download/homeowner-equity-report.aspx.What we actually experienced was a K-shaped recovery…
• Those in recovering industries had the ability to save while
continuing to work, and have fared better financially as a result
• Those with personal circumstances or working in industries
needing assistance experienced layoffs and difficulty finding
work, tapped savings or incurred debt for living expenses, and are
now facing inflationary pressures making it harder to catch up
• With the continued shortage of housing, pushing up prices and
rents, there is a major concern that gaps in homeownership and
wealth will increase, especially along socio-economic lines
Copyright © 2021 Boise Regional REALTORS®
NOTE: Recovery lines based on Gross Domestic Product (GDP) Output by industries. Source: Investopedia.
Elmore County Housing Summit — July 19, 2021Financial assistance for property owners and renters…
Local resources available at idahohousing.com, eladacap.org, and 211.idaho.gov, search “Mortgage Payment Assistance”
at boirealtors.com, and access guides from the National Association of REALTORS® to share with clients in need.
Copyright © 2021 Boise Regional REALTORS®
Source: realtorparty.realtor/community-outreach/housing-opportunity/resources/covid-19-consumer-guides.
Elmore County Housing Summit — July 19, 2021Phases of the Pandemic Housing Market according to
Daryl Fairweather, PhD, Chief Economist for Redfin
Phase 1 — The Federal Reserve lowered interest rates to zero
which dropped mortgage rates to historic lows
Phase 2 — Everyone rushed to buy homes because the rates made
buying a home more affordable than renting in many cases
Phase 3 — Home prices shot up as a result as everyone rushing to
buy homes and bidding wars ensued
Phase 4 (Current) — Home prices are stabilizing as demand is
backing off and shifting over to the rental market
Phase 5 (Prediction) — Rents will shoot up especially in areas
further from city centers, but as more businesses re-open demand
will return, and rents will rise more uniformly across the country
Copyright © 2021 Boise Regional REALTORS® Source: Twitter.
Elmore County Housing Summit — July 19, 2021Serving Clients in Today’s Market
• Be respectful of buyer or seller requests regarding health and safety. Regardless of any mandates or ordinances, any client who requests masks, additional sanitization, limits on group sizes, etc.,
should be accommodated. Everyone has different circumstances that may required they maintain certain safety practices, so continue to keep PPE on hand, and utilize video, when as appropriate.
• Know your market stats. There are differences between the existing and new construction segments, between various price ranges, and as always, the adjustments made for amenities, finishes,
square footage, lot sizes, etc. — and staying ahead of any shifts within segments will be vital to how you advise both buyers and sellers.
• Reach out to your investor clients. For those with SFH rentals, encourage them to connect with their tax professional to see whether they could sell and use their equity to invest in apartment or
multi-family developments, or possibly other sectors like industrial or commercial.
• Talk to homeowners about preserving equity. Many have positive equity for the first time in years, and, we’re seeing more owner-occupant, cash buyers. Both are good trends for our market’s long-
term stability if that equity isn’t used elsewhere.
• Educate sellers about the pros and cons of various marketing strategies. Just because the market is fast does not mean you should skip any pre-listing preparation, professional photography, repairs,
staging, etc., especially if the goal is to sell for the highest price. Also, any off-MLS activity must be based on the wishes of the seller for a specific reason, making sure they understand that it will limit
the pool of prospective buyers, then if done, all applicable rules from IMLS and standards from NAR’s Code of Ethics must be followed.
• Discourage the use of “buyer love letters.” Avoid introducing a possible fair housing violation by counseling buyers not to write or submit such letters. Listing agents can help buyers’ agents whose
clients insist, by noting in agent remarks that seller does not want, will not read, etc., any love letter submitted, which can also protect the seller.
• Share resources that outline an area’s growth plan. Show buyers where they can do their own research on potential developments, school boundaries, road construction, etc., and never (ever)
promise their new neighborhood won’t change.
• Educate buyers about the pros and cons of various offer strategies — higher prices, fewer contingencies, delayed move-in dates, etc. Determine which work for their situation and which don’t. A
competitive market doesn't mean buyers should go over budget, sign contracts without reading them, or give away important protections just “to win.” Additionally, ensure buyers consult their
lender, tax professional, or financial advisor before pulling money out of retirement funds or other taxable savings accounts to avoid potential penalties.
• Be mindful of audio and video recording equipment. Prepare buyers that they may tour a home with cameras that can record or livestream audio and video to the owners, including doorbells. Also,
provide sellers with a checklist to be sure all equipment or any devices that are staying behind are deactivated prior to closing for the protection of the seller and buyer.
• Wire fraud is still an issue. Be sure all parties understand by whom and through what method information about transferring funds will be handled. If there is every any question whether an email
requesting information, sharing routing numbers, or asking for an updated password is legit, call the person on the email at a known phone number (not the one in the email) to verify.
• Explain the process and what you do on your client’s behalf. From transaction management, negotiations, working through repairs, and so much more, clarify the tasks you’ll be handling throughout
each phase of the sale or purchase, review the legal contracts and clauses that may be part of the sale, and prepare them for any big decisions before they must be made. You are their advocate.
Copyright © 2021 Boise Regional REALTORS®
Elmore County Housing Summit — July 19, 2021Historical Monthly Inventory vs. Median Sales Price for Elmore County
Activity for existing and new single-family homes combined between Jan 2006–Jun 2020. The sales price reported is based on a rolling 12-month median. This smooths out potential month-over-month swings due to
seasonality, a very high or low number of transactions in one month, very high or low sales prices that may occur one month but are not common, or other activity that may not be representative of the overall price
trends for the area. Sales price and inventory rose and fell together between 2007 and 2015. Since then, inventory has not kept up with demand, contributing to prices being pushed upwards.
400 $300,000
$263,500
350
$250,000
300
$200,000
250
200 $150,000
150
$100,000
100
$50,000
50
- $-
Nov
Nov
Nov
Nov
Nov
Nov
Nov
Nov
Nov
Nov
Nov
Nov
Nov
Nov
Jan 2007
Jan 2008
Jan 2009
May
Jan 2010
Jan 2011
Jan 2012
Jan 2013
May
Jan 2014
Jan 2015
Mar
Jan 2016
Jan 2017
May
Jan 2018
Jan 2019
Mar
July
Jan 2020
July
Jan 2021
Mar
May
Jul
Mar
May
Jul
Mar
Jul
Mar
May
Jul
Mar
May
Jul
Mar
May
Jul
Mar
Jul
Mar
May
Jul
May
Jul
Mar
May
Jul
Mar
Jul
Mar
May
Jul
May
Mar
May
Mar
May
Sep
Sep
Sep
Sep
Sep
Sep
Sep
Sep
Sep
Sep
Sep
Sep
Sep
Sep
Inventory Median Sales Price YTD
Copyright © 2021 Boise Regional REALTORS®
Sources: urban.org/urban-wire/newest-housing-data-indicate-we-likely-arent-housing-bubble; and Intermountain MLS as of July 8, 2021.
Elmore County Housing Summit — July 19, 2021Whether it's up or out, our region needs more supply.
But “more supply” doesn’t mean more rooftops
anywhere and everywhere.
Boise Regional REALTORS® is committed to supporting comprehensive,
regional planned growth, that offers adequate purchase and rental options
in all price points — not only to stabilize the market but to preserve and
improve the quality of life for all residents.
Copyright © 2021 Boise Regional REALTORS®
Elmore County Housing Summit — July 19, 2021If you are interested in engaging with this issue, BRR has resources
to help you learn more, information on attending meetings, and tips to make
your voice heard — on behalf of yourself and the people you represent.
For members of the public who would also like to become advocates for
housing policy, connect them to NAR’s Homeownership Matters program
and the new American Property Owners Alliance.
Copyright © 2021 Boise Regional REALTORS®
Sources: realtorparty.realtor; boirealtors.com/advocate; homeownershipmatters.realtor; and, propertyownersalliance.org.
Elmore County Housing Summit — July 19, 2021Market Reports
Market Reports are delivered to members via email monthly and past are always accessible on our website at
boirealtors.com/market-statistics. Reports include analysis, snapshot graphics of key metrics, printable PDF reports for
Ada, Canyon, Elmore, and Gem counties, reports for city data and condo/townhome activity.
Copyright © 2021 Boise Regional REALTORS®
Elmore County Housing Summit — July 19, 2021Sources and Methodologies
The information included in this report is based primarily on the data available through Intermountain MLS (IMLS), a wholly-owned
subsidiary of Boise Regional REALTORS® (BRR). IMLS data is based upon information secured by the agent from the owner or their
representative. The accuracy of this information, while deemed reliable, has not been verified and is not guaranteed. These statistics are
not intended to represent the total number of properties listed or sold in the geographies noted during the specified time periods. IMLS
and BRR provide these statistics for purposes of general market analysis but make no representations as to past or future performance.
Historical data from IMLS has not been adjusted for seasonality or inflation, unless noted. Data also secured from the following sources,
some of which may or may not have been seasonally adjusted or adjusted for inflation: Apartmentlist.com; ATTOM Data, Inc.; CoreLogic,
Inc.; Federal Reserve Bank of St. Louis; Freddie Mac; Greater Pocatello Association of REALTORS® Multiple Listing Service; knoema.org;
Mortgage Bankers Association; National Association of REALTORS®; realtorparty.realtor; Snake River Multiple Listing Service; Urban
Institute; U.S. Bureau of Economic Analysis; U.S. Census Bureau; and, U.S. Department of Housing and Urban Development.
Comparisons between sources were made using the most similar time periods available for each data set. While done infrequently, some
averages were taken, or data was estimated for time periods in which data was unavailable.
For questions, clarifications, or corrections, please contact BRR Chief Executive Officer, Breanna Vanstrom, at 208-376-0363.
Copyright © 2021 Boise Regional REALTORS®
Elmore County Housing Summit — July 19, 2021You can also read