Valuer-General's 2020 - Property Market Movement Report
←
→
Page content transcription
If your browser does not render page correctly, please read the page content below

State Valuation Service

Valuer-General’s 2020
Property Market Movement Report

Cover photos – clockwise from top left

Aerial view of suburbs, Brisbane. (Photo courtesy of Shutterstock)

Windmill, Darling Downs. (Photo courtesy of DNRME image library)

Railroad track passing through field with sugar cane on left and macadamia trees on the right, Bundaberg. (Photo courtesy of Shutterstock)

Aerial view of Townsville, North Queensland. (Photo courtesy of Shutterstock)

© State of Queensland, 2020.

The Queensland Government supports and encourages the dissemination and exchange of its information. The copyright in this publication is licensed
under a Creative Commons Attribution 3.0 Australia (CC BY) licence.

Under this licence you are free, without having to seek our permission, to use this publication in accordance with the licence terms.

You must keep intact the copyright notice and attribute the State of Queensland as the source of the publication.

Note: Some content in this publication may have different licence terms as indicated.

For more information on this licence, visit http://creativecommons.org/licenses/by/3.0/au/deed.en.

The Queensland Government is committed to providing accessible services to Queenslanders from all culturally and linguistically diverse backgrounds.
If you have difficulty in understanding this document, you can contact us within Australia on 13QGOV (13 74 68) and we will arrange an interpreter to
effectively communicate the report to you.

CS9741 03/20

                                                                                        Valuer-General’s 2020 Property Market Movement Report           ii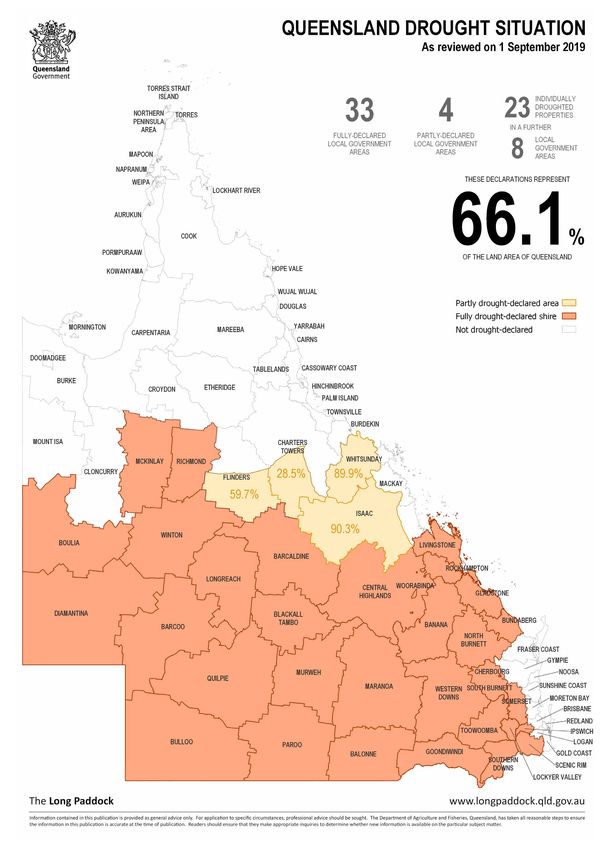
Contents

Valuer-General’s foreword                                                                                          iv

Introduction                                                                                                       2

Property market movement                                                                                           2

           Overall market trends                                                                                   3

           Brisbane                                                                                                3

           Gold Coast                                                                                              4

           South East Queensland                                                                                   4

           Wide Bay–Burnett                                                                                        4
               Fraser Coast                                                                                        5
               Bundaberg                                                                                           5

           Darling Downs                                                                                           5

           Central Queensland                                                                                      5
                Banana                                                                                             5
                Capricorn Coast                                                                                    6
                Mackay                                                                                             6

           North Queensland                                                                                        6
                Cassowary Coast                                                                                    6
                Hinchinbrook                                                                                       7
                Torres                                                                                             7
                Townsville                                                                                         8

           North West Queensland                                                                                   8

           Rural                                                                                                   10

Figure 1: Local government areas and the 2020 annual valuation program                                             1

Figure 2: Property land use by region, 2020                                                                        2

Figure 3: Overall percentage movement in total value since the previous annual valuation
          for the whole state and all local government areas valued in the 2020 annual valuation                   11

Figure 4: Queensland drought situation as at 1 September 2019                                                      14

Figure 5: Queensland drought situation as at 1 December 2019                                                       15

Table 1:   New median value and percentage movement in median value for residential and
           rural residential land since the previous annual valuation in local government areas
           valued in the 2020 annual valuation                                                                     12

Table 2:   New total value and percentage movement in total value for commercial, industrial,
           multi-unit and primary production land since the previous annual valuation in
           local government areas valued in the 2020 annual valuation                                              13

                                                               Valuer-General’s 2020 Property Market Movement Report    iii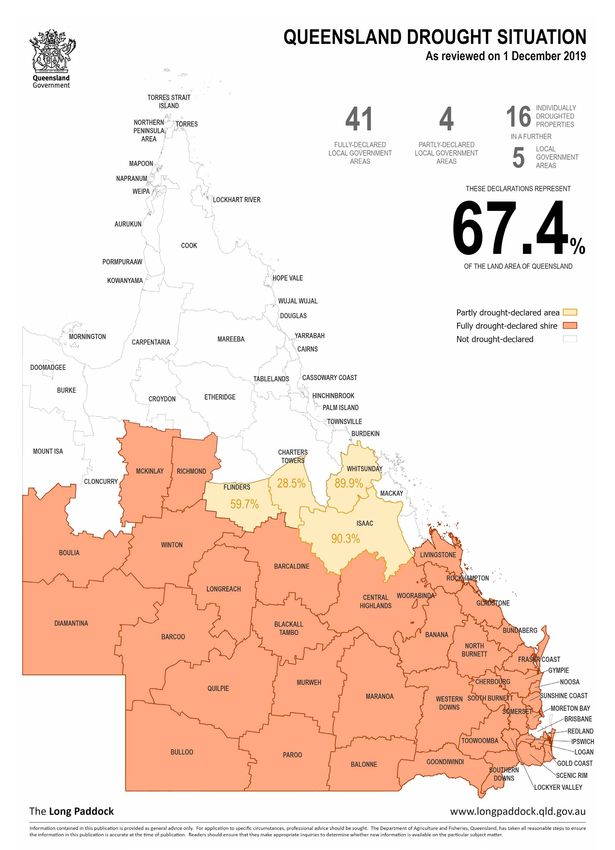
Valuer-General’s foreword

I am pleased to release this year’s property market                               Consistently high numbers of residents relocating from
movement report, ahead of the issue of the 2020 annual                            the southern states to Queensland will see the local
statutory land valuations on Wednesday, 4 March 2020.                             population rapidly increase, pushing down supply and in
                                                                                  turn, driving prices upwards.2
Following a state wide market survey and consultation
with local government and industry groups, 21 local                               Looking at other economic indicators, Queensland Treasury
government areas have been valued in accordance with                              advise ‘construction activity in Queensland continues
the Land Valuation Act 2010.                                                      to be supported by ongoing growth in domestic dwelling
                                                                                  renovation activity.3
A market survey report prepared for each local government
area details the sales of land in the area since the last                         Residential property prices have stabilised, following
valuation was made and the probable impact of those                               falls over the year to June 2019, underpinned by robust
sales on the value of land in an area. In addition, valuers                       population growth and lower interest rates. Nationally,
also consider factors that impact on the value of the land                        new housing approvals are around 40% lower than their
such as the state of the economy, commodity prices and                            late-2017 highs. Consequently, housing construction
population trends.                                                                across the country is forecast to remain subdued for the
                                                                                  next 18 to 24 months. 4
The 21 local government areas (Figure 1) receiving new
valuations this year are: Banana, Brisbane, Bundaberg,                            Continued caution by households has also resulted in
Burke, Cassowary Coast, Cloncurry, Flinders, Fraser Coast,                        the outlook for dwelling investment in 2019–20 being
Gold Coast, Goondiwindi, Hinchinbrook, Livingstone,                               softer than at budget. However, with apartment approvals
Mackay, McKinlay, Mount Isa, Richmond, Rockhampton,                               appearing to have bottomed out, dwelling investment is
Scenic Rim, Torres, Townsville and Winton.                                        expected to return to growth in 2020–21.5
These local government areas represent approximately                              The Find your annual land valuation online search displays
825,000 properties or 48 per cent of Queensland’s                                 annual valuation information from the valuation roll,
valuation roll.                                                                   residential market information and mapping products in
                                                                                  an easy-to-use online search. The search tool also displays
The new valuations will take effect on 30 June 2020 for
                                                                                  the movement in the residential median values of major
local government rating, state land tax and state land
                                                                                  residential localities and the local government area as a
rental purposes (where applicable).
                                                                                  whole. Queensland Globe continues to provide landowners
This report summarises the comprehensive analysis of                              with access to more detailed valuation information.
all property markets within the 2020 annual valuation
                                                                                  Our online resources including a rural sales map and the
program for Queensland by a team of regionally-based
                                                                                  Queensland Globe can be viewed at www.qld.gov.au/
valuers from the State Valuation Service of the Department
                                                                                  landvaluation, and can help you better understand your
of Natural Resources, Mines and Energy.
                                                                                  land valuation and local property market.
There are continued signs of strength in some areas
                                                                                  With over 406,000 Queensland landowners already
of Queensland’s property market. Generally, across
                                                                                  subscribed to receive their valuation notice electronically,
Queensland there has been increased sales activity in
                                                                                  I encourage all landowners to have their future valuation
rural markets. This has resulted in an uplift in land values
                                                                                  notice sent to them by email by visiting www.qld.gov.au/
within the majority of grazing, horticultural, small crop and
                                                                                  landvaluation and changing their contact details.
dryland farming industries.
                                                                                  I hope you find this year’s property market movement
Continued strong cattle prices within the beef industry and
                                                                                  report informative.
continued low interest rates are driving this confidence,
even though the majority of the state remains drought
declared.
Overall, the Queensland housing market remains sluggish,
with sales volumes easing, although house prices are
                                                                                  Neil Bray
proving resilient.1
                                                                                  Valuer-General
                                                                                  State Valuation Service

1, 2 Queensland Market Monitor September 2019, Issue 43, Real Estate Institute of Queensland, p4
3, 4, 5 Queensland Budget 2019–20: Mid year fiscal and economic review, Queensland Government, p6 and 9

                                                                                      Valuer-General’s 2020 Property Market Movement Report   iv
2020 Annual Valuation Program
Inset
TORRES SHIRE
FRASER
COAST
REGIONAL
GYMPIE
REGIONAL NOOSA
SHIRE
SUNSHINE
COAST
REGIONAL
WEIPA SOMERSET
REGIONAL
MORETON
BAY
COOK SHIRE REGIONAL
BRISBANE REDLAND
LOCKYER CITY
VALLEY IPSWICH CITY
REGIONAL CITY
LOGAN
DOUGLAS CITY
SHIRE
GOLD COAST
SCENIC RIM
CARPENTARIA MAREEBA CITY
REGIONAL
SHIRE SHIRE CAIRNS
REGIONAL
CASSOWARY
TABLELANDS
REGIONAL
COAST
REGIONAL
Included in Program
BURKE
CROYDON
SHIRE
SHIRE ETHERIDGE
SHIRE
Valued (21)
HINCHINBROOK SHIRE
TOWNSVILLE CITY Not valued (41)
BURDEKIN SHIRE
CHARTERS
MOUNT ISA TOWERS
CITY RICHMOND REGIONAL WHITSUNDAY
MCKINLAY SHIRE REGIONAL
SHIRE
FLINDERS SHIRE MACKAY REGIONAL
CLONCURRY
SHIRE
ISAAC REGIONAL
WINTON SHIRE
BOULIA LIVINGSTONE SHIRE
SHIRE
BARCALDINE
REGIONAL ROCKHAMPTON
LONGREACH REGIONAL
REGIONAL GLADSTONE
CENTRAL REGIONAL
HIGHLANDS
REGIONAL
BLACKALL-TAMBO
DIAMANTINA SHIRE BUNDABERG
REGIONAL
BANANA REGIONAL
BARCOO SHIRE NORTH
SHIRE
BURNETT
REGIONAL
SOUTH
QUILPIE SHIRE MURWEH SHIRE BURNETT
MARANOA
REGIONAL WESTERN REGIONAL
DOWNS Inset
REGIONAL
TOOWOOMBA
REGIONAL
BULLOO SHIRE
GOONDIWINDI SOUTHERN
PAROO SHIRE BALONNE SHIRE DOWNS
REGIONAL
REGIONAL
Figure 1: Local government areas and the 2020 annual valuation program
CS9772 2/20
Valuer-General’s 2020 Property Market Movement Report 1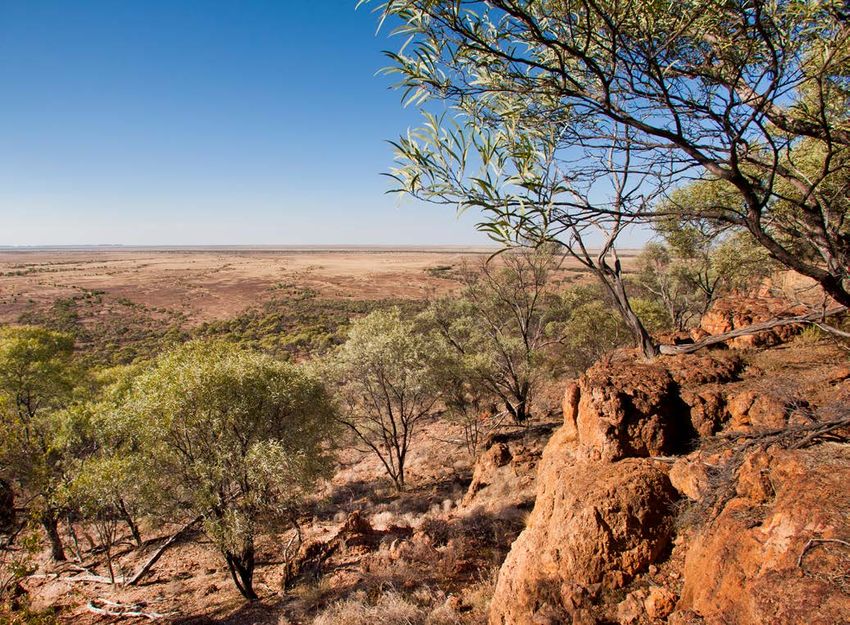
Introduction                                                    Property market movement
Two methodologies are used to undertake statutory land          The volume of daily lodgements recorded with the Registrar
valuations in Queensland—site value and unimproved              of Titles decreased over the first half of the 2019–20
value.                                                          financial year with an average of 2673 daily lodgements—
                                                                down 2 per cent from the previous financial year.
Site value is used to value all non-rural land. It is the
amount for which non-rural land could be expected to            Property value changes, both up and down, can be
sell for, at the date of valuation, without any structural      attributed to a number of factors:
improvements on the land (e.g. houses, buildings or
                                                                • supply and demand within the market place
fences). Site value includes site improvements made to the
land such as earthworks (e.g. levelling, filling or drainage    • consumer confidence
works). Excavations and drainage associated with a
                                                                • availability of finance
building are not included in site value.
                                                                • local, national and global economic factors
Unimproved value is used to value rural land. It is the
amount for which rural land could be expected to sell for, at   • the effects of extreme weather events
the date of valuation, without physical improvements such       Table 1 (page 12) shows the new median value and
as houses, fences, dams, levelling or earthworks. If your       percentage movement for residential and rural residential
land has been valued on an unimproved basis, it is either       land in the local government area since the previous
zoned rural (or equivalent) or designated rural for statutory   annual valuation. Table 2 (page 13) shows new total value
valuation purposes.                                             and percentage movement in total value for each land use
                                                                category since the last annual valuation was issued.
   Single unit residential
   Rural residential
   Multi-unit residential                                       Figure 3 (page 11) shows the overall percentage movement
   Commercial
   Industrial                                                   in total value since the previous valuation for each local
   Primary production
   Other                                                        government area included in the revaluation program, as
                                                                well as the whole state.
                                                                The overall percentage movements in land values for the
                                                                2020 annual valuation are summarised below:
                                                                • Fifteen local government areas recorded overall
                                                                  increases between 0.2 per cent (Townsville) and
                                                                  52.1 per cent (Winton).
                                                                • Of the 15 areas that increased, eight increased by
                                                                  0–10 per cent, one increased by 10–20 per cent and six
                                                                  recorded increases of more than 20 per cent.
                                                                Six local government areas recorded an overall decrease in
                                                                value of between 2.3 per cent (Cassowary Coast) and
                                                                44 per cent (Mount Isa).

Figure 2: Property land use by region, 2020

                                                                   Valuer-General’s 2020 Property Market Movement Report   2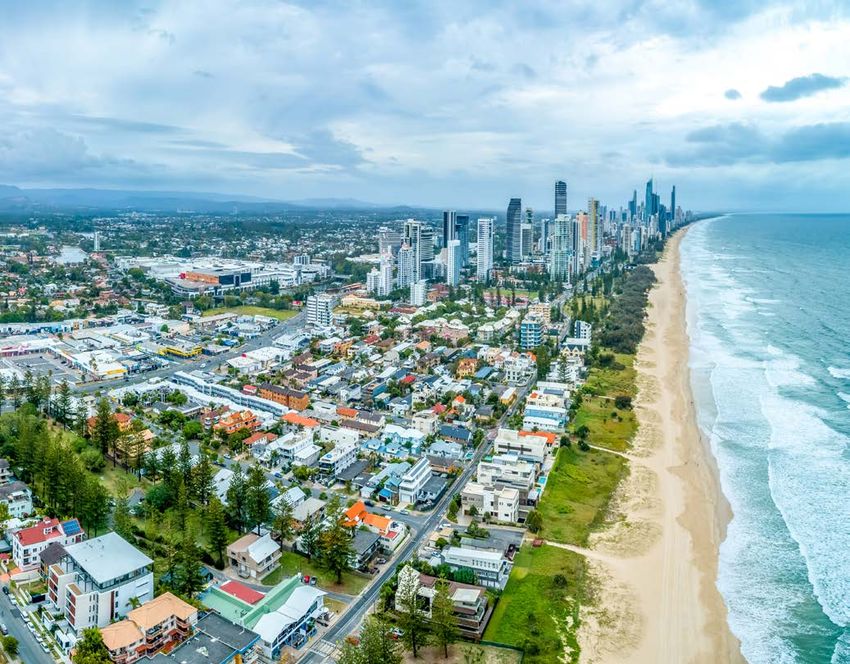
Overall market trends                                        rate environment. Another positive driver in the rural
                                                             market included the further development of horticultural
Generally the property markets in the larger urban centres   industries such as small crops and tree crops in the Wide
in South East Queensland and coastal towns in regional       Bay region.
Queensland have remained static or shown minor value
changes reflecting local economic conditions. Those          Brisbane
regional centres whose economies are closely linked to
the resource sector such as Mount Isa, Moura and Biloela     The residential market is the most significant land use
have seen significant reductions in land value from the      with approximately 305,000 valuations in the suburbs of
previous valuations.                                         Brisbane. The residential median land value increased
                                                             slightly from $455,000 to $460,000.
The property market in late 2019 was influenced by:
                                                             The median values of 115 suburbs did not change.
• Weakness in the global economy and a slowdown in           There were minor increases to several inner northern
  domestic economic growth                                   suburbs including Kalinga and Wooloowin. A number
• Continuing drought and impact on crop production           of Brisbane’s outer southern suburbs reflected minor
                                                             to moderate increases due to their affordability and
• Continuing caution in new dwelling investment              increased competition. The new median value for
• Subdued household spending                                 Durack is $280,000.

However, these drivers were offset by:                       There were seven suburbs that showed slight to minor
                                                             decreases. The Moreton Island townships of Bulwar,
• Government investment in infrastructure                    Cowan Cowan and Kooringal showed minor decreases.
• Growth in domestic dwelling renovation activity            The land values of the low to medium density multi-unit
• Stable demand for Queensland commodities and               residential markets across Brisbane have remained static.
  services                                                   The land values of high-density sites, located in the City
                                                             fringe have seen minor decreases as demand for the larger
• Strong domestic and international tourism at the time of   redevelopment sites has softened due to the existing
  valuation                                                  supply of units.
• Continuing low borrowing costs                             The total land value for rural residential land has increased
• Increase in labour force participation                     slightly. The median land value remains at $660,000.

• Strengthening business investment                          The demand for industrial land in Brisbane continues
                                                             to outstrip supply. This is particularly evident of land
• Solid population growth                                    with good access to major road networks in the prime
In contrast to the subdued conditions in a number of         transport and logistics market. This demand, as well as
urban areas, the rural property market continued to          the enhancements to infrastructure in the Pinkenba area,
improve with moderate to significant increases in most       has resulted in some significant increases to sites over two
areas throughout Queensland.                                 hectares in size in this locality.

Although the majority of the state remained drought          Segments of the Brisbane commercial market have been
declared, the market improvement was driven by the           active in 2019. For example, childcare, medical and large
continued effects of strong commodity prices such            format retail sectors have created their own localised
as those within the beef industry and the low interest       demand. However, the overall market has remained static.

Brisbane CBD. (Photo courtesy of Shutterstock)

                                                                Valuer-General’s 2020 Property Market Movement Report    3
The significant infrastructure commitment by all levels        Growth in industrial land value was strongest in coastal
of governments continues to impact the Brisbane CBD            locations such as Mermaid Waters, Miami and Burleigh
and the office market fundamentals. There has been a           Heads where values increased significantly. Yatala land
steady decline in total vacancy rates since January 2018,      values increased by a lesser, but still moderate amount.
consistent growth in tenant demand and positive net
                                                               Farming land values increased significantly across the
absorption. There is currently rental growth in both prime
                                                               Gold Coast local government area as a result of a market
and secondary markets, but the incentives offered remain
                                                               based review.
relativity high. Investment activity market remains strong
and yields have continued to tighten. The site values
across the CBD have largely remained static or decreased
                                                               South East Queensland
slightly since the last valuation in 2019.                     South East Queensland encompasses the valley areas
                                                               west of Greater Brisbane, coastal areas north to Noosa and
Gold Coast                                                     areas to the south of Greater Brisbane to the New South
                                                               Wales border, excluding Brisbane and the Gold Coast
Land values on the Gold Coast have risen slightly since
                                                               areas.
the 2018 valuation. The uplift is the result of a slight
overall increase in residential land values, and a moderate    The Scenic Rim Regional Council was valued as part of the
increase in industrial land values.                            2020 annual valuation.
Residential land values in central coastal and higher-         The demand for land in the Scenic Rim region has been
valued residential areas such as Mermaid Waters were           steady resulting in a minor increase in land values since the
static with some slight increases. The stronger areas          2018 valuation. The range of demand has resulted in static
were the middle range suburbs such as Pacific Pines            to slight increases in land values in the eastern half of the
and Helensvale that had the highest increase in overall        area, and slight to significant increases in the western half.
residential land value. Southern beach areas such as           Residential land values range from a static Beaudesert
Coolangatta and Tugun have also performed well with            market, minor decrease to moderate increase in Tamborine
minor overall increases in these localities.                   Mountain, and minor to moderate increases in Boonah.
The demand for larger and rural-residential land resulted      Rural homesites across the area reflected the broader
in an overall minor increase in value. Land values in the      variable change with a generally static to slightly
southern valleys were generally stronger than in northern      increasing market on the eastern side, and minor to
hinterland locations such as Wongawallen.                      moderate increases in the western half. Farming land
                                                               values experienced a similar locational market movement
Reduced demand for development sites has resulted in
                                                               along with stronger growth in value in properties less
a decline in the Surfers Paradise residential unit market,
                                                               than 40 hectares. Commercial land values in Boonah
but overall multi-unit land value increased slightly. Values
                                                               and Canungra increased by minor to moderate amounts,
in southern oceanfront locations experienced minor
                                                               while values generally remained static in Beaudesert and
increases, but a strong demand for development sites has
                                                               Tamborine Mountain. The industrial market was mostly
resulted in a significant increase in multi-unit land values
                                                               static with some minor to moderate increases in Boonah
in Burleigh Heads.
                                                               and Kalbar. Multi-unit land values in the region have also
Commercial land value increased by a minor amount              effectively remained static.
overall, with only a slight increase recorded in the
Southport core commercial area.                                Wide Bay–Burnett
                                                               Wide Bay–Burnett encompasses the service centres of
                                                               Gympie, Maryborough, Hervey Bay and Bundaberg, west to
                                                               the southern communities of Kingaroy and north to Monto.
                                                               These local government areas were valued in the 2020
                                                               annual valuation:
                                                               • Fraser Coast Regional Council
                                                               • Bundaberg Regional Council

Aerial panorama of houses on the Gold Coast
(Photo courtesy of Shutterstock)

                                                                  Valuer-General’s 2020 Property Market Movement Report   4
Fraser Coast                                                       Darling Downs
Fraser Coast Regional Council was last valued in 2018 and          Darling Downs encompasses the regional centre of
since that time the region has seen a minor growth in the          Toowoomba, areas south to the Granite Belt and New South
total statutory value of the local government area. The            Wales border, and west to Maranoa.
overall change was driven by minor increases in parts of
the residential and rural living sectors, and a significant        Goondiwindi Regional Council was valued as part of the
increase in farming land values. Residential areas within          2020 annual valuation.
the major urban centre of Hervey Bay, as well as a number          Overall, land values in the Goondiwindi region have
of coastal localities including Poona, Dundowran, Toogoom          increased by a moderate amount since the last revaluation
and Burrum Heads saw some increases in value, while in             in 2018. Residential values are generally static, except for
Maryborough and in the smaller hinterland villages’ values         a moderate increase in the town of Yelarbon, and moderate
generally remained static. Other land use sectors including        reductions within the towns of Inglewood and Texas.
commercial and industrial have generally remained
unchanged reflecting local economic conditions. Rural              A market based review of commercial and industrial land
living sites are a significant land use in the Fraser Coast        valuations within the town of Goondiwindi was undertaken
region and values have increased in most areas around the          to improve consistency and relativity. This review has
major centres and also to the west of region.                      resulted in varied slight to minor changes to valuations
                                                                   being issued.
Bundaberg                                                          Rural land sales have shown significant increases in value
Bundaberg Regional Council was last valued in 2017, and            throughout the larger mixed brigalow farming and irrigated
has seen minor growth in the total statutory value since the       floodplains in the locality of Goondiwindi, and to the west
last valuation in the region. The overall change was largely       of the region within the North Talwood locality. Rural sales
driven by minor increases in some parts of the urban               in the balance of the Goondiwindi Regional Council to the
sector, as well as significant increases in farming land           east, associated with smaller irrigation and mixed farms to
values. The residential areas within the major urban centre        large traprock lands, remained generally static.
of Bundaberg, as well as in smaller hinterland villages
such as Childers and Gin Gin have not changed, while               Central Queensland
some coastal areas have had varying impacts. Largely,              Central Queensland encompasses the regions of
commercial and industrial values are unchanged, however            Rockhampton, Gladstone and Mackay and extends south to
there have been moderate increases in the Bundaberg                Miriam Vale, north to Bowen and west to the Queensland–
Industrial Estate and the Kensington Park area. Rural              Northern Territory border.
residential living sites are a significant land use in the local
                                                                   These local government areas were valued in the 2020
government area, however most areas have seen either no
                                                                   annual valuation:
change or only minor increases.
                                                                   • Banana Shire Council
Grazing and cropping are significant land uses in the Wide
Bay–Burnett region. Farming land values have increased             • Mackay Regional Council
across the region with mostly moderate to significant
                                                                   • Livingstone Shire Council
increases evident reflecting the demand for both smaller
and larger farming properties.                                     • Rockhampton Regional Council
                                                                   Movement in the property markets across Central
                                                                   Queensland varied and changes for the individual local
                                                                   governments included in the 2020 annual revaluation
                                                                   program are summarised below.

                                                                   Banana
                                                                   Banana Shire was last valued in 2018 and has seen a
                                                                   moderate increase in the total statutory value of the local
                                                                   government area. The overall change was significantly
                                                                   influenced by the moderate increases in primary
                                                                   production values, consistent with state wide trends.
                                                                   Residential values within many of the smaller townships
                                                                   remained static, while the larger townships, including
                                                                   Biloela and Moura, decreased moderately to significantly
                                                                   in value. Commercial, industrial and rural residential
                                                                   land uses decreased in value, in line with the residential
                                                                   segment, although generally reductions were smaller.
Central area of Bundaberg. (Photo courtesy of Shutterstock)

                                                                      Valuer-General’s 2020 Property Market Movement Report      5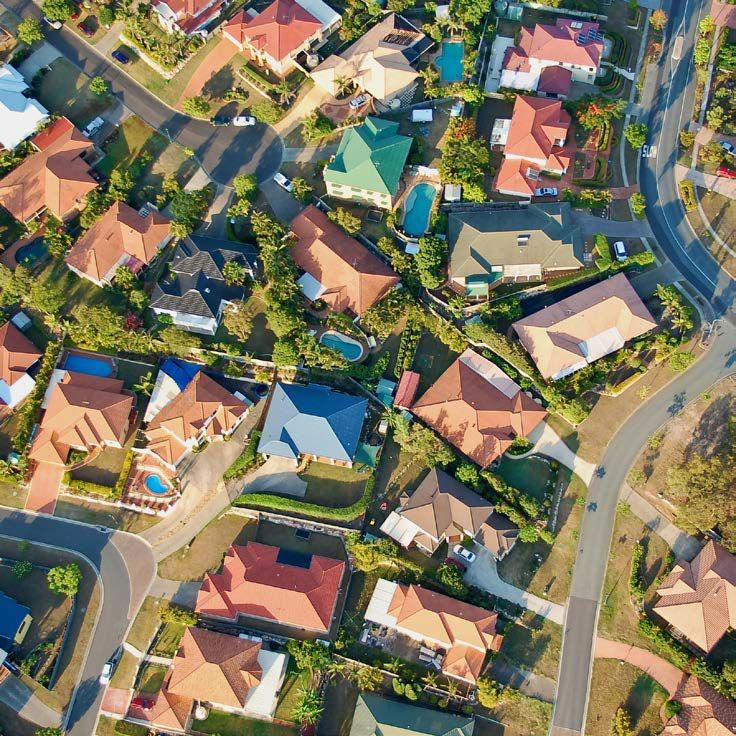
Capricorn Coast                                                  a resurgence in the resources sector driving demand for
                                                                 land suitable for heavy equipment maintenance.
The Capricorn Coast includes two local government areas,
Livingstone Shire and Rockhampton Regional Councils.             Grazing and cropping form a major component of the
Both local governments were last valued in 2017.                 economy and land use sector in the Central Queensland
                                                                 region. Throughout the region, primary production lands
The statutory values in Livingstone Shire have declined          increased in value due to improving commodity prices and
overall slightly since the last valuation. This change           low borrowing costs. The moderate to significant increases
was influenced by the residential, multi-unit residential        are consistent with similar movements experienced
and rural residential sectors where values fell slightly.        throughout the state.
Although, against this change, residential values in the
local government’s main centre, Yeppoon, as well as Pacific      North Queensland
Heights and Barlows Hill have increased slightly. Other
land uses, including commercial and industrial generally         North Queensland extends from the Burdekin in the south,
had minor reductions in value, reflecting local economic         north to Cape York, and west to the Queensland-Northern
conditions.                                                      Territory border.

Rockhampton Regional Council has seen a minor overall            These local government areas were valued in the 2020
decline in the total statutory values since the last             annual valuation:
valuation. The overall change was influenced by the minor        • Cassowary Coast Regional Council
value decreases in the residential, multi-unit residential
and rural residential sectors. Similar to Livingstone Shire,     • Hinchinbrook Shire Council
value changes varied depending on locality. For example,         • Torres Shire Council
the values for Gracemere residential and riverfront multi-
unit residential property saw moderate to significant            • Townsville City Council
increases, while the localities of Bajool and Stanwell had
significant falls. The commercial market experienced a           Cassowary Coast
slight overall reduction, similar to the residential market      The Cassowary Coast Regional Council comprises the
change, while industrial values had a larger decline             service towns of Innisfail in the north, Tully in the south,
in values.                                                       with the Island Coast area centred on Mission Beach to
                                                                 the east. The principal economic drivers in the region are
Mackay                                                           agriculture, sugar cane and banana crops, with tourism
Mackay Regional Council was last valued in 2017 and since        also being a contributor on the Island Coast.
that time the region has seen minor to significant growth        Within the town of Innisfail, the supply of properties listed
across most sectors. Most large residential suburbs,             on the market continues to outweigh demand for housing.
including West Mackay, North Mackay, Andergrove and              This has placed downward pressure on values and vendors
Beaconsfield have increased in value while some localities,      have had to meet the market. Moderate reductions in land
including Sarina and Laguna Quays fell significantly. Other      values have generally been experienced across Innisfail,
land uses, such as industrial and commercial increased           extending to the nearby village communities of Flying Fish
in value. Mackay CBD and the broader commercial sector           Point, Coquette Point, Wangan, South Johnstone
experienced minor to moderate increases in value while           and Mourilyan.
industrial lands have had a significant total increases with

Mission Beach, Cassowary Coast Region. (Photo courtesy of Shutterstock)

                                                                    Valuer-General’s 2020 Property Market Movement Report       6
Minor to moderate reductions in value were also evident The lack of demand for land in Forrest Beach has resulted
in the southern towns of Tully, Tully Heads and Cardwell in minor to moderate reductions of values in similar coastal
including Hinchinbrook Harbour. The small southern communities such as Taylors Beach. Other villages within
villages of El Arish and Silkwood, have generally the shire including Macknade and Trebonne have generally
experienced no change to value. experienced minor to moderate reductions in land values
due to flood impact. Minor increases in land value have
The Island Coast market contrasts with the trend of other
been experienced in the localities of Mount Fox and
townships. An improving market is evident with slight to
Abergowrie, albeit from low valuation bases.
minor increases in land value in Kurrimine Beach, Bingil
Bay, Wongaling Beach and South Mission Beach. There Similar to residential lands, there has been limited demand for
is still a supply of vacant land stock available in Mission rural residential properties throughout the local government
Beach where values have remained stable. area, however changes in value have been evident in certain
localities as a result of potential flood impact.
The sugar price has improved in recent times, and with
the Australian dollar trading around 67 US cents, potential The sugar price has improved in recent times and with
farm profitability has increased. Moderate increases the Australian dollar trading around the 67 US cents
have generally been applied to arable lands throughout range, potential farm profitability has increased. These
the Cassowary Coast region with significant increases fundamentals have not transferred through to the
implemented for those smaller farming units and also Hinchinbrook primary property market with sales generally
larger farming entities in line with market evidence. reflecting a maintenance of existing unimproved values.
The strong demand for beef and continued high commodity
Torres
prices has placed upward pressure on demand for
fattening units. Similar to the arable sector, minor to Torres Shire is located within the Torres Strait, and centred
moderate increases have generally been applied to grazing on communities on the main islands of Thursday Island,
properties across the shire. Prince of Wales Island and Horn Island. The last statutory
valuation undertaken in Torres was in 2015.
Hinchinbrook The presence of core state and federal government
Hinchinbrook Shire is centred on the sugar cane community services continue to underpin the region. The service and
of Ingham and associated villages north of Townsville. The administrative hub for the region is located on Thursday
last annual valuation undertaken for Hinchinbrook Shire was Island, with the transport hub located on nearby Horn
in 2018, and since then sales transaction volumes have been Island. These two hubs provide services not only for Torres
generally steady or slightly down across most market sectors. Shire, but also the nearby catchments of Torres Strait
Island Regional Council and the Northern Peninsula Area
There is a clear lack of demand for vacant sales, due
Regional Council.
partly to a reduced population base and also the value
represented by the existing housing stock. Residential land Stable economic conditions have given rise to a stable
values in Ingham have generally experienced declining property market which lacks major fluctuations. Slight
values with minor to significant decreases depending on to minor increases in land value have been experienced
location and the potential for flooding on the land. An over the five year period, including the suburbs of Rose
oversupply of vacant stock in adjoining townships such as Hill, Tamwoy, and Alpin located on Thursday Island, as
Forrest Beach has also placed downward pressure on land well as the community of Wasaga on Horn Island, and the
values in Ingham. With decreasing demand, vendors have beachside communities located on Prince of Wales Island.
had to meet the market, resulting in moderate reductions The supply of vacant land on the main island is limited
in value across all sectors, with more flood-prone lands and costs to construct continue to be high. There has been
experiencing a significant change. significant building development over the past decade
on Thursday and Horn Islands, with a number of building
This trend is also occurring in the commercial and
projects currently under construction.
industrial markets.
Meandering rivers and mangroves in front of Hinchinbrook Island, Queensland. (Photo courtesy of Shutterstock)
Valuer-General’s 2020 Property Market Movement Report 7The outer islands and mainland have generally remained has been an improvement in Queensland’s resource sector
stable, with minor increases in value observed overall in recent months, this positivity is yet to translate into the
since the last statutory valuation. industrial property market.
The commercial and retail market in the Townsville CBD
Townsville
have experienced challenging market conditions and in
It has been three years since the last valuation in general terms, land values within Townsville’s commercial
Townsville City. During this time, an unprecedented and and retail markets have remained stable.
devastating flood event occurred in February 2019. Using
Demand for multi-unit land has been limited with trends
available spatial information, approximately 12,000
similar to those experienced in the residential sector. Overall,
land parcels were identified as having been impacted.
multi-unit land values have generally remained unchanged.
Subsequently, the market reaction to the 2019 flood event
has been mixed, with the market undergoing a period of The more recognised arable areas of Townsville City are
adjustment. generally located in the north eastern part of the region,
namely Rollingstone and Mutarnee; and to the south in
The areas most impacted by the flooding have experienced
Majors Creek and Woodstock. A small number of sales have
limited sales activity as rebuilding continues. The impact
occurred over the current valuation period demonstrating
on value is yet to consolidate, however a softening of land
no change to the existing levels of value.
values is expected, especially in older established areas.
The grazing component of the City is predominantly located
Demand for well-located flood free land, particularly in the
to the south towards Majors Creek, Woodstock and Reid
inner city has driven the land market upward where minor
River, however smaller pockets of grazing lands are located
increases have been experienced. Western and Northern
to the west, south-east and northwest. Sales within this
suburbs that are flood free have generally experienced
sector support little change to the existing levels of value.
either a slight increase in land value, or remained static.
Moderate to significant increases in land value have been North West Queensland
experienced on Magnetic Island. ‘The Island’ was exposed
For the purpose of this report, North West Queensland
to significant mortgagee in possession sales prior to the
comprises the Gulf communities of Burketown to the north,
previous valuation, and values were reduced to a lower
south to the North West Highlands, and south east to the
level. These localities have now recovered and increases
Northern Downs. The key service centres of Mount Isa,
have been experienced.
Cloncurry, Julia Creek, Richmond, Hughenden, Winton and
The core industrial precincts in Townsville are Garbutt, Burketown are located within this region.
Mount St John, Mount Louisa and Bohle, situated
These local government areas were valued in the 2020
approximately six to eight kilometres south-west of the
annual valuation:
CBD. These precincts are well sought after, being in close
proximity to major transport routes, public transport and • Burke Shire Council
local shopping. Other major concentrations include the
• Cloncurry Shire Council
Port of Townsville, and areas to the south within Stuart
and Roseneath. • Flinders Shire Council
There has been sufficient sales activity within Townsville’s • McKinlay Shire Council
industrial market to demonstrate little change to existing • Mount Isa City Council
site values established in October 2016. Although there
• Richmond Shire Council
• Winton Shire Council
Located on the north western extremity of Queensland on
the Gulf Plains, Burketown is the principal town of Burke
Shire and its administrative and service centre. The last
statutory valuation undertaken in Burke was in 2014.
Burketown’s property market is small with few transactions
occurring each year. There is no active market in the town
and sales are limited and inconsistent. The most recent
evidence however, supports a reduction in the sale prices
of residential allotments, and moderate decreases in land
value have occurred across all sectors within Burketown.
Cloncurry is the principal town of Cloncurry Shire and is
the administrative and service centre for the district. The
major focus of the town is the provision of support services
for the mining and pastoral industries, and has historically
had a strong railway support presence. The last annual
Townsville City from Mt Stewart Lookout, Queensland.
valuation undertaken in Cloncurry was in 2016.
(Photo courtesy of Shutterstock)
Valuer-General’s 2020 Property Market Movement Report 8With a small population, Cloncurry’s market is sensitive to Slight reductions in urban land values have occurred
supply and demand pressures. An oversupply of housing across all sectors within Julia Creek, albeit from a low base.
released onto the market through an asset disposal
Mount Isa City Council is located in North West Queensland
program has placed downward pressure on sale prices, as
on the Barkly Highway approximately 890 kilometres west
vendors meet the market expectations. Added to that is
of Townsville and 200 kilometres east of the Northern
the high cost of construction, which limits the ‘buy-build’
Territory Border. The principal urban settlements are Mount
model and demand for vacant land.
Isa and Camooweal. The city is known for its iconic silver-
As a result, the Cloncurry market has experienced a lead-zinc mining operation at the centre of the North West
significant reduction in land values across the majority of Mineral Province. The last statutory valuation undertaken
urban sectors, with the exception of the industrial market, in Mount Isa was in 2016.
which has proven more resilient. Minor reductions to
During 2015, several mine closures or restructures had a
industrial land values have occurred.
negative impact on Mount Isa’s labour force. This created
Hughenden is the principal town and administrative centre an oversupply of available housing stock, and with it a
for Flinders Shire. It is located on the eastern extremity fall in rental returns and sale prices. Sales volumes also
of the Northern Downs, the western extremity of the started to retract. The property landscape started to
Einasleigh Uplands, and the upper reaches of the Gulf river experience distressed sale transactions which accounted
systems. The last annual valuation undertaken in Flinders for around 30 per cent of all housing transactions. The
was in 2014. median house price over this period has declined, however
has stabilised recently; sales volumes however, are still
The Hughenden property market is small, with few
low.
transactions occurring each year. Historically, there has
been a large stock of vacant serviced residential allotments High construction costs have meant there is little demand
within the town, which has generally kept a cap on sale for vacant land sales, to undertake a ‘buy and build’
prices and values within this sector. Reduced demand in proposition. It is cheaper to buy an existing product or
recent years for residential land has resulted in moderate renovate an existing product. Purchasers have been
decreases in residential land values in Hughenden. selective with parcels located in social housing suburbs,
where vendors have had to meet the market and lower
Land supply in most other urban sectors is more balanced
their expectations. The relaxation of yields has also placed
with the demand and minor increases have been identified
downward pressure in the investment market.
in the industrial and rural residential properties, whilst
valuations of the commercial lands have remained static. As a result, significant reductions in residential land
values have been experienced in the majority of Mount
Julia Creek is the principal town of McKinlay Shire Council
Isa’s suburbs. This downward trend is less evident in the
and is the council’s administrative and service centre. It is
industrial markets, where reductions are still evident,
located on the north western parts of the Northern Downs
albeit minor to moderate. The rural residential market has
and abuts the upper reaches of the Gulf river systems.
also experienced a minor reduction in land value.
The last statutory valuation undertaken in McKinlay local
government area was in 2014. The other town in the local government area is Camooweal.
This market is not aligned to the mining sector, so has not
Julia Creek’s property market is small with few transactions
been affected to the same extent as Mount Isa. A moderate
occurring each year. There has been a limited number of
reduction in value has occurred, however from a low base.
vacant land transitions occurring over the last six years.
Richmond is the principal town in the Richmond Shire and
is its administrative and service centre. It is located in the
centre of the Northern Downs and abuts the upper reaches
of the Gulf river systems. The last statutory valuation
undertaken in Richmond was in 2014.
The Richmond property market is a small market, with
few transactions occurring each year. There has been an
absence of vacant land transactions over the last six years.
Significant increases in land value have occurred across all
sectors within Richmond, albeit from a low base.
Winton is the administrative and service centre of
Winton Shire and is located in Western Queensland on
Landsborough highway approximately 177 kilometres
northwest of Longreach. The last statutory valuation
undertaken in Winton was in 2014.
Winton’s urban property market is small with few
Cawnpore Lookout outside of Winton (Photo courtesy of
transactions occurring each year. There has been a dearth
Department of Natural Resources, Mines and Energy)
of vacant land transactions occurring over the last six
6 Source: Meat and Livestock Australia, www.mla.com.au
years and, as such, all urban values in Winton Shire have
7 Source: Sheep Central, www.sheepcentral.com remained static.
Valuer-General’s 2020 Property Market Movement Report 9Primary production lands in the North West are dominated uniformity between valuations. This market based review
by beef cattle breeding and growing enterprises. has resulted in varied changes to valuations being issued.
Gulf country grazing properties are considered value for
money and demand exists from both family enterprises
Rural
looking to expand, and/or seeking grass and fodder, Continued optimism generally surrounded Queensland’s
and corporate investors who see these properties as rural property markets this year, even though the majority
agribusiness investments and an asset class for corporate of the state remained drought declared. This market
institutional investors. confidence has generally been driven by the continued
effects of strengthened commodity prices within the beef
Drought in most of Queensland has resulted in continued
and sheep industries, and low interest rates.
destocking, which has previously impacted on sale yard
prices for plainer lines of cattle. The North West Highlands Rural land values have continued to grow on the back of
and Barkly Tablelands area experienced a reasonable wet landowner expectations. Generally, the bulk of market
season and is one of the areas in Western Queensland that purchases are by existing family businesses acquiring
is not drought declared. Pastoral lands within this area are additional property, using scale to deliver farming
closely held and there has been a scarcity of sales in the operation efficiencies.
area. In spite of this, sales outside the area have been used
Potential purchasers take a long term view of the current
to demonstrate a level of value. These sales, together with
drought situation with regard to acquisition, but still
the historical evidence, support a moderate increase in the
remain cautious. Queensland has not seen a reasonable
new levels of land value.
season for some time, and most primary producers are
The fundamentals of the cattle industry are positive, still waiting for rains to start before re-stocking after the
with low exchange rates, low interest rates and a solid prolonged drought conditions.
demand for domestic and export beef products. Demand
The Eastern Young Cattle Indicator reflects the current
is increasing for low cost breeding country to facilitate
continued drought situation.
herd build up and turnoff options for adult cattle. When
compared to prices paid in other parts of the State, • 1 October 2014: 365 cents/kg/cwt (carcase weight)
the Northern Downs, and Desert Uplands are being • 4 October 2016: 719 cents/kg/cwt
increasingly seen as an attractive proposition
• 3 October 2017: 547.84 cents/kg/cwt
The Northern Downs has experienced about seven years of
severe drought and remains drought declared. Despite the • 2 October 2018: 481 cents/kg/cwt
drought conditions, properties have continued to sell over • 28 February 2019: 434 cents/kg/cwt
that period, although volumes are down. Those property
sales have demonstrated there has been no deterioration • 31 January 2020: 525 cents/kg/cwt6
in the property market. Sales activity has continued to High commodity prices for wool continues. In 2017,
grow with market values trending upwards. the price was at 1822 cents/kg and currently it is
The Northern Downs was affected by the unprecedented 1609 cents/kg.7
flooding event which occurred in February 2019. The flood Rural land purchased by resource companies for the
event resulted in significant property damage. Limited purpose of mining or other extractive industry are not
effective rainfall since has resulted in a poor pasture used to determine statutory land values of rural land. This
response in many areas. A secondary rain system occurred market activity has now slowed due to the state of the
later in March 2019 and was mainly confined to the range resource sector, and respective markets are now being
country in the west and south-west. influenced by rural landowners.
Since the flood, property sales in the Northern Downs
market have continued to occur. The fundamentals of
industry are positive, with a low exchange rate; low
interest rate and a solid demand for domestic and export
beef products. Demand exists for low cost breeding
country to facilitate herd build up, and demand exists for
turnoff options for adult cattle. When compared to prices
paid in other parts of the State, the Northern Downs are
considered a good option.
Producers are repositioning themselves to take advantage
of these opportunities. As a result, moderate increases
have occurred in those Northern Downs lands which had
not been impacted by flooding. Where abnormal flooding
did occur and depending on the severity, it’s recognised
that no change to the land values has occurred on lands
Photo courtesy of Shutterstock
with major disabilities.
As part of the 2020 statutory valuation, a full review of 6 Meat & Livestock Australia, https://www.mla.com.au
rural valuations in Winton Shire was undertaken to improve 7 Sheep Central, https://www.sheepcentral.com
Valuer-General’s 2020 Property Market Movement Report 10MOUNT ISA
-44.0
CLONCURRY
-10.6
HINCHINBROOK
-5.3 -7.2
ROCKHAMPTON
LIVINGSTONE
-2.3 -2.4
Overall percentage change by local government area
CASSOWARY COAST
TOWNSVILLE
0.2
BRISBANE
1.1
2020 annual land valuation
STATE WIDE
2.3
GOLD COAST
Local government area
4.8
BUNDABERG
5.4
SCENIC RIM
6.3
FRASER COAST
6.9
TORRES
8.1
MACKAY
8.3
BANANA
17.7
BURKE
25.0 23.2
GOONDIWINDI
MCKINLAY
33.1 32.0
FLINDERS
RICHMOND
36.0
WINTON
52.1
-20
-40
-60
60
40
20
0
% change
Figure 3: Overall percentage movement in total value since the previous annual valuation for the whole state and all local
government areas valued in the 2020 annual valuation
Valuer-General’s 2020 Property Market Movement Report 11Table 1: New median value and percentage movement in median value for residential
and rural residential land since the previous annual valuation in local government
areas valued in the 2020 annual valuation
Residential Rural Residential
Local government area New median Median value New median Median value
value ($) change (%) value ($) change (%)
Banana 51,000 -20.3 64,000 -13.5
Brisbane 460,000 1.1 660,000 0.0
Bundaberg 117,000 0.9 104,000 0.0
Burke 29,000 -37.0 18,000 0.0
Cassowary Coast 62,000 -8.8 102,000 -9.7
Cloncurry 25,000 -58.3 70,000 -36.4
Flinders 8,500 -26.1 20,000 0.0
Fraser Coast 136,000 5.4 124,000 6.0
Gold Coast 355,000 2.9 420,000 7.7
Goondiwindi 75,000 0.0 126,000 -0.4
Hinchinbrook 46,000 -17.9 98,000 3.2
Livingstone 128,000 -0.8 162,500 -5.8
Mackay 150,000 5.6 152,500 -3.2
McKinlay 9,000 0.0 41,500 -23.2
Mount Isa 42,500 -54.8 207,500 -18.6
Richmond 11,600 54.7 40,000 95.1
Rockhampton 99,000 -5.7 130,000 -7.1
Scenic Rim 170,000 1.5 250,000 5.3
Torres 210,000 10.5 152,500 3.4
Townsville 144,000 1.1 187,500 -1.3
Winton 15,000 0.0 50,000 0.0
Valuer-General’s 2020 Property Market Movement Report 12Table 2: New total value and percentage movement in total value for commercial, industrial, multi-unit and primary production land since the previous annual valuation in
local government areas valued in the 2020 annual valuation
Multi-unit Commercial Industrial Primary Production
Local government area New total value ($) Total value New total value ($) Total value New total value ($) Total value New total value ($) Total value
change (%) change (%) change (%) change (%)
Banana 2,705,500 -19.9 15,631,500 -6.0 34,640,200 -10.3 1,706,089,600 26.3
Brisbane 25,531,591,700 0.8 19,476,329,100 -1.5 12,613,211,500 0.2 74,938,500 1.3
Bundaberg 263,577,500 7.8 438,096,800 2.8 144,736,500 2.2 719,095,600 46.6
Burke NA NA 806,000 -34.8 578,000 -20.5 64,808,100 31.5
Cassowary Coast 52,610,500 -5.3 109,379,300 -5.7 57,529,600 -3.4 396,682,900 19.6
Cloncurry 464,500 -46.5 6,418,600 -34.9 23,334,320 -8.1 102,607,700 29.3
Flinders NA NA 777,400 -4.3 2,877,400 17.2 339,458,100 35.1
Fraser Coast 289,790,300 4.0 408,144,200 2.3 163,515,300 -2.0 331,439,100 44.3
Gold Coast 17,763,780,500 2.1 4,552,444,600 6.8 4,585,532,500 21.1 246,406,200 100.6
Goondiwindi 2,118,000 0.0 69,188,150 9.5 36,391,400 11.5 1,062,764,200 37.9
Hinchinbrook 6,561,500 -14.1 32,920,000 -11.8 17,148,700 -0.7 312,342,900 0.1
Livingstone 77,639,500 -5.9 70,927,300 -8.6 48,656,000 -9.9 265,417,400 10.3
Mackay 271,970,500 10.0 615,477,500 14.7 600,850,710 47.9 479,392,280 24.9
McKinlay NA NA 501,200 -9.0 1,835,000 27.0 240,370,200 32.9
Mount Isa 28,973,500 -41.5 45,183,900 -46.0 65,293,900 -13.3 50,125,400 31.8
Richmond NA NA 619,300 10.2 774,500 40.8 190,145,600 35.9
Rockhampton 133,881,200 -6.5 430,100,500 -4.3 184,944,570 -18.9 290,698,400 10.0
Scenic Rim 49,435,500 2.0 175,456,500 4.3 81,720,800 4.4 1,218,161,820 11.0
Torres 33,633,000 9.5 32,420,500 13.3 12,211,000 9.3 1,115,000 5.2
Townsville 748,636,100 -0.3 1,060,251,000 1.2 905,754,142 -1.5 80,868,500 0.0
Winton 79,500 0.0 1,814,750 4.0 1,027,250 0.0 287,308,600 55.3
Valuer-General’s 2019 Property Market Movement Report 13Figure 4: Queensland drought situation as at 1 September 2019
Source: www.longpaddock.qld.gov.au
Valuer-General’s 2020 Property Market Movement Report 14Figure 5: Queensland drought situation as at 1 December 2019
Source: www.longpaddock.qld.gov.au
Valuer-General’s 2020 Property Market Movement Report 15qld.gov.au/landvaluation
You can also read