ESR-REIT Investor Presentation - Investor Relations

Page created by Benjamin Robles
 
CONTINUE READING
ESR-REIT Investor Presentation - Investor Relations
ESR-REIT
Investor Presentation
 May 2018
ESR-REIT Investor Presentation - Investor Relations
Contents

 A    Overview of ESR-REIT

 B    Key Developments in FY2017 and 1Q2018

 C    Key Investment Highlights

 D    ESR-REIT’s Strategy

 E    Appendix

                                              2
ESR-REIT Investor Presentation - Investor Relations
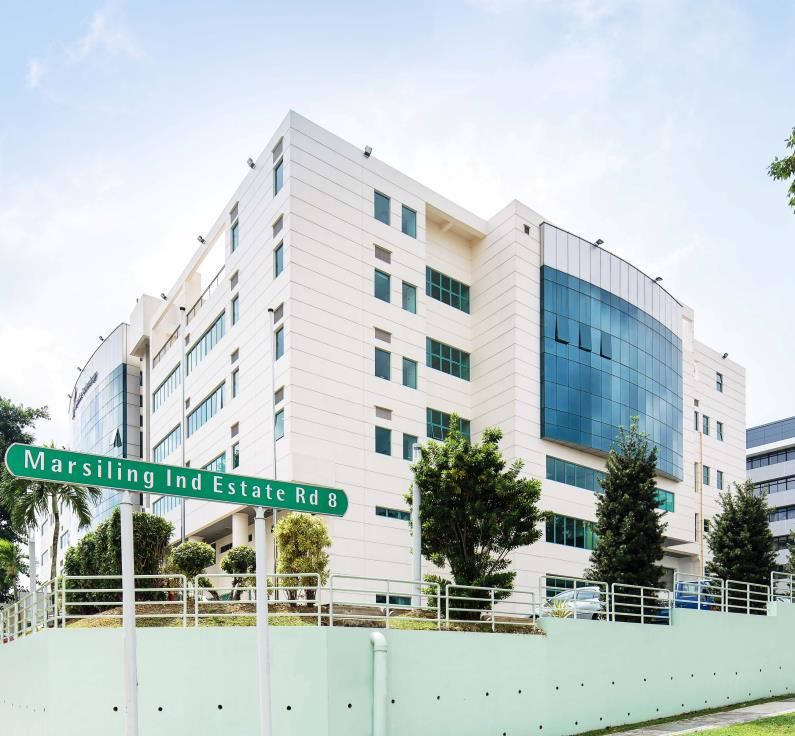
Overview of
ESR-REIT

120 Pioneer Road
ESR-REIT Investor Presentation - Investor Relations
Overview of ESR-REIT
Listed on the SGX-ST, Backed By Strong Developer-Sponsor ESR

    Listed on the SGX-ST since 25 July 2006 (formerly
     known as Cambridge Industrial Trust)
    Current market cap of c.S$847.3m(1)                                                                                      Portfolio valued at
    47 quality income-producing industrial properties
     valued at S$1.65(2) billion across 5 sub-sectors                                                                         S$1.65(2) billion
                                                                                    Diversified
                                                                                    portfolio of

                                                                                        47                        Portfolio
                                                                                                                occupancy of                 Weighted Average
                                                                                                                                             Lease Expiry of
                                                                                     Properties
                                                                                       across                 90.7%(3)                      4.4 years
                                                                                     Singapore
                                                                                                                   Above            Located close to
                                                                               Total GFA of                         JTC             major transportation
                                                                               approximately
                                                                                                                  Average           hubs and key
                                                                               9.7 million sq ft                  of 89.0%          industrial zones

    General Industrial               Light Industrial               Logistics/ Warehouse                  Hi-Specs Industrial             Business Park

               Note:
               (1) As at 31 March 2018.
               (2) Includes valuation of 7000 Ang Mo Kio Avenue 5 on a 100% basis, of which ESR-REIT has 80% economic interest.                                 4
               (3) Excludes 31 Kian Teck Way which is being held for divestment.
ESR-REIT Investor Presentation - Investor Relations
Key Developments
in FY2017 and
1Q2018

 120 Pioneer Road
ESR-REIT Investor Presentation - Investor Relations
Key Developments in FY2017
FY2017 Corporate Developments Established ESR-REIT’s Strong Foundations

     New Developer Sponsor               Name change to “ESR-REIT”          Rejuvenated Board of Directors
     Majority shareholder and2nd         Signifies importance of ESR-REIT   Board comprises of industry
     largest Unitholder;                 and ESR’s commitment towards it    veterans with industry network and
     demonstrates alignment of           as part of ESR’s business          expertise
     interest                            activities and growth plans

                           Successful Capital Recycling Has Grown Portfolio By >24%

                                                                                        Acquisitions
 Divestments
                                                                                           Acquired S$346.1m
      Divested S$57.3m
                                                                                           Higher-yielding
      Lower-yielding
                                                                                            value-adding assets
       non-core assets
                                                                                           Scalable with long-
      Each asset
ESR-REIT Investor Presentation - Investor Relations
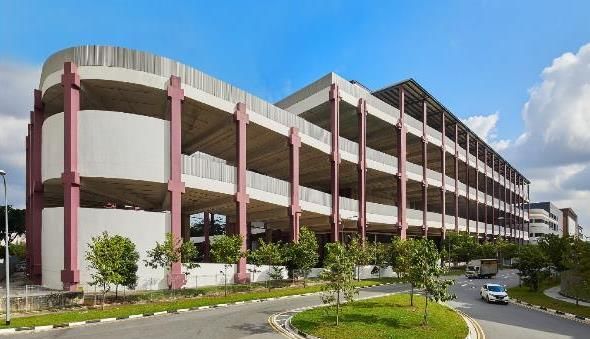
Key Developments in 1Q2018
Creating Opportunities Through Prudent Capital Management

     Debt headroom of c.S$458.2m (1Q2018)
     Well-poised with financial flexibility for future acquisitions, organic growth and AEI
      opportunities

         Successfully issued S$150.0m subordinated Perpetual Securities at 4.6% coupon in November 2017

          Successfully completed S$141.9m Preferential Offering on 28 March 2018, with 262.8m new units issued
          ‒     1.7x subscribed
          ‒     Proceeds from Preferential Offering used to pay down debt

         Gearing reduced from 39.6%(1) to 30.0% (as at 31 March 2018)

         Provides a debt headroom of c.S$458.2m
         ‒    Undrawn available RCF of S$213.0m
         ‒    Well-poised with financial flexibility for future acquisitions, organic growth and AEI opportunities

              Note:
              (1) As at end of 31 Dec 2017.
                                                                                                                     7
ESR-REIT Investor Presentation - Investor Relations
1Q2018 at a Glance

    DPU                          Gross                           Net Property                               Total              NAV Per Unit
   (Cents)                      Revenue                            Income                                  Assets                (Cents)
   0.847                     S$33.6m                              S$23.8m                          S$1.68bn(1)                    58.4

    Proactive Asset                                          Prudent Capital                                                Financial
     Management                                               Management                                                   Performance
  Healthy WALE of 4.4                               No refinancing till                                         No capital distribution
   years                                              4Q2018                                                      100% management
  Healthy 90.7%(2)                                  100% of assets                                               fees payable in cash
   occupancy                                          remains
                                                      unencumbered
                                                     92.6% of interest
                                                      rates fixed

        Note:
        (1) Includes valuation of 7000 Ang Mo Kio Avenue 5 on a 100% basis, of which ESR-REIT has 80% economic interest.
        (2) Excludes 31 Kian Teck Way which is being held for divestment.                                                                     8
ESR-REIT Investor Presentation - Investor Relations
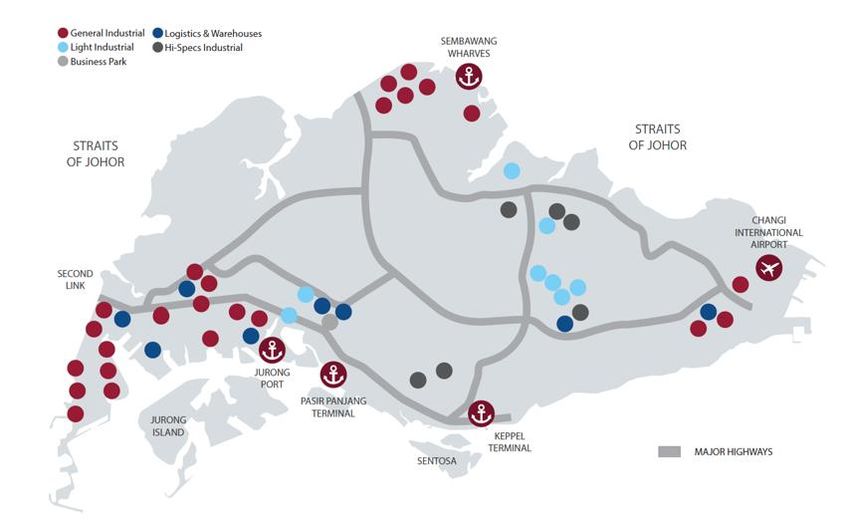
Key
Investment
Highlights

120 Pioneer Road
ESR-REIT Investor Presentation - Investor Relations
Key Investment Highlights
ESR-REIT’s Competitive Strengths

                                   Strong and
                                   Committed    Resilient &
                                   Sponsor      Balanced
                                                Portfolio

                                          6      1
                   Experienced
                   Management
                   Team
                                    5                   2
                                                                  Diversified
                                                                  Tenant
                                                                  Network

                                          4      3

                                   Active       Prudent Capital
                                   Asset        and Risk
                                   Management   Management

                                                                                10
Resilient &
                                                                                                                                             Balanced

1.1 Resilient & Balanced Portfolio                                                                                                       1
                                                                                                                                             Portfolio

Pro-active Lease Management with an Increasingly Balanced Portfolio

       ESR-REIT’s portfolio is more balanced with the move from single-tenanted to multi-tenanted since 2012
          ‒   In 2013 almost 44% of income expiring by way of single tenanted leases in the next 3 years
          ‒   Now only c.18% of single tenanted leases are expiring in the next 3 years
       Renewed and leased approximately 394,616 sq ft of leases in 1Q2018
          ‒   Occupancy at 7000 Ang Mo Kio Ave 5 up 2.3% to 94.2%, 3 months post acquisition
          ‒   Renewed 1 master lease, reducing single-tenanted lease expiries in FY2018 from 7.2%(1) to 6.0%
       Tenant retention rate of 70.7%
       Rental reversion of -0.2%% for 1Q2018

    WALE by Rental Income (as at 31 Dec 2012)                                   WALE by Rental Income (as at 31 Mar 2018)

30.0%                                                                        30.0%

25.0%               7.3%                                                     25.0%
                                                                                                                                  7.5%

20.0%                                                                        20.0%
                                             1.1%
15.0%                                                        0.8%            15.0%                         11.1%
           4.4%                                                                      12.1%
                                2.5%                0.9%
10.0%
                    21.9%                                                    10.0%            15.7%                               19.4%
                                            16.5%                                                                         10.3%
                                10.8%                       13.3%
5.0%       11.0%                                                             5.0%                          9.3%
                                                    9.5%
                                                                                                                   2.6%
                                                                                     6.0%
                                                                             0.0%
                                                                                               2.2%                1.7%   2.1%
0.0%
           2013     2014        2015         2016   2017    2018+                    2018      2019        2020    2021   2022    2023+
                                                    Single-Tenanted        Multi-Tenanted
                   Note:
                   (1) As at 31 December 2017.
                                                                                                                                     11
Resilient &

   Resilient & Balanced Portfolio (cont’d)
                                                                                                                                                                                         Balanced

4.
1
                                                                                                                                                                                     1
                                                                                                                                                                                         Portfolio

Value-Enhancing Acquisition to Expand Real Estate Portfolio

15 Greenwich Drive                                                                                    Ease of access to Changi Airport and Seletar Aerospace Park
                                                                                                           ‒ Strategic location favoured by logistics players
                                                                                                      Strategically located next to Paya Lebar Airbase
                                                                                                            ‒ Potential upside upon site redevelopment after airbase
                                                                                                               relocates in 2030

                                                                                                                Seletar
                                                                                                               Aerospace                                             Changi
                                                                                                                 Park                                                Airport

                                                                                                               15                              Paya
                                                                                                            Greenwich                          Lebar
                                                                                                              Drive                           Airbase
Announcement Date              24 April 2018
Description                    4-storey multi-tenanted ramp up logistics facility with
                               ancillary offices, located within Tampines LogisPark                                                                           Location of property
Land Area                      271,894 sq ft
                                                                                                      Located within established dedicated logistics
Gross Floor Area               455,396 sq ft                                                           park in Singapore with tight supply and limited
Land Tenure                    30 years expiring in 2041 (c.23 years remaining)                        available space
Estimated Purchase Price S$95.8 million(1)                                                            Increases portfolio occupancy from 90.7%(3) to
                                                                                                       91.2%
Independent Valuation(2)       S$96.4 million
                                                                                                      Logistics/Warehouse will form bigger portfolio
Occupancy                      100.0%
                                                                                                       proportion, increasing from 22.6%(3) to 27.1%
Method of Financing:           Fully funded by debt
                                                                                                      Income diversification from addition of leading
                                                                                                       logistics tenants

                   Note:
                   (1) Includes the consideration of S$86.2 million and estimated upfront land premium payable for the balance lease term of S$9.6 million.
                   (2) Independent valuation conducted by Savills Valuation and Professional Services (S) Pte Ltd as at 9 April 2018.                                                12
                   (3) As of 31 March 2018.
Resilient &

1.1 Resilient & Balanced Portfolio (cont’d)
                                                                                                                                   Balanced
                                                                                                                                   Portfolio

                                                                                                                               1

Singapore Industrial Property Market Demonstrates Signs of Stabilization

        Last 5 years saw large supply of industrial space (factory, warehouse and business park) coming
         on-stream
        Market expected to see signs of a slowdown in pipeline supply from 2018 onwards
        Latest forecasts show a considerable drop in supply from 2019 onwards

Historical and Future Industrial Property Market Pipeline (million sq ft)(1)
    25

    20
                                                                                                             10 year average
                                                                                                               (2008-2017)
    15

    10

    5

    0
             2013              2014             2015       2016         2017          2018     2019   2020           2021

                                                       Factory    Warehouse    Business Park
                    Note:
                    (1) Source: CBRE and JTC.
                                                                                                                               13
2.
 2 Diversified Tenant Network                                                                                                                                                                          2   Diversified
                                                                                                                                                                                                           Tenant

Diversified Portfolio Across Tenant Base and Asset Class                                                                                                                                                   Network

 Top 10 Tenants Account for 42.9% of Rental Income (as at 31 Mar 2018)
10.0%        8.9%
 9.0%
 8.0%                                6.8%
 7.0%                                                    6.4%
 6.0%
                                                                           4.7%
 5.0%                                                                                        3.9%
 4.0%                                                                                                          3.1%             3.1%
 3.0%                                                                                                                                                2.1%               2.0%             1.9%
 2.0%
 1.0%
 0.0%
        Heptagon Micro Hyflux Membrane                 Venture        Nobel Design        Data Centre (1)    HG Metal       Eurosports Auto    Strides Pharma      StorHub Kallang      Soon Wing
         Optics Pte Ltd Manufacturing (S)             Corporation    Holdings Pte. Ltd.    Operator         Manufacturing       Pte Ltd          Global Pte.           Pte. Ltd.     Investments Pte
                            Pte. Ltd.                   Limited                                               Limited                               Limited                                Ltd

 Asset Class by Rental Income                                                                                    Single-Tenanted vs Multi-Tenanted by Rental
 (as at 31 Mar 2018)                                                                                             Income (as at 31 Mar 2018)
 No asset class accounts for > 33.6% of rental income                                                            Stable mix of single and multi-tenanted portfolio

                                        1.6%
                             17.8%
                                                                                                                            40.8%
                                                             33.6%

                22.6%
                                                                                                                                                                     59.2%

                                            24.4%

          General Industrial         High-Specs Industrial    Logistics/Warehouse                                                   Multi-Tenanted          Single-Tenanted

          Light Industrial           Business Park

                        Note:
                        (1) Tenant cannot be named due to confidentiality obligations.
                                                                                                                                                                                                  14
2.
 2 Diversified Tenant Network (cont’d)                                                                                                           2   Diversified
                                                                                                                                                     Tenant

Enhanced Portfolio with Addition of New Assets                                                                                                       Network

    Increased exposure to tenants from High-Specs and Business Park sectors from c.15% to
     c.30%

    Pre Acquisition of 8 TSL and 7000AMK                                                Post Acquisition of 8 TSL and 7000AMK
    High-Specs / Business Park                                                            High-Specs / Business Park
    c.15% (S$0.2bn)                                                                       c.30% (S$0.5bn)

                                     3%                                                                               2%
                        12%
                                                                                                    28%                        20%
                                                    26%

                                Valuation
                             Valuation                                                                           Valuation
                                        (1)
                                S$1.4bn(1)
                             S$1.2bn                                                                             S$1.7bn (1)
                                                                                                                                     14%
              40%
                                                 19%
                                                                                                                37%

           High-Specs Industrial              Business Park                 Logistics/Warehouse    Light Industrial        General Industrial

             Note: Based on portfolio valuation as at 31 March 2018.
             (1) Excludes 9 Bukit Batok Street 22 which was divested on 5 March 2018.
                                                                                                                                                15
2.2 Diversified Tenant Network (cont’d)                                                                                                                                                                                      2   Diversified
                                                                                                                                                                                                                                 Tenant

No Industry Trade Sector Accounts For More Than 13.6% of ESR-REIT’s Rental                                                                                                                                     Income (1)        Network

                                                                                             Precision Engineering                             Computer, Electronic and Optical
                                                                    Construction, Civil &            2.8% Other Services                          Products (Manufacturing)
                                                                    Engineering Services                          2.6%
                                                                                                                                                           13.6%
                                                                           3.3%
                                                               Others   Data Centre
                                                               0.4%        4.2%
                                         M&E Services and Gas Supply
                                                    1.2%
          Architectural and Engineering Activities
           and Related Technical Consultancy                                                                                                                               Water & Energy
                           3.4%                                                                                                                                                6.9%

             Professional Computer, Electronic
                   and Optical Products
                           3.6%
                                                                                             Infocomm, 4.2%
                                    Others (Wholesale)
                                           0.8%                                                                                                                                   Fabricated Metal Products
                                                                                             Professional, Scientific                                                                       6.0%
                                     Education                                              and Techinical Activities,
                                       1.4%                                                                                   Manufacturing, 35.5%
                                                                                                      8.5%

                     Wholesale of Industrial, Construction and IT
                                                                                                    Wholesale, Retail
                        Related Machinery and Equipment
                                                                                                     Trade Services
                                       2.9%                                                                                                                                         Paper and Paper Products
                                                                                                    and Others, 20.6%
                                                                                                                                                                                              3.2%
                                            Car Distribution
                                                 3.1%                                                                Transportation and                                            Machinery and Equipment
                                                                                                                      Storage, 22.5%                                                        2.6%

                                                                                                                                                                                   Pharmaceutical
                                                                                                                                                                                       2.1%

                                                                                                                                                                           Rubber and Plastic Products
                                     Wholesale of Household Goods, Textiles,                                                                                                         1.0%
                                       Furniture & Furnishing and Others
                                                     12.4%

                                                                                                                                                         General storage
                                                                                                                                                             10.9%
                                                                              Specialised storage
                                                                                     3.9%                                Logistics
                                                                                                                           7.7%

 Portfolio is well-diversified across 4 primary industry segments with no individual sub-sector accounting for more than 13.6% of ESR-REIT’s rental
  income
 ESR-REIT’s rental income is derived from over 23 different sub-sectors
 Notable key tenants include:

                      Note:
                      (1) Breakdown by Trade Sectors (by Rental Income) as at 31 Mar 2018.
                                                                                                                                                                                                                            16
3. Prudent Capital and Risk Management
                                                                                                        3

 3                                                                                                      Prudent Capital
                                                                                                        and Risk
                                                                                                        Management
100% Unencumbered Assets, with 92.6% of Interest Rates Fixed for the Next 1.6 Years

    Non-renounceable S$141.9m Preferential Offering successfully completed on 28 March 2018
       ‒   Proceeds used for debt repayment
    Low gearing of 30.0%
       ‒   Debt headroom of c.S$458.2m provides financial flexibility
    92.6% of interest rates fixed for the next 1.6 years
    Portfolio remains 100% unencumbered

                                                                                    As at 31 Mar 2018

Total Gross Debt (S$ million)                                                                  502.0
Debt to Total Assets (%)                                                                         30.0
Weighted Average All-in Cost of Debt (%) p.a.                                                    3.75
Weighted Average Debt Expiry (years)                                                              1.8
Interest Coverage Ratio (times)                                                                   3.6
Interest Rate Exposure Fixed (%)                                                                 92.6
Proportion of Unencumbered Investment Properties (%)                                             100
Available Committed Facilities (S$ million)                                                    213.0

                                                                                                   17
3. Prudent Capital and Risk Management (cont’d)
                                                                                                                                                            3

 3                                                                                                                                                              Prudent Capital
                                                                                                                                                                and Risk
                                                                                                                                                                Management
Financial Flexibility Given Low Gearing and Available Undrawn RCF

                                                       Gearing (as at 31 Mar 2018)
                                                     50.0%
                                                                                                                                              45% Regulatory
    ESR-REIT’s current gearing at                   45.0%
                                                                                                                                              Limit
     30.0% provides for a debt                       40.0%      Debt
     headroom of c.S$458.2m                          35.0%      Headroom of
                                                     30.0%      c.S$458.2m
     ‒ Undrawn available RCF of
       S$213.0m                                      25.0%
                                                     20.0%                                                                        35.1%
                                                     15.0%                              30.0%
                                                     10.0%
                                                       5.0%
    Financial flexibility enables the                 0.0%
     REIT to be well poised for future                                                ESR-REIT (1)
                                                                                      ESR-REIT                      WeightedAvg
                                                                                                                    Weighted AvgofofIndustrial  REIT (2)
                                                                                                                                     IndustrialREITs
     acquisitions and portfolio                        Base SOR Rates Overtime
     enhancements
                                                        (%)
                                                        2.5                                                        3Y SOR ↑
                                                                                                                    c.35bps
                                                        2.0             3M SOR ↑
                                                                         c.37bps
    Base SOR rates have increased
                                                        1.5                                                                               5Y SOR ↑
     by c.35bps                                                                                                                            c.35bps
                                                                                                   1Y SOR ↑
     − ESR-REIT is well protected                       1.0
                                                                                                    c.34bps
       given 92.6% of its interest rates
                                                        0.5
       are fixed
                                                        0.0
                                                                          3M                         1Y               3Y                     5Y
                                                                                                  29/Mar/2018   02/Jan/2018

             Note:
             (1) Reflects ESR-REIT gearing as at 31 March 2018.
             (2) Refers to weighted average gearing of industrial REITs as at 31 December 2017.                                                            18
3. Prudent Capital and Risk Management (cont’d)
                                                                                                                                    3

 3                                                                                                                                      Prudent Capital
                                                                                                                                        and Risk
                                                                                                                                        Management
Well-Staggered Debt Maturity Profile

         No refinancing till 4Q2018

         Undrawn available committed RCF of S$213.0m provides financial flexibility

Debt Maturity Profile (as at 31 Mar 2018)
          200

                                               43(2)
    S$m

          100                                                                              170(2)

                   155(1)                                               160

                                              107

                                                                                                                            50
                                                                                            30
            0
                   2018                       2019                      2020               2021               2022          2023
                                         MTNs                       Unsecured Term Loans            Undrawn committed RCF

                 Note:
                 (1) Expires in 4Q2018.
                 (2) Undrawn committed facility amount available.                                                                  19
4.4 Active Asset Management                                                                                                                                                      Active
                                                                                                                                                                                 Asset
                                                                                                                                                                                        4

AEI to Rejuvenate Portfolio and Attract High-valued Tenants                                                                                                                      Management

                                                                              Benefits of AEI

                                                                                   Asset enhancement will facilitate addition of two good
                                                                                    quality tenants to ESR-REIT’s portfolio

                                                                                   Exposure to high-value added automotive technology
                                                                                    and precision engineering sector(1)

                                                                                   Asset and Portfolio Stability
                                                                                     ‒   Secured long leases with two major tenants
                                                                                     ‒   Following project completion, property will be fully
                                                                                         occupied for the next 5 years
  30 Marsiling Industrial Estate Road 8
                                                                                   Well-positioned asset with improved specifications
 Address                       30 Marsiling Industrial Estate                        ‒ Strategically located close to Woodlands Industrial
                               Road 8
                                                                                         Estate and close to key transport networks to cater to
 Gross Floor Area              217,953 square feet                                       prospective users in the future
 Remaining Land Tenure         31.7 years

 Valuation                     S$36.6 million

 Estimated Project
                               1Q2019
 Completion Date

               Note:
               (1) Aptiv is a global technology company that develops safer, greener and more connected solutions, which enable the future of mobility. FormFactor, Inc. is a
                   Nasdaq-listed company and is a leading provider of essential test and measurement technologies along the full Integrated Circuit life cycle - from           20
                   characterization, modelling, reliability, and design de-bug, to qualification and production test.
4.4 Active Asset Management (cont’d)                                                                       Active
                                                                                                           Asset
                                                                                                                  4

Divestments of Non-Core Assets to Improve Portfolio Returns                                                Management

   Divestments of non-core assets remain a part of our strategy to continuously improve our portfolio
    and returns

Divestment of 9 Bukit Batok Street 22                        Sale Consideration

                                                                S$23.9 million

                                                                1.3% above valuation of S$23.6 million

                                                                30.6% above acquisition price

                                                             Completion Date

                                                                5 March 2018

                                                                                                          21
6.5 Experienced Management Team                                                                                             Experienced
                                                                                                                            Management
                                                                                                                            Team
                                                                                                                                          5

Experienced Professionals with Proven Track Record and Real Estate Expertise

       Board of Directors

     Ooi Eng Peng                       Adrian Chui                 Akihiro Noguchi             Jeffrey David Perlman
     Independent Chairman               CEO and Executive           Non-Executive Director      Non-Executive Director
                                        Director

     Jeffrey Shen Jinchu                Bruce Kendle Berry          Erle William Spratt         Philip John Pearce
     Non-Executive Director             Independent Non-Executive   Independent Non-Executive   Independent Non-Executive
                                        Director                    Director                    Director

       Management Team

                        Adrian Chui                                 Shane Hagan                     Nancy Tan
                        CEO and Executive Director                  COO and CFO                     Head of Real Estate

                        Charlene-Jayne Chang                        Loy York Ying
                        Head of Capital Markets                     Head of Compliance

       The management of ESR-REIT has collective experience of more than 70 years in the real estate and
                                       financial services industries

                                                                                                                               22
Strong and

5.6 Strong and Committed Sponsor
                                                                                                                         Committed
                                                                                                                         Sponsor

                                                                                                                                  6

ESR-REIT Corporate Structure

ESR is the REIT’s second largest unitholder; has c.80% stake in the REIT Manager, c.100% stake in Property
Manager and a c.13% stake in the REIT

                                                                              ESR

                                                                               c.100%

                                                                     ESR Investment                       Mitsui & Co.
                                                                  Management (S) Pte Ltd                      Ltd

                                                                    c.100%      c.80%                            20%

                                                  ESR Property Management                ESR Funds Management (S)
                                                   (S) Pte. Ltd. (“ESR-PM”)                 Limited (“ESR-FM”)
                                                     (Property Manager)                       (REIT Manager)

                                                   Property      Property           Management       Management
                                                management       management            services      and other
                                                   services      and other                           fees
                                  Acts on                        fees
                                  behalf of
               RBC Investor      Unitholders
               Services Trust                                                 ESR-REIT
             Singapore Limited
                 (Trustee)       Trustee fees

                                                                               Assets

                                                                                                                         23
5.6 Strong and Committed Sponsor (cont’d)
                                                                                                                                                                                            Strong and
                                                                                                                                                                                            Committed
                                                                                                                                                                                            Sponsor

                                                                                                                                                                                                     6

ESR - Leading Pan-Asian Logistics Real Estate Platform
       Focused on developing and managing modern, institutional-quality logistics facilities with a high quality
        tenant base                                                                                                                                                External Assets
                                                                                                                                                                  Under Management
       Co-founded by Warburg Pincus and backed by blue-chip institutional investors, including:

                                                                                                                                                                  >US$11 billion
                                                                                                   Fund
          Equity                                                                                   Level
        Investors                                                                                Investors
                                                                                                                                                                   Gross Floor Area

       With operations across China, Japan, Korea, Singapore and India, ESR has emerged as a leading                                                               10 million sq
        Pan-Asian logistics real estate platform                                                                                                                       metres
       ESR-REIT has access to the pipeline of assets from ESR in an increasingly asset scarce environment                                                        in operation and
        for quality logistics assets                                                                                                                                   under
       In August 2017, SK Holdings made a strategic equity investment of USD 333 million for a 10% fully
                                                                                                                                                                    development
        diluted stake in ESR
    China                         Korea                          Japan                              Singapore                      India                           Australia

       One of the top                 One of the largest           A market leader in terms          Invested in ESR-REIT,         To build a leading real        Entered Australia
        players by logistics            modern warehouse              of new development                 an early industrial S-         estate platform in both         market in 2017 and
        facilities area                 developers in Korea           starts over the last 24            REIT player with >9m sq        size and volume                 became the largest
                                        upon completion of            months                             ft of GFA across key                                           shareholder of
       A leading landlord of           projects under                                                   industrial zones              Initial focus on Tier-1         PropertyLink and
        key global                      development                  A top 5 institutional                                             city agglomerations,            Centuria Capital which
                                                                      operator with an                  c.13% stake in ESR-
        e-commerce players                                                                                                              including Mumbai, Pune,         collectively have over
                                                                      established and                    REIT; c.80% stake in
                                                                                                                                        Delhi, Chennai and              A$6b of AUM
                                                                      experienced team                   ESR-REIT Manager and
                                                                                                                                        Bangalore
                                                                                                         c.100% stake in its
                                                                                                         Property Manager

                         Note:   Information above as of 31 March 2018.
                                                                                                                                                                                           24
5.6 Strong and Committed Sponsor (cont’d)
                                                                                                                                                    Strong and
                                                                                                                                                    Committed
                                                                                                                                                    Sponsor

                                                                                                                                                             6

Ability to Leverage Off Sponsor’s Network and Expertise
Strategic relationship with leading global e-commerce companies, retailers, logistic service providers/
3PLs and manufacturers
     Landlord of E-Commerce                               Collaborations with 3PLs /               Built-to-suit Logistics Solutions
     Companies & Retailers                                Logistics Operators                      Provider & Reliable Landlord

       One of the largest landlords of                      Strategic alliance with major 3PLs      Developing built-to-suit state of the
        leading e-commerce companies in                       and reputable logistics service          art modern warehousing and
        China                                                 providers                                distribution facilities for leading global
                                                                                                       e-commerce companies and
       One of the major warehouse facilities                Examples of key clientele:
                                                                                                       manufacturers
        providers for offline retailers
                                                                                 (1)
                                                                                                      One of the landlords of choice for
       Examples of key clientele:
                                                                                                       cold-storage users
                                                                     (1)
                                                                                           (1)
                                                                                                      Examples of key clientele:

          Diversified Customer Source                             Broad Offering to Clients                 Economies of Scale

              Note:
              (1)   Former clients of Redwood founders.
                                                                                                                                                    25
ESR-REIT’s
Strategy

120 Pioneer Road
ESR-REIT’s Strategy
ESR-REIT’s Targeted 3-pronged Strategy to Grow into a Sizable Pan-Asian Industrial REIT
ESR-REIT has adopted a 3-pronged strategy to optimise Unitholders returns while reducing risks
                                                 Organic Growth

                                                                       Acquisition
                                      Capital                        and Development
                                    Management                           Growth

                                                 Acquisition and                                Capital
          Organic Growth                         Development Growth                             Management
     AEIs to unlock value and             Yield-accretive, scalable,                    Debt to Total Assets
      attract high-valued tenants           value-enhancing acquisition                    between 30- 40%
     Pro-active asset                      opportunities in Singapore                    100% unencumbered
      management to optimise               Potential pipeline of assets                  Well-staggered debt maturity
      investor returns                      from ESR                                       profile
     Divest low-yielding assets           Exploring opportunities to                    Diversify funding sources
      and redeploy to higher                participate in development                     into alternative pools of
      quality properties                    projects, either individually                  capital
     Enhance tenant base by                or in JV with ESR
                                                                                          Broaden and strengthen
      leveraging Sponsor                                                                   banking relationships
      networks

                                                                                                                       27
ESR-REIT’s Strategy
Market Conditions Still Challenging but Opportunities Remain

         Market conditions remain challenging but we remain cautiously
  1
         optimistic
          Continue to build on the strong foundations established in 2017
          To continue rejuvenation of existing asset portfolio in a pro-active manner
          Strategy continues with asset acquisitions, development projects and appropriate
           M&A transactions which offset the impact of conversions from STB to MTB

        Continued Support From Developer-Sponsor ESR
  2      ESR demonstrated financial support by committing to undertake up to S$125.0m in
          March 2018 Preferential Offering
         Continued support in terms of expertise, access to their tenant base and partner
          networks

        Financial Flexibility
 3
         Low gearing of 30.0%, with debt headroom of c.S$458.2m (1Q2018)
         Undrawn available committed RCF of S$213.0m (1Q2018)

                                                                                              28
Appendix

120 Pioneer Road
ESR-REIT’s Key Milestones
       13 Years of Development, Chartering Into A New Growth Phase

     2006                                         2007                                  2008                             2009                              2010                            2011

   Listing of Cambridge                     Launched first private               Acquisition of majority          Private placement of              Private placement of            Rights issue of S$56.7m
    Industrial Trust (“CIT”)                  placement in the USA                  ownership of CITM by              S$28.0m for AEI and                S$70.0m and                      for acquisition of 3
    on the SGX-ST                             under Rule 144A – the                 NAB, Oxley Capital and            working capital purposes           preferential offering of         properties
                                              first Singapore REIT to               Mitsui remain as JV
                                                                                                                     Completed S$390.1m of
                                                                                                                                                         S$20.4m                         Refinanced S$320m of
                                              raise funds in this                   partners
                                                                                                                      loan refinancing                  Awarded the “Best Deal           loan facilities
                                              manner                               S$358m IRS completed                                                 in Singapore 2009” at
                                                                                                                                                         the Asset Triple A Asian
                                                                                   Established S$100m of                                                Awards for raising
                                                                                    revolving credit facilities                                          S$390.1m in 2009

                                                    2016                                      2015                        2014                                2013                            2012

                         REIT was included            Issued S$50m of 3.95%           Refinanced S$250m           Issued S$30m of 4.10%              Entered into S$250m            Established S$500m
                                                                                         Club Loan,                   fixed rate notes due 2020           IRS and reduced all-in          Multi-currency MTN
                          as a constituent of           fixed rate notes due
                          the first SGX                 2023                             unencumbering S$1.1b        Issued S$100m of 3.50%
                                                                                                                                                          cost of debt                    Programme
                          Sustainability               Entered into S$100m
                                                                                         of assets                    fixed rate notes due 2018          Refinanced S$100m of           Issued S$50m of 4.75%
                          Leaders Index                 unsecured loan facility         Issued S$55m of 3.50%       Won prestigious Solar
                                                                                                                                                          term loan facility and          fixed rate notes
                         Completed                    Published first
                                                                                         fixed rate notes due         Pioneer Award at the Asia
                                                                                                                                                          S$50m of revolving
                                                                                                                                                          credit facility
                                                                                                                                                                                         Established S$40m
                          refinancing of NAB                                             2018 and S$130m of           Clean Energy Summit                                                 revolving credit facility
                          loan facility,
                                                        Sustainability Report,
                                                        one of the first few
                                                                                         3.95% fixed rate notes       from EDB Singapore                 Refinanced and                 Increased existing
                          unencumbering                                                  due 2020                                                         converted S$120m of
                                                        companies in                                                                                                                      S$320m term loan
                          100% of portfolio             Singapore to do so              Won the Adam Smith                                               acquisition term loan to        facility with S$100m
                                                                                                                                                          S$100m loan facility
                         Updated S$500m               Completed the
                                                                                         Asia Award for Best
                                                                                         Financing Solution in
                                                                                                                                                                                          short term loan facility
                                                                                                                                                                                          and S$50m revolving
                          Multi-currency MTN            notification process with
                          programme to                                                   2015                                                                                             credit facility
                                                        JFSA, the first S-REIT
                          S$750m                        to do so

                                                                 2017                                                                          2018                                        Present
                                           e-Shang Redwood                 Issued S$150m of 4.6%                   Awarded Best Corporate            Announced Proposed
                                            acquires c.80% indirect          subordinated perpetual                   Governance Company,                Merger with VIT
                                            stake in Manager from
                                            NAB and Oxley (remaining
                                                                             securities as part of the
                                                                             S$750m Multicurrency
                                                                                                                      Singapore at Global
                                                                                                                      Banking & Finance Awards
                                                                                                                                                        Announced Proposed
                                                                                                                                                         Acquisition of 15
                                            20% in Manager held by           MTN programme                            2017                               Greenwich Drive, a
                                            Mitsui), and c.12% of REIT
                                            units, becoming REIT’s
                                                                                                                     Announced the launch of a          modern multi-tenanted
                                                                                                                      non-renounceable                   ramp-up logistics facility
                                            second largest unitholder                                                 preferential offering on the                                            Corporate Actions
                                           Cambridge Industrial Trust                                                basis of 199 new units for
                                            changes its name to “ESR-                                                 every 1,000 existing units                                              Awards and Achievements
                                            REIT”                                                                     to raise gross proceeds of
                                                                                                                      up to c.S$141.9m                                                        Capital Management

                                                                                                                                                                                                                      30
1Q2018 Financial Results
                                                                                                        1Q2018                          1Q2017                             QoQ
                                                                                                      (S$ million)                    (S$ million)                         (%)

Gross Revenue (1)(3)                                                                                         33.6                           27.7                            21.2

Net Property Income (2)(3)                                                                                   23.8                           19.7                            20.8

Amount Available for Distribution to:                                                                        15.1                           13.1

- Perpetual Securities Holders                                                                                1.7                               -                           n.m

- Unitholders (4)                                                                                            13.4                           13.1                             2.4

Distribution Per Unit (“DPU”) (cents)                                                                     0.847(5)                         1.004                          (15.6)

Adjusted DPU (cents)                                                                                      1.008(6)                         1.004                             0.4

Note:
(1) Includes straight line rent adjustment of S$0.4 million (1Q2018: S$0.2 million).
(2) Higher Net Property Income (“NPI”) mainly due to full quarter contributions from two acquisitions (8TS and 7000 AMK) in mid December 2017, partially offset by non renewal of leases at
    12 AMK, 31 KT and 30 TG, lease conversion of 21B Senoko Loop (1Q2018) and 3PS3 (3Q2017) and 4 property divestments (87 Defu, 23WT, 55 Ubi and 9BB) since 1Q2017.
(3) Includes Non-Controlling Interest (“NCI”) of 20% of 7000 Ang Mo Kio Avenue 5 in 1Q2018.
(4) Higher distributable income to Unitholders due to better NPI performance of the portfolio as per (2).
(5) Lower DPU due to dilution from new units issued pursuant to the Preferential Offering (262.8 million units) and Distribution Reinvestment Plan (“DRP”) units issued since 1Q2017.
(6) Adjusted DPU is based on the weighted average number of units in issue during 1Q2018 (assumes the units issued under the Preferential Offering were only entitled to distributable
    income from 28 March to 31 March 2018).

                                                                                                                                                                                          31
Comparison of Key Metrics Across Time
             Distributable Income (S$m)                               DPU (cents)                                      Gearing (%)
                                                                                                  Adjusted to
                                                                                Dilution from
                               13.4          13.4                               new units
                                                                                                  reflect
                                                                                issued from
                                                                                                  weighted                                                    45% regulatory limit
                                                                                                  average
                                                                                Preferential
                                                                                                  number of
                 13.1                                                           Offering and
                                                                                                  units issued
                                                                                DRP                                                                      Low gearing allows
 1Q17                                                                 1.004                       1.008                                                  for c.S$458.2m debt
                                                                                                                               37.8%                     headroom
                                                                                     0.847
  vs
 1Q18                                                                                                                                                30.0%

                1Q17          1Q18        Adj 1Q18                   1Q17           1Q18(1) Adj 1Q18(2)                       1Q17            1Q18              Debt headroom

             Distributable Income (S$m)                               DPU (cents)                                       Gearing (%)
                                                                                Dilution from      Adjusted to
                                                                                                   reflect                                                     45% regulatory limit
                               13.4          13.4                               new units
                                                                                                   weighted
                                                                                issued from
                                                                                Preferential       average
                                                                                Offering and       number of
                                                                                                   units issued
                                                                                                                                                          c.S$458.2m
 4Q17                                                                           DRP

                                                                                                                                                          debt headroom
                                                                      0.929                        1.008                       39.6%
  vs            12.2
                                                                                     0.847

 1Q18
                                                                                                                                                       30.0%

               4Q17           1Q18       Adj 1Q18                     4Q17           1Q18 (1) Adj 1Q18 (2)                     4Q17            1Q18              Debt headroom

        Note:
        (1) Lower DPU due to dilution from new units issued pursuant to the Preferential Offering (262.8 million units) and DRP units issued since 1Q2017.
        (2) Adjusted DPU is based on the weighted average number of units in issue during 1Q2018 (assumes the units issued under the Preferential Offering were only   32
            entitled to distributable income from 28 March to 31 March 2018).
Balance Sheet Summary
                                                                                            As at 31 Mar 2018                 As at 31 Dec 2017
                                                                                                   (S$ million)                      (S$ million)
Investment Properties                                                                                         1,653.1(1)               1,675.8(1)
Other Assets                                                                                                           22.5                 20.0
Total Assets                                                                                                     1,675.6                 1,695.8
Total Borrowings (net of loan transaction costs)                                                                     500.0                 669.8
Other Liabilities                                                                                                      38.1                 35.4
Non-Controlling Interest                                                                                               60.6                 60.6
Total Liabilities                                                                                                    598.7                 765.8
Net Assets Attributable to:
- Perpetual Securities Holders                                                                                       152.8                 151.1
- Unitholders                                                                                                        924.1                 778.9
No. of Units Issued (million)                                                                                    1,583.7                 1,313.6
NAV Per Unit (cents)                                                                                                   58.4                 59.3

           Note:
           (1) Includes valuation of 7000 Ang Mo Kio Avenue 5 on a 100% basis, of which ESR-REIT has 80% economic interest.
                                                                                                                                               33
DPU Profile Over Last 5 Years
        From FY2013 - FY2015, headline DPU was higher
         ‒   Capital gains paid out and management fees paid in units
        Since FY2016, distributions has been based on earnings
         ‒   Narrowed gap between earnings per unit and DPU

        Conversion of STBs to MTBs has negatively impacted DPU in recent years
         ‒   Reduced revenue and increased property expenses

    Five-Year Distribution Per Unit (cents)
                4.976                5.004
                                                    4.793
Capital
Gains/                                                                  4.173
                                     4.390          4.425                         3.853
Management
Fees in units   3.630

  Base DPU

                 2013                2014           2015                2016      2017

                                                                                          34
Key Portfolio Statistics
                                                                                                                As at                 As at
                                                                                                    31 Mar 2018                31 Dec 2017

 Number of Properties                                                                                                47                  48

 Valuation (S$ million)                                                                                   1,652.2(1)              1,675.8(1)

 GFA (million sq ft)                                                                                                9.7                 9.9

 NLA (million sq ft)                                                                                                8.9                 9.0

 Weighted Average Lease Expiry (“WALE”) (years)                                                                     4.4                 4.3

 Weighted Average Land Lease Expiry (years)                                                                       33.5                 33.8

 Occupancy (%)                                                                                                 90.7(2)                 93.0

 Number of Tenants                                                                                                 194                 207

 Security Deposit (months)                                                                                          7.0                 7.0

            Note:
            (1) Includes valuation of 7000 Ang Mo Kio Avenue 5 on a 100% basis, of which ESR-REIT has 80% economic interest.
            (2) Excludes 31 Kian Teck Way which is being held for divestment.                                                                  35
Pro-active Asset Management
Pro-active Approach Targeted At Maximising Portfolio’s Return

 Active Asset Management                    Asset Enhancement
  Delivering quality                        Enhancement of assets’
   properties and customer                    marketability to stay current in
   service                                    changing market
  Operational efficiency                    Engagement with tenants to
   and cost management                        facilitate expansion needs
  Focus on tenant retention
   and effective marketing
  Adopting green practices
   and initiatives
                                                                                        Sustainability of income

                                                                                        Long-term stability to REIT

                                                                                        Optimise value of portfolio

                                                                                     
 Acquisitions                                       Divestments
  Improve overall quality of portfolio
                                                                                         Maximum returns to
                                                      Divestment of non-core
                                                       assets to optimise                unitholders
  Sourcing of overseas properties to
   strengthen portfolio’s diversification              unitholder value
   and resilience                                     Recycling of capital for
                                                       acquisition of higher-
                                                       yielding quality properties

                                                                                                                36
ESR-REIT Development Capabilities                                                                                                         Active Asset
                                                                                                                                          Management

Pro-active Team Focused on Delivering Customer-Focused Solutions

 Track record of acquiring strategic assets and managing
  built-to-suit development projects                                           Large
                                                                                         Development   Programming     Project and    Property
                                                                               scale
 Specifically address requirements of our clients and their                  complex     expertise    and planning       value      management
  projects                                                                                                             management
                                                                              projects
 Team of experienced professionals who pro-actively manage
  every aspect of the development to ensure we deliver quality
  results on time and on budget
 Sponsor ESR is a developer of built-to-suit warehousing and
  distribution facilities for leading global e-commerce
  companies

  The ESR-REIT Built-to-Suit Advantage:
     Customised purpose-built facility to suit end user requirements                              Built-to-Suit Projects
     Modern, innovative and sustainable solutions offered at market
      rents

     Maximising site and leased area efficency using best-in-class,
      industry standards in construction technology

     Capital recyling initiatives which support business growth, resources
      and technology

   Integrated ownership, development and management model with a
      focus on sustainable development

   Dedicated team of pro-active and experienced in-house
      professionals with focus on developing long-term customer
      partnerships

   Extensive client network with presence in key and developing
      markets
                                                                                                   AEI & Redevelopment
   Consultative design process with streamlined single point-of-contact

                                                                                                                                        37
Acquisitions in FY2017
 8 Tuas South Lane                                                                                                     7000 Ang Mo Kio Avenue 5(1)

                               Five detached factories, one 8-storey                                                                                        6-storey high-specifications production block
Description                    warehouse and four blocks of dormitory                                               Description
                                                                                                                                                            5-storey ancillary office block
                               buildings
                                                                                                                    Gross Floor Area                        1,073,233 square feet
Gross Floor Area               c.781,126 square feet
                                                                                                                    Net Lettable Area                       834,783 square feet
Remaining Land
                               c.36 years                                                                           Remaining Land
Tenure                                                                                                                                                      c.39 years
                                                                                                                    Tenure
Purchase
                               S$106.1 million                                                                      Purchase
Consideration                                                                                                                                               S$240.0 million(2) (80% interest)
                                                                                                                    Consideration
Independent
                               S$115.0 million                                                                      Independent
Valuation
                                                                                                                                                            S$303.0 million (100% basis)
                                                                                                                    Valuation
                               15 years for majority of the space (with Hyflux),
Lease Term
                               with built-in rental escalations                                                     Acquisition
                                                                                                                                                            14 December 2017
Acquisition                                                                                                         Completed
                               13 December 2017
Completed
                 Note:
                 (1)   Refers to an acquisition of 80% interest in 7000 AMK Pte. Ltd. (the “AssetCo”), which holds 100% of the leasehold interest in 7000 Ang Mo Kio Avenue 5 (“7000 AMK”, together the “Acquisition”)
                 (2)   Put and call options for the remaining 20% interest in AssetCo is exercisable by either party within a 12-month period. The purchase price for the remaining 20% interest in AssetCo will be no less
                       than S$60.0 million. Includes a shareholder’s loan of S$50.5 million to be provided to the AssetCo on completion. Excludes acquisition fee payable to the Manager of S$2.4 million, stamp duties of    38
                       approximately S$0.5 million and other transaction costs of approximately S$0.6 million. Estimated total cost of the acquisition is approximately S$243.5 million.
Larger and More Yield-Accretive Acquisitions
   Two acquisitions of
    c.S$346.1m conducted in                         Portfolio Valuation Over Time (S$billion)
    2017 boosted portfolio by
    >24%
                                                                                                                                                      2 asset
    ‒   7000 AMK acquisition                                                                                                                          acquisitions,
        (c.S$303m on a 100%                                                                                                                           aggregating
                                                                                                                                                      S$346.1m and
        basis) is REIT’s largest                                                                                                                      averaging
        acquisition since IPO                                                                                                                         S$173.1m each
                                                                                 4 asset
                                                                                 acquisitions              2 asset
   Facilitated by obtaining                                                     averaging                 acquisitions
                                                                                                                                                                  1.68
                                                                                 S$35.2m                   averaging
    General Mandate at 2017                                                                                S$13.6m(2)
                                                        4 asset                  each
    AGM                                                 acquisitions:
                                                                                                           each                                 +24%
    ‒ Demonstrates Unitholder                           averaging
                                                        S$23.2m(1)
      support for REIT’s growth                         each                                                    1.42
      strategy                                                                        1.37                                               1.35

   Acquisitions are larger in                               1.18
    size and yield-accretive,
    future acquisitions
    expected to be of similar
    nature                                                   2013                     2014                     2015                      2016                     2017

              Note:
              (1) Includes the S$15.0m acquisition of a 60% economic interest in 3 Tuas South Avenue 4. The asset’s remaining 40% stake was held by Oxley Projects Pte Ltd.
              (2) Includes the S$11.0m acquisition of remaining 40% economic interest in 3 Tuas South Avenue 4 from Oxley Projects Pte Ltd.
                                                                                                                                                                              39
ESR-REIT’s Competitive Strengths
             Leading Pan-Asian logistics real estate platform                                                                                     47 properties valued at S$1.65 billion(1)
              with >US$11.0bn AUM                                                                                                                  Strategically located in key industrial zones
             ESR has c.80% stake in the REIT Manager,                                                                                              across Singapore
              c.100% stake in Property Manager and a c.13%                                                                                         Proactive asset and lease management focus
              stake in the REIT                                                                                                                    Well-balanced portfolio with Single-Tenanted
               Demonstrates long-term commitment and                                                                                               Building conversions to Multi-Tenanted Buildings
                  alignment of interest                                              Strong &              Resilient &                             Diversified Portfolio: No individual trade sector
             Co-founded by Warburg Pincus and backed by                                                                                            accounts for >13.6% of rental income
                                                                                     Committed             Balanced
              blue-chip institutional ownership and investors                                                                                      Healthy occupancy rate of 90.7%(2)
                                                                                     Sponsor               Portfolio                               Healthy Portfolio WALE of 4.4 years
             Provides ESR-REIT with development expertise
              and extensive network access to strong regional                                                                                      Leases backed by 7 months security deposits
              tenant base                                                                                                                          Built-in rental escalations provide organic
                                                                                                                                                    growth

                                                                                             6              1
   Close to 70 years of collective experience in local
    and regional real estate companies and financial             Experienced                                                 Diversified                Extensive network of 194 tenants
    institutions                                                 Management                                                  Tenant                     Diversified across industries including: Logistics,
     In-depth knowledge, proven track record and                Team                                                        Network                     Wholesale Trade, General Storage, Fabrication
         capabilities in Real Estate market, with focus in                            5                             2                                    and Electronics
         industrial property sector                                                                                                                     Top 10 tenants account for 42.9% of rental
   Members have played key roles in the shaping and                                                                                                     income
    management of successful REITs in Singapore                                                                                                         Long lease terms of 3-15 years provide
                                                                                                                                                         stability for Unitholders, with in-built escalation
                                                                                             4              3                                           70.7% tenant retention rate

           Proactively conducting AEI Initiatives to optimize
                                                                                                                  Prudent
            asset returns
                                                                          Active                                  Capital and
           Established track record of acquiring strategic               Asset                                   Risk
            assets and managing build-to-suit (“BTS”)                     Management                              Management                        Stable and secure income stream supported by
            development projects                                                                                                                     prudent capital and risk management
           In-house expertise to specifically address the                                                                                            Staggered debt maturity profile; no
            requirements of clients and their projects                                                                                                  refinancing until 4Q2018
           Experienced and flexible team to pro-actively                                                                                             92.6% of interest rates fixed
            manage projects                                                                                                                           100% of assets unencumbered
           Sponsor ESR has proven track record of                                                                                                  Diversified sources of funding, with alternative
            developing BTS warehousing and distribution                                                                                              pools of capital
            facilities for leading global e-commerce companies

                                 Note:
                                 (1) Includes valuation of 7000 Ang Mo Kio Avenue 5 on a 100% basis, of which ESR-REIT has 80% economic interest.
                                 (2) Excluding 31 Kian Teck Way that is being held for divestment.                                                                                                40
ESR-REIT Portfolio Details
                  Asset type              General Industrial                            Asset type               General Industrial                      Asset type               General Industrial
                  Valuation (S$m)         S$22.0m                                       Valuation (S$m)          S$17.2m                                 Valuation (S$m)          S$37.5m
                  Term of lease (years)   60.0/60.0                                     Term of lease (years)    60.0                                    Term of lease (years)    28.0
                 Remaining term of                                                      Remaining term of                                                Remaining term of
                                          43.2/47.9                                                              37.8                                                             17.2
                 lease (years)                                                          lease (years)                                                    lease (years)
                 NLA (sqft)               125,870                                       NLA (sqft)               96,625                                  NLA (sqft)               245,172
1/2 Changi North Lease type               Master Lease               11 Woodlands       Lease type               Master Lease         15 Jurong Port     Lease type               Master Lease
Street 2                                                             Walk                                                             Road

                  Asset type              General Industrial                            Asset type               General Industrial                      Asset type              General Industrial
                  Valuation (S$m)         S$18.2m                                       Valuation (S$m)          S$36.1m                                 Valuation (S$m)         S$26.4m
                  Term of lease (years)   27.0                                          Term of lease (years)    60.0                                    Term of lease (years)   60.0
                  Remaining term of                                                     Remaining term of                                                Remaining term of
                                          22.8                                                                   41.0                                                            35.1
                  lease (years)                                                         lease (years)                                                    lease (years)
                  GFA (sqft)              86,075                                        NLA (sqft)               217,351                                 NLA (sqft)              195,823
160A Gul Circle   Lease type              Master Lease               2 Tuas South       Lease type               Master Lease         21B Senoko         Lease type              Master Lease
                                                                     Ave 2                                                            Loop
                  Asset type              General Industrial                             Asset type              General Industrial                      Asset type              General Industrial
                  Valuation (S$m)         S$14.5m                                        Valuation (S$m)         S$16.3m                                 Valuation (S$m)         S$13.7m
                  Term of lease (years)   30.0                                           Term of lease (years)   58.0                                    Term of lease (years)   60.0
                  Remaining term of                                                      Remaining term of                                               Remaining term of
                                          17.7                                                                   49.1                                                            22.0
                  lease (years)                                                          lease (years)                                                   lease (years)
                  NLA (sqft)              120,653                                        NLA (sqft)              76,003                                  NLA (sqft)              159,338
22 Chin Bee       Lease type              Master Lease               25 Pioneer          Lease type              Master Lease         28 Senoko Drive    Lease type              Master Lease
Drive                                                                Crescent

                  Asset type              General Industrial                             Asset type              General Industrial                      Asset type              General Industrial
                  Valuation (S$m)         S$17.5m                                        Valuation (S$m)         S$42.9m                                 Valuation (S$m)         S$12.0m
                  Term of lease (years)   60.0                                           Term of lease (years)   60.0                                    Term of lease (years)   60.0
                  Remaining term of                                                      Remaining term of                                               Remaining term of
                                          37.8                                                                   41.4                                                            37.2
                  lease (years)                                                          lease (years)                                                   lease (years)
                  NLA (sqft)              131,859                                        NLA (sqft)              315,522                                 NLA (sqft)              59,697
28 Woodlands      Lease type              Master Lease               3 Tuas South        Lease type              Master Lease         31 Changi South    Lease type              Master Lease
Loop                                                                 Ave 4                                                            Ave 2

                  Asset type               General Industrial                            Asset type              General Industrial                      Asset type               General Industrial
                  Valuation (S$m)          S$5.7m                                        Valuation (S$m)         S$16.0m                                 Valuation (S$m)          S$15.0m
                  Term of lease (years)    49.0                                          Term of lease (years)   30.0                                    Term of lease (years)    29.5
                  Remaining term of                                                      Remaining term of                                               Remaining term of
                                           24.7                                                                  20.1                                                             19.8
                  lease (years)                                                          lease (years)                                                   lease (years)
                  NLA (sqft)               33,088                                        NLA (sqft)              122,836                                 NLA (sqft)               98,864
31 Kian Teck      Lease type               Master Lease              43 Tuas View        Lease type              Master Lease         5/7 Gul Street 1   Lease type               Master Lease
Way                                                                  Circuit

                           Source: Company filings. Portfolio statistics as at 31 Dec 2017.
                                                                                                                                                                                                 41
ESR-REIT Portfolio Details
                    Asset type              General Industrial                               Asset type              General Industrial                     Asset type              General Industrial
                    Valuation (S$m)         S$4.0m                                           Valuation (S$m)(1)      S$115.0m                               Valuation (S$m)(1)      S$10.2m
                    Term of lease (years)   30.0                                             Term of lease (years)   46.0                                   Term of lease (years)   60.0
                    Remaining term of                                                        Remaining term of                                              Remaining term of
                                            17.2                                                                     36.3                                                           40.6
                    lease (years)                                                            lease (years)                                                  lease (years)
                    NLA (sqft)              44,675                                           NLA (sqft)              768,201                                NLA (sqft)              71,581
60 Tuas South       Lease type              Master Lease                 8 Tuas South        Lease type              Master Lease         9 Tuas View       Lease type              Master Lease
Street 1                                                                 Lane                                                             Crescent
                    Asset type              General Industrial                               Asset type              General Industrial                   Asset type                General Industrial
                    Valuation (S$m)         S$40.6m                                          Valuation (S$m)(1)      S$36.6m                              Valuation (S$m)(1)        S$12.1m
                    Term of lease (years)   58.0                                             Term of lease (years)   60.0                                 Term of lease (years)     60.0
                    Remaining term of                                                        Remaining term of                                            Remaining term of
                                            37.2                                                                     31.9                                                           37.7
                    lease (years)                                                            lease (years)                                                lease (years)
                    NLA (sqft)              219,331                                          NLA (sqft)              175,747                              NLA (sqft)                63,530
120 Pioneer         Lease type              Multi-Tenanted               30 Marsiling        Lease type              Multi-Tenanted       45 Changi South Lease type                Multi-Tenanted
Road                                                                     Industrial Estate                                                Ave 2
                                                                         Road 8
                    Asset type              General Industrial                               Asset type              General Industrial                     Asset type              General Industrial
                    Valuation (S$m)         S$26.1m                                          Valuation (S$m)(1)      S$43.0m                                Valuation (S$m)(1)      S$11.0m
                    Term of lease (years)   59.0/60.0                                        Term of lease (years)   60.0                                   Term of lease (years)   60.0
                    Remaining term of                                                        Remaining term of
                                            36.4/35.9                                                                37.0                                   Remaining term of
                    lease (years)                                                            lease (years)                                                                          42.1
                                                                                                                                                            lease (years)
                    NLA (sqft)              200,562                                          NLA (sqft)              237,229                                NLA (sqft)              67,942
511/513 Yishun      Lease type              Multi-Tenanted               86/88               Lease type              Multi-Tenanted
                                                                                                                                          79 Tuas South     Lease type              -
Industrial Park A                                                        International Rd
                                                                                                                                          Street 5

                    Asset type              Light Industrial                                 Asset type              Light Industrial                       Asset type              Light Industrial
                    Valuation (S$m)         S$60.5m                                          Valuation (S$m)(1)      S$38.9m                                Valuation (S$m)(1)      S$9.2m
                    Term of lease (years)   60.0                                             Term of lease (years)   32.0                                   Term of lease (years)   30.0
                    Remaining term of                                                        Remaining term of                                              Remaining term of
                                            49.5                                                                     21.4                                                           23.8
                    lease (years)                                                            lease (years)                                                  lease (years)
                    NLA (sqft)              215,666                                          NLA (sqft)              139,525                                NLA (sqft)              53,729
16 Tai Seng         Lease type              Master Lease                 30 Teban            Lease type              Master Lease         70 Seletar        Lease type              Master Lease
Street                                                                   Gardens Crescent                                                 Aerospace View
                    Asset type              Light Industrial                                 Asset type              Light Industrial                       Asset type               Light Industrial
                    Valuation (S$m)         S$20.0m                                          Valuation (S$m)(1)      S$12.0m                                Valuation (S$m)(1)       S$15.6m
                    Term of lease (years)   60.0                                             Term of lease (years)   60.0                                   Term of lease (years)    60.0
                    Remaining term of                                                        Remaining term of                                              Remaining term of
                                            39.3                                                                     34.4                                                            33.9
                    lease (years)                                                            lease (years)                                                  lease (years)
                    NLA (sqft)              112,601                                          NLA (sqft)              73,407                                 NLA (sqft)               89,626
11 Serangoon        Lease type              Multi-Tenanted               128 Joo Seng        Lease type              Multi-Tenanted       130 Joo Seng      Lease type               Multi-Tenanted
North Ave 5                                                              Road                                                             Road

                              Source: Company filings. Portfolio statistics as at 31 Dec 2017.
                                                                                                                                                                                                  42
ESR-REIT Portfolio Details
                  Asset type               Light Industrial                                Asset type                Light Industrial                        Asset type               Logistics & Warehouse
                  Valuation (S$m)(1)       S$12.8m                                         Valuation (S$m)           S$59.7m                                 Valuation (S$m)          S$11.7m
                  Term of lease (years)    60.0                                            Term of lease (years)     60.0                                    Term of lease (years)    30.0
                  Remaining term of                                                        Remaining term of                                                 Remaining term of
                                           32.8                                                                      37.6                                                             14.0
                  lease (years)                                                            lease (years)                                                     lease (years)
                  NLA (sqft)               78,189                                          NLA (sqft)                292,944                                 NLA (sqft)               114,111
136 Joo Seng      Lease type               Multi-Tenanted            30 Toh Guan           Lease type                Multi-Tenanted         1 3rd Lok Yang   Lease type               Master Lease
Road                                                                 Road                                                                   Rd & 4 4th Lok
                                                                                                                                            Yang Rd
                  Asset type               Logistics & Warehouse                           Asset type               Logistics & Warehouse                    Asset type               Logistics & Warehouse
                  Valuation (S$m)(1)       S$26.8m                                         Valuation (S$m)          S$12.5m                                  Valuation (S$m)          S$12.3m
                  Term of lease (years)    60.0                                            Term of lease (years)    60.0                                     Term of lease (years)    60.0
                  Remaining term of                                                        Remaining term of                                                 Remaining term of
                                           15.1                                                                     36.8                                                              36.3
                  lease (years)                                                            lease (years)                                                     lease (years)
                  NLA (sqft)               322,604                                         NLA (sqft)               72,998                                   NLA (sqft)               75,579
160 Kallang Way   Lease type               Master Lease              25 Changi South       Lease type               Master Lease                             Lease type               Master Lease
                                                                                                                                            31 Tuas Ave 11
                                                                     Ave 2
                  Asset type               Logistics & Warehouse                           Asset type               Logistics & Warehouse                    Asset type               Logistics & Warehouse
                  Valuation (S$m)(1)       S$89.4m                                         Valuation (S$m)          S$95.7m                                  Valuation (S$m)          S$29.7m
                  Term of lease (years)    42.0                                            Term of lease (years)    60.0                                     Term of lease (years)    60.0
                  Remaining term of                                                        Remaining term of                                                 Remaining term of
                                           19.2                                                                     33.0                                                              33.1
                  lease (years)                                                            lease (years)                                                     lease (years)
                  NLA (sqft)               737,817                                         NLA (sqft)               645,499                                  NLA (sqft)               172,323
24 Jurong Port    Lease type               Multi-Tenanted            3 Pioneer Sector      Lease type               Multi-Tenanted          3C Toh Guan      Lease type               Multi-Tenanted
Road                                                                 3                                                                      Road East

                  Asset type                Logistics & Warehouse                         Asset type               Hi-Specs Industrial                        Asset type               Hi-Specs Industrial
                  Valuation (S$m)(1)        S$48.1m                                       Valuation (S$m)          S$29.7m                                    Valuation (S$m)          S$38.9m
                  Term of lease (years)     60.0                                          Term of lease (years)    99.0                                       Term of lease (years)    60.0
                  Remaining term of                                                       Remaining term of                                                   Remaining term of
                                            35.8                                                                   39.0                                                                32.8
                  lease (years)                                                           lease (years)                                                       lease (years)
                  NLA (sqft)                255,560                                       NLA (sqft)               74,064                                     NLA (sqft)               166,124
4/6 Clementi      Lease type                Multi-Tenanted           11 Chang Charn       Lease type               Multi-Tenanted           12 Ang Mo Kio     Lease type               Multi-Tenanted
Loop                                                                 Road                                                                   Street 65

                   Asset type               Hi-Specs Industrial                       Asset type                   High-Specs Industrial                      Asset type                Hi-Specs Industrial
                   Valuation (S$m)(1)       S$26.9m                                   Valuation (S$m)              S$35.6m                                    Valuation (S$m)           S$22.3m
                   Term of lease (years)    99.0                                      Term of lease (years)        60.0                                       Term of lease (years)     60.0
                   Remaining term of                                                  Remaining term of                                                       Remaining term of
                                            44.5                                                                   39.1                                                                 38.5
                   lease (years)                                                      lease (years)                                                           lease (years)
                   NLA (sqft)               67,667                                    NLA (sqft)                   148,055                                    NLA (sqft)                116,761
2 Jalan Kilang                                                                                                     Multi-Tenanted           54 Serangoon      Lease type                Multi-Tenanted
                   Lease type               Multi-Tenanted           21/23 Ubi Road 1 Lease type
Barat                                                                                                                                       North Ave 4

                            Source: Company filings. Portfolio statistics as at 31 Dec 2017.
                                                                                                                                                                                                     43
ESR-REIT Portfolio Details
                  Asset type              Hi-Specs Industrial                      Asset type              Business Park
                  Valuation (S$m)         S$303.0m(1)                              Valuation (S$m)         S$31.3m
                  Term of lease (years)   62.0                                     Term of lease (years)   60.0
                  Remaining term of                                                Remaining term of
                                          39.1                                                             38.6
                  lease (years)                                                    lease (years)
                  NLA (sqft)              834,783                                  NLA (sqft)              69,258
7000 Ang Mo Kio   Lease type              Multi-Tenanted        16 International   Lease type              Master Lease
Ave 5                                                           Business Park

                     Source: Company filings. Portfolio statistics as at 31 Dec 2017.
                     Note:
                                                                                                                               44
                     (1) Valuation of 7000 Ang Mo Kio Avenue 5 on a 100% basis, of which ESR-REIT has 80% economic interest.
Important Notice
This material shall be read in conjunction with ESR-REIT’s results announcements for the financial period ended 31 March 2018.

Important Notice

The value of units in ESR-REIT (“Units”) and the income derived from them may fall as well as rise. Units are not investments or deposits in, or liabilities or
obligations, of ESR Funds Management (S) Limited ("Manager"), RBC Investor Services Trust Singapore Limited (in its capacity as trustee of ESR-REIT)
("Trustee"), or any of their respective related corporations and affiliates (individually and collectively "Affiliates"). An investment in Units is subject to equity
investment risk, including the possible delays in repayment and loss of income or the principal amount invested. Neither ESR-REIT, the Manager, the
Trustee nor any of the Affiliates guarantees the repayment of any principal amount invested, the performance of ESR-REIT, any particular rate of return from
investing in ESR-REIT, or any taxation consequences of an investment in ESR-REIT. Any indication of ESR-REIT performance returns is historical and
cannot be relied on as an indicator of future performance.

Investors have no right to request that the Manager redeem or purchase their Units while the Units are listed. It is intended that investors may only deal in
their Units through trading on Singapore Exchange Securities Trading Limited (the “SGX-ST”). Listing of the Units on the SGX-ST does not guarantee a liquid
market for the Units.

This material may contain forward-looking statements that involve assumptions, risks and uncertainties. Actual future performance, outcomes and results
may differ materially from those expressed in forward-looking statements as a result of a number of risks, uncertainties and assumptions. Representative
examples of these factors include (without limitation) general industry and economic conditions, interest rate trends, cost of capital and capital availability,
competition from similar developments, shifts in expected levels of occupancy or property rental income, changes in operating expenses (including employee
wages, benefits and training costs), governmental and public policy changes and the continued availability of financing in amounts and on terms necessary to
support future ESR-REIT business. You are cautioned not to place undue reliance on these forward-looking statements, which are based on the Manager’s
current view of future events.

This material is for informational purposes only and does not have regard to your specific investment objectives, financial situation or your particular needs.
Any information contained in this announcement is not to be construed as investment or financial advice, and does not constitute an offer or an invitation to
invest in ESR-REIT or any investment or product of or to subscribe to any services offered by the Manager, the Trustee or any of the Affiliates.

                                                                                                                                                                  45
You can also read