Fund Fact Sheet Unit Linked Insurance Plans - Individual policyholders June 2020 - IndiaFirst Life Insurance
←
→
Page content transcription
If your browser does not render page correctly, please read the page content below

Fund Fact Sheet
   Unit Linked Insurance Plans – Individual policyholders
   June 2020

Disclaimer: Past performance may or may not be sustained in future and is not a guarantee of future performance. Some of the contents of this document
may contain statements / estimates / expectations / predictions, which may be 'forward looking'. The actual outcomes could differ materially from those
expressed /implied in this document. These statements, do not intend to provide personal recommendation to any specific individual or any investment
needs of an individual. The recommendations / statements / estimates / expectations / predictions are of general in nature and may not take into account
the specific investment needs or risk appetite or financial situations of individual clients. Therefore, before acting on any advice or recommendations
contained in this document, readers, in their own interest, should consider seeking advice from any authorized and professional investment advisors or
financial consultants.’
MarketFirst Monthly Report
June 2020
Indian equity market indices rose sharply during the month Crude Oil prices rose, continuing its comeback from record lows mainly
outperforming most global markets. Market rally was driven by led by output cuts. Gold prices continued to rise, driven by safe haven
optimism surrounding opening of the economy post easing of the demand.
lockdown measures and the continued economic support provided
Domestically, geopolitical tensions rose as the Indo-China military
by the government and central bank. Fixed income markets
stand- off continued along the Line of Actual Control (LAC) near
remained rangebound during the month.
Eastern Ladakh. Government of India also banned certain Chinese
Below are some key pointers which impacted the markets during apps citing cybersecurity concerns.
the month: Government initiated the process of phased opening of the economy
• Central Government began the process of ‘unlock down’ i.e. phase known as ‘unlock down’. Key economic data such industrial production,
wise opening of the economy. core sector data (for May) & manufacturing PMI remained subdued,
reflecting the economic impact of the lockdown measures to combat
• India-China border tensions intensified amid military standoff along
the virus spread. The future trajectory of economic data continues to
the Line of Actual Control (LAC) in Eastern Ladakh.
remain uncertain. RBI announced open market operations (OMO) of
• Credit Rating Agency Moody’s downgraded India’s sovereign credit government securities whereby it aims simultaneous purchase and
rating by one notch and maintained their negative outlook. sale of government securities of different tenors.
• Key economic parameters such as factory output (IIP de-growth of With regards to the institutional flows, FPI were net buyers of equities
55.5 percent in April vs de-growth 16.7 percent in March), (cash market) worth INR 18684 Cr (USD 2473 Mn) and sellers of debt
manufacturing PMI (PMI of 47.2 in June vs 30.8 in May) have been worth INR 1714 Cr (USD 226 Mn). DIIs were buyers of equities worth
reflecting the economic impact of COVID 19 outbreak. Meanwhile, INR 2434 Cr (USD 320 Mn).
the headline retail inflation data wasn’t released given limited
availability of data.
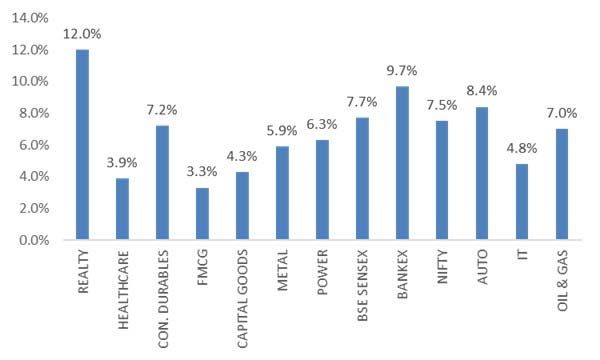
Performance of Sectoral indices during June 2020
Movement / Trends in key market variables:
Present Price Change
Particulars
Level 3M 6M 1 Year
Generic 1st 'CO' Future 41.15 80.96% -37.65% -38.17%
Gold Spot $/Oz 1780.96 12.92% 17.38% 26.35%
Indian Rupee Spot 75.5075 -0.16% 5.78% 9.39%
MSCI EM 995.1 17.27% -10.73% -5.67%
MSCI WORLD 2201.79 18.84% -6.64% 1.08%
Nifty 50 10302.1 19.82% -15.34% -12.61%
Equity Market Valuation:
Sensex @ 34915 FY20 FY21E FY22E
EPS 1640 1660 2160
PE 21.3 21 16.2
Source: Select Brokerage Estimates.
Market Outlook:
Debt Market Data Points:
Equity Market Outlook:
Present Basis Point Change
Particulars
Level (%) 3M 6M 1 Year At current levels of 34915, SENSEX is trading at 21.3x trailing 12-
India 10 year bond yield 5.88 (25) (67) (99)
month earnings of INR 1640.
Over the past few years, market rally had been primarily driven by
AAA – 10 year Spread 1.17 (20) 9 (1) multiple expansion without accompanying earnings growth. COVID-19
Spread (India 10 year – US acted as a trigger for the expensive valuations to correct and mean
5.22 (23) 59 35
10 year) revert. Based on historical data (past 20-years) for the domestic
markets, PE multiple greater than 21x has been considered as
Market Overview: expensive and the markets had been hovering in that zone for past 3-4
years. Despite the recent rebound, the markets are down ~15 percent
Global equity markets continued to rise during the month even as from the peak.
COVID-19 infections mounted in some geographies such as the US &
certain emerging markets. Market participants remained focused on Some of sectors such as (BFSI, Auto, Consumer Durables), which
economic indicators post easing of the lockdown measures, looking for were trading at stretched valuation multiples, bore the brunt of the fall.
signs of an early economic rebound. Governments and global central Historically, post such a tectonic shift, new sectors typically emerge as
banks continued to provide fiscal and liquidity support. Macroeconomic market leaders. Considering the above, some sectors such as rural,
data was mixed as retail sales in the US rose sequentially where US consumption themes (Select FMCG and Agri), IT and utilities have
jobless claims rose (topping 47 million in last fourteen weeks) and the favourable risk-reward.
unemployment rate for May came at ~13 percent.Going ahead, growth revival would be dependent on how the un- To remain accommodative on the policy side to revive growth, RBI in its
lockdown evolves. There remains considerable uncertainty since policy announced in May 20 cut repo rates by 40 bps and announced
COVID-19 infections continue to rise and in the absence of any vaccine several measures to support economy in the light of COVID 19
approval till date, could lead to further social distancing measures. This pandemic effect of lockdowns. RBI in the last week of June 20
could have a lasting economic impact. Some other risks such as trade conducted a special OMO of simultaneous purchase and sale of
war & geo political tensions continue to linger. In the interim, impact of Government securities. All these measures along with the measures
the recent policy responses, reopening of supply chain linkages, announced in the previous months would help the yields remain soft in
corporate earnings trajectory / shock and crude / commodity price the near future.
trajectory would also be keenly watched.
Government of India post announcement of a comprehensive package
Considering the risks looming on the horizon and the uncertain of Rs. 1.70 lakh crores in March 2020, which covered cash transfers
trajectory of economic growth in the near term, market correction and food security for vulnerable sections of society including farmers,
cannot be ruled out from current levels. Increase in market volatility can migrant workers, urban and rural poor extended the food security
also be expected but it could also provide attractive opportunities to measures till end of November 2020 indicating additional expenditure of
accumulate quality stocks. A gradual increase in allocation towards around 90000 Crores. This is in addition to the fiscal stimulus package
equity can be considered with a 3 – 5 year perspective. Equity as an of Rs. 20 Lakh crores announced in the previous month with the focus
asset class has proven its ability to deliver superior returns in the long on providing support to MSMEs and also NBFCs that have been hit
term. hard by the lock downs.
The rupee has been range bound throughout the month reaching the
Debt Market Outlook: levels of Rs. 76.21 to close at the levels of Rs. 75.56 by month end.
The 10-year G-Sec yields closed at the levels of 5.99% against the The Indian Debt markets have experienced huge FPI outflows in the
previous month close of 6.01%. The bond yields were range bound last 3-4 months as a result of heightened fears of coronavirus induced
throughout the month post announcement of RBI policy on May 22, global recession. With FPIs opting for withdrawal from riskier
2020. The new 10-year G-Sec issued by RBI, with an cut off yield of investment destinations and investment in safe heavens of dollar driven
5.79% in May 2020 closed at the levels of 5.89% as on June 30, 2020. assets.
Growth outlook for economic activity is expected to remain depressed in With systemic liquidity likely to remain in surplus post implementation of
H1 2021 with recovery expected only in the second half of the year 20. RBI’s measures we expect bond yields to remain soft in the near term.
RBI gave directional guideline on the inflation than giving a specific RBI is also likely to continue with its measures to ease liquidity in the
level with availability of limited data for the month of April 20, indicating market. The only concern for the market could be front loading and
that the headline inflation might ease in the second half of the year once increase in the borrowings announced by the Government which might
the agriculture supply chains get restored in the coming months with lead to moving the rates higher.
gradual relaxation of lockdown. Core inflation is likely to ease further
Keeping a close watch on the economic data points and the factors
due to lower demand as a result of impact on the consumer sentiment.
discussed above, we have marginally increased the duration in our
Debt Funds and will continue to remain invested in the medium
segment of the yield curve in the present scenario mostly in sovereign
and AAA corporate bonds only.
Disclaimer
Some of the contents of this document may contain statements/ estimates/ expectations/ predictions, which may be 'forward looking'. The actual outcomes could
differ materially from those expressed / implied in this document. These statements, do not intend to provide personal recommendation to any specific individual or
any investment needs of an individual. The recommendations/ statements/ estimates/ expectations / predictions are of general in nature and may not take into
account the specific investment needs or risk appetite or financial situations of individual clients. Therefore, before acting on any advice or recommendations
contained in this document, readers, in their own interest, should consider seeking advice from any authorized and professional investment advisors or financial
consultants.' The above data has been generated from sources in public domain. IndiaFirst Life Insurance Company Limited. IRDAI Reg. No. 143. Address:
12th/13th Floor, North [C] Wing, Tower 4, NESCO IT Park, Nesco Center Western Express Highway, Goregaon (East), Mumbai - 400 063. CIN:
U66010MH2008PLC183679.Fund Manager’s Comments June 2020 Fund Manager's Comments on Debt Portfolio The 10 year G-Sec yields closed at the levels of 5.99% against the previous month close of 6.01%. The bond yields were range bound throughout the month post announcement of RBI policy on May 22, 2020. The new 10 year G-Sec issued by RBI, with an cut off yield of 5.79% in May 2020 closed at the levels of 5.89% as on June 30, 2020. To remain accommodative on the policy side to revive growth, RBI in its policy announced in May 20 cut repo rates by 40 bps and announced several measures to support economy in the light of COVID 19 pandemic effect of lockdowns. RBI in the last week of June 20 conducted a special OMO of simultaneous purchase and sale of Government securities. All these measures along with the measures announced in the previous months would help the yields remain soft in the near future. Growth outlook for economic activity is expected to remain depressed in H1 2021 with recovery expected only in the second half of the year 20. RBI gave directional guideline on the inflation than giving a specific level with availability of limited data for the month of April 20, indicating that the headline inflation might ease in the second half of the year once the supply lines get restored in the coming months with gradual relaxation of lockdown. Government of India post announcement of a comprehensive package of Rs. 1.70 lakh crores in March 2020, which covered cash transfers and food security for vulnerable sections of society including farmers, migrant workers, urban and rural poor extended the food security measures till end of November 2020 indicating additional expenditure of around 90000 Crores. This is in addition to the fiscal stimulus package of Rs. 20 Lakh crores announced in the previous month with the focus on providing support to MSMEs and also NBFCs that have been hit hard by the lock downs. International Oil prices have remained range bound throughout the month after falling by almost by around 60% since the start of 2020 on the concerns of demand. The rupee has been range bound throughout the month reaching the levels of Rs. 76.21 to close at the levels of Rs. 75.56 by month end. With systemic liquidity likely to remain in surplus post implementation of RBI’s measures we expect bond yields to remain soft in the near term. RBI is also likely to continue with its measures to ease liquidity in the market. Keeping a close watch on the economic data points and the factors discussed above, we have marginally increased the duration in our Debt Funds and will continue to remain invested in the medium segment of the yield curve in the present scenario mostly in sovereign and AAA corporate bonds only. Fund Manager's Comments on Equity Portfolio In the month of June 2020, the Indian headline indices ended on a positive note with the Sensex (+7.6%) and Nifty (+7.5%) outperforming other key global indices. The BSE Midcap (+10.2%) and BSE Smallcap (+13.6%) have outperformed the headline indices. Markets ended in green on the back of Governments directions to unlock in a phased manner, IMD forecast of normal monsoon and SC giving clarification on loan moratorium case. The markets were resilient for the month despite India-China face-off. On the Economy front, IIP growth plummeted by -55% in April-20 as against -18.3% in Mar-20 due to the implementation of nationwide lockdown. CPI food inflation moderated to 9.3% in May-20 as against 10.5% in April-20 led by softer vegetable prices. Key global indices have ended in green on the back of monetary measures by key central banks and improving economic activity. FPIs bought equity worth US$ 2.47 bn and DIIs bought equity worth US$ 0.32 bn in cash segment for the month. Globally, continuity in governments providing fiscal stimulus, gradual recovery in economic activity and geopolitical tensions across the globe including the rift between India-China would be the key factors in determining the market direction going ahead. On the domestic front significant uncertainties persist over the recovery of economy in the near term due to raising infection rates and continued social distancing norms. As the lockdown has resulted in income devastation, deterioration of corporate balance sheets and unemployment, the economic recovery is unlikely to be V-Shaped in the near term. Given the inherent uncertainties in the near term we would approach the markets with a cautious view and stick to companies which have stronger balance sheets. In light of the changing dynamics, we prefer rural & consumption themes (Select FMCG and Agri), IT and utilities to which we have realigned our portfolio. Going ahead, with the ever-changing dynamics we may take call on specific sector/companies.
Summary of performance of Funds vs. Benchmark (As on June 30, 2020)
Unit Linked Insurance Plans - Individual policyholders
                                                                                                                 Returns in %
Funds Name & Benchmark                                                                1 year               3 years     5 years       Since Inception

Equity Fund                                                                            -13.64                 -0.55           2.52        6.38
Benchmark (90% Nifty 50 Index & 10% Nifty 1 day Rate Index )                           -10.90                  2.95           4.41        6.83
Nifty 50 Index                                                                         -12.61                  2.66           4.24        6.84

Equity1 Fund                                                                           -12.51                 1.37            3.94        6.30
Benchmark (90% Nifty 50 Index & 10% Nifty 1 day Rate Index)                            -10.90                 2.95            4.41        6.03
Nifty 50 Index                                                                         -12.61                 2.66            4.24        5.93

Equity Pension Fund                                                                    -11.99                 1.60            4.28        7.26
Benchmark (90% Nifty 50 Index & 10% Nifty 1 day Rate Index)                            -10.90                 2.95            4.41        6.83
Nifty 50 Index                                                                         -12.61                 2.66            4.24        6.84

Equity Elite Opportunities                                                             -11.80                 0.98             -          3.14
Benchmark (60% Nifty 50 Index & 40% Nifty 1 day Rate Index)                             -5.76                 3.83             -          5.25
Nifty 50 Index                                                                         -12.61                 2.66             -          4.98

Index Tracker Fund                                                                     -11.77                 2.52            4.13        5.70
Benchmark (95% Nifty 50 Index & 5% Nifty 1 day Rate Index)                             -11.75                 2.81            4.33        5.76
Nifty 50 Index                                                                         -12.61                 2.66            4.24        5.70

Value Fund                                                                             -13.20                 -0.20           4.32        6.87
Benchmark (90% S&P BSE 100 Index & 10% Nifty 1 day Rate Index)                         -10.87                  2.22           4.40        5.91
S&P BSE 100 Index                                                                      -12.59                  1.85           4.22        5.79

Dynamic Asset Allocation Fund                                                           -5.51                 1.84            4.28        9.07
Benchmark (60% Nifty 50 Index, 10% Nifty 1 day Rate Index & 30%
                                                                                        -3.23                 4.69            5.86        8.45
NIFTY Composite Debt Index)

Balanced Fund                                                                           -5.96                 2.58            4.58        6.56
Benchmark (60% Nifty 50 Index, 10% Nifty 1 day Rate Index & 30%
                                                                                        -3.23                 4.69            5.86        7.29
NIFTY Composite Debt Index)

Balanced 1 Fund                                                                         -6.28                 2.54            4.49        6.21
Benchmark (60% Nifty 50 Index, 10% Nifty 1 day Rate Index & 30%
                                                                                        -3.23                 4.69            5.86        6.92
NIFTY Composite Debt Index)

Balanced Pension Fund                                                                   -2.75                 4.64            6.09        7.36
Benchmark (60% Nifty 50 Index, 10% Nifty 1 day Rate Index & 30%
                                                                                        -3.23                 4.69            5.86        7.29
NIFTY Composite Debt Index)

Debt Fund                                                                               7.63                  5.37            7.19        7.38
Benchmark (85% NIFTY Composite Debt Index & 15% Nifty 1 day Rate
                                                                                        11.69                 8.03            8.61        8.14
Index)

Debt1 Fund                                                                              8.30                  3.96            5.99        6.90
Benchmark (85% NIFTY Composite Debt Index & 15% Nifty 1 day Rate
                                                                                        11.69                 8.03            8.61        8.42
Index)

Debt Fund Pension                                                                       7.40                  5.50            7.12        7.24
Benchmark (85% NIFTY Composite Debt Index & 15% Nifty 1 day Rate
                                                                                        11.69                 8.03            8.61        8.14
Index)

Liquid Fund                                                                             2.90                  3.95            4.38        5.18
Benchmark (100% Nifty 1 day Rate Index)                                                 4.52                  5.58            5.96        6.72

Liquid Pension Fund                                                                     2.76                  3.70            4.15        5.30
Benchmark (100% Nifty 1 day Rate Index)                                                 4.52                  5.58            5.96        6.70

 Note:
 1. The above summary is based on the data as on June 30, 2020
 2. Equity Fund - Returns less than year are Absolute & Returns over one year are CAGR (Compound Annual Growth Rate)
 3. Debt Fund - Returns less than year are simple annualised & Returns over one year are CAGR (Compound Annual Growth Rate)
 4. Past performance may or may not be sustained in future and is not a guarantee of future performance
Funds at a Glance
Name of the Fund Equity Fund/Equity Pension Fund/Equity1 Fund Name of the Fund Balanced Fund/Balanced Pension Fund/Balance1 Fund
Nature of the Fund Equity Growth Fund - Primarily invested in equity Nature of the Fund Balanced Fund with exposure to equity and debt investments
To provide high growth opportunities with an objective of long To provide higher growth with reasonable security, by investing
Investment Objective term capital appreciation through investments primarily in equity Investment Objective primarily in equity instruments and moderate allocation in debt
and equity related instruments. securities/ bonds.
This Fund is positioned as a diversified equity fund with a This fund is positioned as a balanced mix of debt and equity, with
moderate exposure to mid-cap stocks. The aim of the Fund is to the asset allocation pattern providing a good opportunity to
provide a stable and sustainable relative out performance vis-à- provide consistent and sustainable returns. The equity portion will
vis the benchmark. The Fund will stick to the theme of discipline, have a highly diversified portfolio with high liquidity while the debt
Fund Positioning Fund Positioning
diligence and dividend yield while selecting equity stocks. The portion will comprise of high rated debt instruments with low to
Fund will have an exposure of upto 30 percent to mid-cap moderate liquidity. The asset allocation will follow a macro level
companies. The remaining exposure will continue to be in large- market scenario and the individual stock selection will be with
cap companies. micro level performance expectations of the stocks and securities.
Asset Allocation Equity Debt Money market Asset Allocation Equity Debt Money market
Minimum 80 0 0 Minimum 50 30 0
Maximum 100 0 20 Maximum 70 50 20
Chief Investment Officer Shri A.K.Sridhar, B.Sc, ACA Chief Investment Office Shri A.K.Sridhar, B.Sc, ACA
Fund Manager Viraj Nadkarni- Fund Manager Debt - Sandeep Shirsat - B.Com, ICWA
M.Com, C.S. ( Company Secretary), MBA ( Finance) Equity - Viraj Nadkarni
Date of Launch November 25, 2009 M.Com, C.S. ( Company Secretary), MBA ( Finance)
Net Asset Value Declared every business day
Fund's Fact Sheet Published monthly Date of Launch November 9, 2011
Benchmark Composition (90% Nifty 50 Index & 10% Nifty 1 day Net Asset Value Declared every business day
Benchmark
Rate Index) Fund's Fact Sheet Published monthly
Benchmark Composition (60% Nifty 50 Index, 10% Nifty 1 day
Benchmark
Rate Index & 30% NIFTY Composite Debt Index)
Name of the Fund Debt Fund/Debt Pension Fund/Debt1 Fund
Nature of the Fund Primarily invested in debt instruments
To generate a good level of income and prospects for capital
Name of the Fund Liquid Pension Fund
growth through diversified investment in corporate debt
Investment Objective
instruments, government securities and money market Nature of the Fund Investment in liquid and money market instruments
investments.
To provide capital protection with growth at short-term interest
Investment Objective
This fund is positioned as a pure debt oriented fund, with asset rates while providing a high level of liquidity.
allocation pattern providing a good opportunity to provide
consistent and sustainable returns. The debt portfolio will
comprise of high rated debt instruments with a low to moderate
liquidity, government securities and money market investments This Fund is positioned as a pure debt oriented short term liquid
Fund Positioning with very high safety and easy liquidity. The asset allocation fund with the asset allocation pattern giving a reasonable
between corporate debt and government securities/money market opportunity to provide consistent and sustainable returns, with
investments and the portfolio duration of the fund, will follow a very high liquidity. The investment portfolio will primarily comprise
Fund Positioning
macro level economic scenario while the individual corporate debt of high rated short term money market investments with very high
investments will follow with a micro level credit worthiness and safety and easy liquidity. The maturity profile and the portfolio
debt servicing capacity of companies. duration will follow a macro level economic scenario and the
expected liquidity needs of the fund.
Asset Allocation Equity Debt Money market
Minimum 0 70 0 Asset Allocation Equity Debt Money market
Maximum 0 100 30 Minimum 0 0 80
Chief Investment Officer Shri A.K.Sridhar, B.Sc, ACA Maximum 0 20 100
Head – Fixed Income Dr. Poonam Tandon Chief Investment Office Shri A.K.Sridhar, B.Sc, ACA
B.Com ( Hons.), PGDBM( XLRI, Jamshedpur) , CAIIB , Ph.D ( Financial Head – Fixed Income Dr. Poonam Tandon
Management)
B.Com ( Hons.), PGDBM( XLRI, Jamshedpur) , CAIIB , Ph.D ( Financial
Fund Manager Sandeep Shirsat- B.Com, ICWA Management)
Date of Launch November 25, 2009 Fund Manager Sandeep Shirsat- B.Com, ICWA
Net Asset Value Declared every business day Date of Launch November 25, 2009
Fund's Fact Sheet Published monthly Net Asset Value Declared every business day
Benchmark Composition (85% NIFTY Composite Debt Index & Fund's Fact Sheet Published monthly
Benchmark
15% Nifty 1 day Rate Index) Benchmark 100% Nifty 1 day Rate IndexFunds at a Glance
Name of the Fund Value Fund Name of the Fund Dynamic Asset Allocation Fund
Nature of the Fund Growth Fund Nature of the Fund Equity Fund- proportion varies with P/E model
To provide high growth opportunities with an objective of long To provide long-term capital appreciation with relatively lower
Investment Objective term capital appreciation through investments primarily in equity Investment Objective volatility by dynamically adjusting the capital allocation between
and equity related instruments. equity and fixed income instruments.
This fund will be positioned as a multi-cap pure value fund with This Fund would be positioned as a dynamic equity fund aiming to
clearly defined investment criteria for investing in value stocks. provide a stable and sustainable relative out performance vis-àvis
Fund Positioning The fund will invest in stocks that are relatively undervalued to Fund Positioning the benchmark. The asset allocation between equity and fixed
their intrinsic value and will create wealth for investors in the income instruments will be based on the PE level of the index
medium to long term. (Sensex).
Asset Allocation Equity Debt Money market Asset Allocation Equity Debt Money market
Minimum 70 0 0 Minimum 0 0 0
Maximum 100 0 30 Maximum 80 80 40
Chief Investment Officer Shri A.K.Sridhar, B.Sc, ACA Chief Investment Office Shri A.K.Sridhar, B.Sc, ACA
Fund Manager Viraj Nadkarni Fund Manager Viraj Nadkarni
M.Com, C.S. (Company Secretary), MBA (Finance) M.Com, C.S. (Company Secretary), MBA (Finance)
Date of Launch September 16, 2010 Date of Launch September 09, 2011
Net Asset Value Declared every business day Net Asset Value Declared every business day
Fund's Fact Sheet Published monthly Fund's Fact Sheet Published monthly
Benchmark Composition (90% S&P BSE 100 Index & 10% Nifty 1 Benchmark Composition (60% Nifty 50 Index, 10% Nifty 1 day
Benchmark Benchmark
day Rate Index) Rate Index & 30% NIFTY Composite Debt Index)
Name of the Fund Index Tracker Fund Name of the Fund Equity Elite Opportunities Fund
Nature of the Fund Equity Index Fund Nature of the Fund Equity Growth Fund - Primarily invested in equity
To provide growth opportunities with an objective of long term
The principal investment objective of the scheme is to invest in
capital appreciation through investments primarily in equity and
Investment Objective stocks of companies comprising large cap Index stocks and Investment Objective
equity related instruments and an active management of asset
endeavour to achieve return equivalent to large cap index.
allocation between Equity and Money Market instruments.
Major portion of this Fund will be invested only in large cap index This Fund is positioned as a diversified equity fund aiming to
equity stocks. The exposure / weightages of investment stocks provide a stable and sustainable relative out performance vis-à-
Fund Positioning vis the benchmark. The fund would stick to the theme of
will, however be subject to regulatory investment guidelines and
exposure norms. Fund Positioning discipline, diligence and dividend yield while selecting the equity
stocks. It would invest at least 70 % of its exposure to equity in the
large cap stocks (from CNX Nifty Index or BSE 100 Index ) and
Asset Allocation Equity Debt Money market the remaining could be in mid / small cap equity stocks.
Minimum 90 0 0
Maximum 100 0 10 Asset Allocation Equity Debt Money market
Chief Investment Officer Shri A.K.Sridhar, B.Sc, ACA Minimum 60 0 0
Fund Manager Viraj Nadkarni- Maximum 100 0 40
M.Com, C.S. ( Company Secretary), MBA ( Finance) Chief Investment Office Shri A.K.Sridhar, B.Sc, ACA
Date of Launch September 22, 2010 Fund Manager Viraj Nadkarni-
Net Asset Value Declared every business day M.Com, C.S. ( Company Secretary), MBA ( Finance)
Fund's Fact Sheet Published monthly Date of Launch October 27, 2016
Benchmark Composition (95% Nifty 50 Index & 5% Nifty 1 day Net Asset Value Declared every business day
Benchmark
Rate Index) Fund's Fact Sheet Published monthly
Benchmark Compostion (60% Nifty 50 Index & 40% Nifty 1 Day
Benchmark
Index)
# Nifty 50/ S&P BSE 100 Index
Equity Fund, Equity Fund Pension, Balanced Fund, Balanced Fund Pension and Index Tracker Fund are benchmarked to Nifty 50 Index which is not sponsored endorsed, sold or promoted by India Index
Services & Products Limited (IISL). IISL is not responsible for any errors or omissions or the results obtained from the use of such index and in no event shall IISL have any liability to any party for any
damages of whatsoever nature (including lost profits) resulted to such party due to purchase or sale or otherwise of such product benchmarked to such index.
“Standard & Poor's® and “S&P® are trademarks of The McGraw-Hill Companies, Inc. and have been licensed for use by Bombay Stock Exchange (BSE). The S&P BSE 100 Index is not compiled,
calculated or distributed by Standard & Poor's and Standard & Poor's and BSE make no representation regarding the advisability of investing in products that utilize any such Index as a component. All
rights in the S&P SENSEX/ S&P BSE 100 vest in Bombay Stock Exchange Ltd. (“BSE”). BSE and SENSEX are trademarks of BSE and are used by IndiaFirst Life Insurance Company Limited. BSE shall
not be liable in any manner whatsoever (including in negligence) for any loss arising to any person whosoever out of use of or reliance on the SENSEX by any person.Fund Options under IndiaFirst ULIP Products - Individual Policyholders & Group Policyholders
As on June 30, 2020
Group
Individual Products
Products
IndiaFirs IndiFirst IndiaFirs IndiaFirs IndiaFirst
IndiaFirs IndiaFirst IndiFirst
IndiaFirst IndiaFirst t Money t t Life IndiaFirst
t Young Happy
Fund Name Savings
Education
India
Future Smart
India
Back Health Money High Wealth Employee
Plan @ Plan@ Save Insurance Balance Life maximizer Benefit Plan
Plan @ Plan @ Plan
Plan Plan@ Plan Plan@ Plan
Equity Fund Y Y N N N N N N N N N
Debt Fund Y Y N N N N N N N N N
Balanced Fund Y Y N N N N N N N N N
Liquid Fund Y Y N N N N N N N N N
Equity Fund Pension N N N Y N N N N N N N
Debt Fund Pension N N N Y N N N N N N N
Balanced Fund Pension N N N Y N N N N N N N
Liquid Fund Pension N N N Y N N N N N N N
Equity1 Fund N N Y N Y Y Y Y N Y N
Balanced1 Fund N N Y N Y Y Y N N Y N
Debt1 Fund N N Y N Y Y Y Y Y Y N
Index Tracker Fund N N Y N N N Y N N Y N
Value Fund N N Y N Y Y Y N N Y N
Dynamic Asset Allocation Fund N N N N N N N N Y Y N
Equity Elite Opportunities Fund N N N N N N N N N Y
Liquid1 Fund # N N Y N Y Y Y N Y N N
Cash Fund N N N N N N N N N N Y
Bond Fund N N N N N N N N N N Y
Equity Advantage Fund N N N N N N N N N N Y
Dynamic Moderator Fund N N N N N N N N N N Y
#
Only available for Settlement Options for the Systematic Transfer of Fund benefit
@
Closed for New business - only renewal premiums now
*The earlier IndiaFirst Smart save Plan and IndiaFirst Money Balance Plan had Index Tracker Fund option. However, they
were relaunched without this optionEquity 1 Fund (SFIN:ULIF009010910EQUTY1FUND143)
Fact Sheet for June 2020 ( based on portfolio as on 30.06.2020 )
Investment Objective Portfolio
Nature of Security/Security Name Percentage
To provide high growth opportunities with an objective of long term capital
appreciation through investments primarily in equity and equity related instruments. Equity
Top 20 Equity Securities
Infosys Technologies Ltd 7.35
Name Date of Inception NAV as on June 30, 2020 Reliance Industries Ltd 7.11
Equity 1 Fund 15-Sep-10 Rs. 18.2017 HDFC 5.87
HDFC Bank Ltd 5.65
AUM Fund Manager Funds managed by the Fund Manager ITC Ltd 4.66
Rs. 1802 crore Viraj Nadkarni Equity - 7, Debt - 0, Balanced - 5 ICICI Bank Ltd 4.37
Bharti Airtel Ltd 4.25
Reliance ETF Bank BeES 3.97
Targeted Asset Allocation Pattern in Percentage Kotak Banking ETF 3.96
Minimum Maximum Actual Tata Consultancy Services Ltd 3.81
Equity Shares 80 100 95 Hindustan Unilever Ltd 3.61
Debt Securities and Bonds 0 10 0 Larsen & Toubro Limited 2.92
Cash and Money Market Investments 0 20 5 State Bank of India 1.99
The actual asset allocation will remain within the 'minimum' and 'maximum' range based on market Axis Bank Ltd 1.83
opportunities and future outlook of the markets Britannia Industries Ltd 1.77
Sun Pharmaceutical Inds Ltd 1.66
Fund Positioning NTPC Ltd 1.56
This Fund is positioned as a highly diversified equity fund aiming to provide a stable and Hero Motocorp Limited 1.30
sustainable relative out performance visà-vis the benchmark. The fund will stick to the theme HCL Technologies Ltd 1.26
of discipline, diligence and dividend yield while selecting equity stocks. It will invest at least 70 Dr Reddys Laboratories Ltd 1.17
percent of its exposure to equity in large cap stocks (from Nifty 50 Index or BSE 100 Index) Others (See Annexure 1 for details) 24.97
and the remaining may be invested in mid/ small-cap equity stocks. Total - Equity Securities 95.04
Money Market Instruments 4.96
MF Units – Liquid Funds 0.00
Grand Total 100.00
Asset Allocation in crore as on June 30, 2020
89.48 Fund Manager's Comments
5%
In the month of June 2020, the Indian headline indices ended on a positive note with
the Sensex (+7.6%) and Nifty (+7.5%) outperforming other key global indices. The BSE
Midcap (+10.2%) and BSE Smallcap (+13.6%) have outperformed the headline indices.
Markets ended in green on the back of Governments directions to unlock in a phased
manner, IMD forecast of normal monsoon and SC giving clarification on loan
moratorium case. The markets were resilient for the month despite India-China face-
1712.93 off. On the Economy front, IIP growth plummeted by -55% in April-20 as against -
95% 18.3% in Mar-20 due to the implementation of nationwide lockdown. CPI food inflation
moderated to 9.3% in May-20 as against 10.5% in April-20 led by softer vegetable
Equity Money Market Instruments prices. Key global indices have ended in green on the back of monetary measures by
key central banks and improving economic activity. FPIs bought equity worth US$ 2.47
bn and DIIs bought equity worth US$ 0.32 bn in cash segment for the month.
Returns (%)
Globally, continuity in governments providing fiscal stimulus, gradual recovery in
Composite
Period Equity 1 Fund economic activity and geopolitical tensions across the globe including the rift between
Benchmark* India-China would be the key factors in determining the market direction going ahead.
1 Month 6.84 6.81 On the domestic front significant uncertainties persist over the recovery of economy in
6 Months -15.51 -13.62 the near term due to raising infection rates and continued social distancing norms. As
1 Year -12.51 -10.90 the lockdown has resulted in income devastation, deterioration of corporate balance
2 Years -1.91 -1.21 sheets and unemployment, the economic recovery is unlikely to be V-Shaped in the
near term. Given the inherent uncertainties in the near term we would approach the
3 Years 1.37 2.95 markets with a cautious view and stick to companies which have stronger balance
5 Years 3.94 4.41 sheets.
Since Inception 6.30 6.03
*For details please refer "Fund at a Glance; # Annualised Retuns In light of the changing dynamics, we prefer rural & consumption themes (Select FMCG
Industry -wise Exposure and Agri), IT and utilities to which we have realigned our portfolio. Going ahead, with
the ever-changing dynamics we may take call on specific sector/companies.
Industrial construction 2.92%
Miscellaneous 3.96%
Asset Management Services (Mutual Funds) 3.97%
Telecommunication Services 4.25%
Drugs & pharmaceuticals 4.49%
Tobacco Products 4.66%
Cosmetics, toiletries, soaps & detergents 4.81%
Refinery 7.82%
Computer software 12.42%
Financial and Insurance Activities 23.48%
Others 27.21%
0% 5% 10% 15% 20% 25% 30%
Quantitative Indicators (Equity)
Std Dev (Annualised) Sharpe Ratio Portfolio Beta
28.75% -0.44 1.02Equity Fund (SFIN:ULIF001161109EQUITYFUND143)
Fact Sheet for June 2020 ( based on portfolio as on 30.06.2020 )
Investment Objective Portfolio
Nature of Security/Security Name Percentage
To provide high growth opportunities with an objective of long term capital
appreciation through investments primarily in equity and equity related instruments. Equity
Top 20 Equity Securities
Reliance Industries Ltd 7.20
Name Date of Inception NAV as on June 30, 2020 Infosys Technologies Ltd 6.91
Equity Fund 25-Nov-09 Rs. 19.2733 Tata Consultancy Services Ltd 4.40
Kotak Banking ETF 4.27
AUM Fund Manager Funds managed by the Fund Manager Bharti Airtel Ltd 4.02
Rs. 158 crore Viraj Nadkarni Equity - 7, Debt - 0, Balanced - 5 Reliance ETF Bank BeES 3.98
ITC Ltd 3.76
HDFC Bank Ltd 3.59
Targeted Asset Allocation Pattern in Percentage HDFC 3.44
Minimum Maximum Actual ICICI Bank Ltd 3.34
Equity Shares 80 100 96 Hindustan Unilever Ltd 2.59
Debt Securities and Bonds 0 10 0 State Bank of India 2.42
Cash and Money Market Investments 0 20 4 Larsen & Toubro Limited 2.34
The actual asset allocation will remain within the 'minimum' and 'maximum' range based on market Axis Bank Ltd 2.11
opportunities and future outlook of the markets Sun Pharmaceutical Inds Ltd 2.06
NTPC Ltd 1.76
Fund Positioning Kansai Nerolac Paints Ltd 1.55
This Fund is positioned as a highly diversified equity fund aiming to provide a stable and Lupin Ltd 1.41
sustainable relative out performance visà- vis the benchmark.The Fund will stick to the theme Britannia Industries Ltd 1.36
of discipline, diligence and dividend yield while selecting equity stocks. It will invest at least 70 HCL Technologies Ltd 1.29
percent of its exposure to equity in large cap stocks and the remaining may be invested in Others (See Annexure 1 for details) 32.37
mid/ small-cap equity stocks. Total - Equity Securities 96.17
Money Market Instruments 3.83
MF Units – Liquid Funds 0.00
Grand Total 100.00
Asset Allocation in crore as on June 30, 2020
6.04 Fund Manager's Comments
4% In the month of June 2020, the Indian headline indices ended on a positive note with
the Sensex (+7.6%) and Nifty (+7.5%) outperforming other key global indices. The BSE
Midcap (+10.2%) and BSE Smallcap (+13.6%) have outperformed the headline indices.
Markets ended in green on the back of Governments directions to unlock in a phased
manner, IMD forecast of normal monsoon and SC giving clarification on loan
moratorium case. The markets were resilient for the month despite India-China face-
151.75 off. On the Economy front, IIP growth plummeted by -55% in April-20 as against -
96% 18.3% in Mar-20 due to the implementation of nationwide lockdown. CPI food inflation
moderated to 9.3% in May-20 as against 10.5% in April-20 led by softer vegetable
prices. Key global indices have ended in green on the back of monetary measures by
Equity Money Market Instruments
key central banks and improving economic activity. FPIs bought equity worth US$ 2.47
bn and DIIs bought equity worth US$ 0.32 bn in cash segment for the month.
Returns (%)
Globally, continuity in governments providing fiscal stimulus, gradual recovery in
Composite economic activity and geopolitical tensions across the globe including the rift between
Period Equity Fund
Benchmark* India-China would be the key factors in determining the market direction going ahead.
1 Month 7.96 6.81 On the domestic front significant uncertainties persist over the recovery of economy in
6 Months -16.55 -13.62 the near term due to raising infection rates and continued social distancing norms. As
1 Year -13.64 -10.90 the lockdown has resulted in income devastation, deterioration of corporate balance
sheets and unemployment, the economic recovery is unlikely to be V-Shaped in the
2 Years -2.93 -1.21
near term. Given the inherent uncertainties in the near term we would approach the
3 Years -0.55 2.95 markets with a cautious view and stick to companies which have stronger balance
5 Years 2.52 4.41 sheets.
Since Inception 6.38 6.83
*For details please refer "Fund at a Glance; # Annualised Retuns In light of the changing dynamics, we prefer rural & consumption themes (Select FMCG
Industry -wise Exposure and Agri), IT and utilities to which we have realigned our portfolio. Going ahead, with
the ever-changing dynamics we may take call on specific sector/companies.
Natural Gas Trading & Distribution 2.70%
Cosmetics, toiletries, soaps & detergents 3.23%
Tobacco Products 3.76%
Asset Management Services (Mutual Funds) 3.98%
Telecommunication Services 4.02%
Miscellaneous 4.27%
Drugs & pharmaceuticals 5.58%
Refinery 8.91%
Computer software 12.60%
Financial and Insurance Activities 21.87%
Others 29.08%
0% 5% 10% 15% 20% 25% 30% 35%
Quantitative Indicators (Equity)
Std Dev (Annualised) Sharpe Ratio Portfolio Beta
29.86% -0.46 1.05Equity Fund - Pension (SFIN:ULIF002161109EQUFUNDPEN143)
Fact Sheet for June 2020 ( based on portfolio as on 30.06.2020 )
Investment Objective Portfolio
Nature of Security/Security Name Percentage
To provide higher growth with reasonable security, by investing primarily in equity
instruments and moderate allocation in debt securities/ bonds. Equity
Top 20 Equity Securities
Reliance Industries Ltd 9.48
Name Date of Inception NAV as on June 30, 2020 HDFC Bank Ltd 7.57
Equity Fund -
25-Nov-09 Rs. 21.0171 HDFC 6.10
Pension
Infosys Technologies Ltd 6.00
AUM Fund Manager Funds managed by the Fund Manager Tata Consultancy Services Ltd 4.90
Rs. 87 crore Viraj Nadkarni Equity - 7, Debt - 0, Balanced - 5 Hindustan Unilever Ltd 4.74
ITC Ltd 4.39
Reliance ETF Bank BeES 4.08
Targeted Asset Allocation Pattern in Percentage Kotak Banking ETF 4.07
Minimum Maximum Actual Bharti Airtel Ltd 3.47
Equity Shares 80 100 99 ICICI Bank Ltd 3.35
Debt Securities and Bonds 0 10 0 Kotak Mahindra Bank Ltd 3.04
Cash and Money Market Investments 0 20 1 Larsen & Toubro Limited 2.96
The actual asset allocation will remain within the 'minimum' and 'maximum' range based on market Maruti Suzuki India Ltd 2.00
opportunities and future outlook of the markets Asian Paints Ltd 1.97
Nestle India Ltd 1.53
Fund Positioning HCL Technologies Ltd 1.37
This Fund is positioned as a diversified equity fund with a moderate exposure to mid-cap Bajaj Finance Ltd 1.35
stocks. The aim of the Fund is to provide a stable and sustainable relative out performance Sun Pharmaceutical Inds Ltd 1.32
vis-àvis the benchmark. The Fund will stick to the theme of discipline, diligence and dividend Mahindra & Mahindra 1.27
yield while selecting equity stocks. The Fund will have an exposure of upto 30 percent to mid- Others (See Annexure 1 for details) 23.74
cap companies. The remaining exposure will continue to be in largecap companies. Total - Equity Securities 98.70
Money Market Instruments 1.30
MF Units – Liquid Funds 0.00
Grand Total 100.00
Asset Allocation in crore as on June 30, 2020
1.14 Fund Manager's Comments
1% In the month of June 2020, the Indian headline indices ended on a positive note with
the Sensex (+7.6%) and Nifty (+7.5%) outperforming other key global indices. The BSE
Midcap (+10.2%) and BSE Smallcap (+13.6%) have outperformed the headline indices.
Markets ended in green on the back of Governments directions to unlock in a phased
manner, IMD forecast of normal monsoon and SC giving clarification on loan
moratorium case. The markets were resilient for the month despite India-China face-
86.16 off. On the Economy front, IIP growth plummeted by -55% in April-20 as against -
18.3% in Mar-20 due to the implementation of nationwide lockdown. CPI food inflation
99%
moderated to 9.3% in May-20 as against 10.5% in April-20 led by softer vegetable
prices. Key global indices have ended in green on the back of monetary measures by
Equity Money Market Instruments
key central banks and improving economic activity. FPIs bought equity worth US$ 2.47
bn and DIIs bought equity worth US$ 0.32 bn in cash segment for the month.
Returns (%)
Globally, continuity in governments providing fiscal stimulus, gradual recovery in
Equity Fund - Composite economic activity and geopolitical tensions across the globe including the rift between
Period
Pension Benchmark* India-China would be the key factors in determining the market direction going ahead.
1 Month 6.91 6.81 On the domestic front significant uncertainties persist over the recovery of economy in
6 Months -14.26 -13.62 the near term due to raising infection rates and continued social distancing norms. As
1 Year -11.99 -10.90 the lockdown has resulted in income devastation, deterioration of corporate balance
sheets and unemployment, the economic recovery is unlikely to be V-Shaped in the
2 Years -1.64 -1.21
near term. Given the inherent uncertainties in the near term we would approach the
3 Years 1.60 2.95 markets with a cautious view and stick to companies which have stronger balance
5 Years 4.28 4.41 sheets.
Since Inception 7.26 6.83
*For details please refer "Fund at a Glance; # Annualised Retuns In light of the changing dynamics, we prefer rural & consumption themes (Select FMCG
Industry -wise Exposure and Agri), IT and utilities to which we have realigned our portfolio. Going ahead, with
the ever-changing dynamics we may take call on specific sector/companies.
Industrial construction 2.96%
Drugs & pharmaceuticals 3.42%
Telecommunication Services 3.98%
Miscellaneous 4.07%
Asset Management Services (Mutual Funds) 4.08%
Tobacco Products 4.39%
Cosmetics, toiletries, soaps & detergents 4.74%
Refinery 10.82%
Computer software 13.77%
Others 23.23%
Financial and Insurance Activities 24.54%
0% 5% 10% 15% 20% 25% 30%
Quantitative Indicators (Equity)
Std Dev (Annualised) Sharpe Ratio Portfolio Beta
29.34% -0.40 1.04Equity Elite Opportunities (SFIN:ULIF020280716EQUELITEOP143)
Fact Sheet for June 2020 ( based on portfolio as on 30.06.2020 )
Investment Objective Portfolio
Nature of Security/Security Name Percentage
To provide growth opportunities with an objective of long term capital appreciation
through investments primarily in equity and equity related instruments and an active Equity
management of asset allocation between Equity and Money Market instruments. Top 20 Equity Securities
Reliance Industries Ltd 7.17
Name Date of Inception NAV as on June 30, 2020 Infosys Technologies Ltd 6.00
Equity Elite
27-Oct-16 Rs. 11.2045 HDFC 5.91
Opportunities
HDFC Bank Ltd 4.65
AUM Fund Manager Funds managed by the Fund Manager ITC Ltd 4.32
Rs. 16 crore Viraj Nadkarni Equity - 7, Debt - 0, Balanced - 5 Reliance ETF Bank BeES 4.00
Kotak Banking ETF 3.97
Tata Consultancy Services Ltd 3.70
Targeted Asset Allocation Pattern in Percentage ICICI Bank Ltd 3.65
Minimum Maximum Actual Bharti Airtel Ltd 3.61
Equity Shares 60 100 95 Hindustan Unilever Ltd 2.52
Debt Securities and Bonds 0 0 0 State Bank of India 2.37
Cash and Money Market Investments 0 40 5 Britannia Industries Ltd 2.26
The actual asset allocation will remain within the 'minimum' and 'maximum' range based on market NTPC Ltd 1.91
opportunities and future outlook of the markets Sun Pharmaceutical Inds Ltd 1.76
Axis Bank Ltd 1.63
Fund Positioning Hero Motocorp Limited 1.42
This Fund is positioned as a diversified equity fund aiming to provide a stable and sustainable Dr Reddys Laboratories Ltd 1.36
relative out performance vis-à-vis the benchmark. The fund would stick to the theme of Kansai Nerolac Paints Ltd 1.34
discipline, diligence and dividend yield while selecting the equity stocks. It would invest at HCL Technologies Ltd 1.32
least 70 % of its exposure to equity in the large cap stocks and the remaining could be in mid Others (See Annexure 1 for details) 30.41
/ small cap equity stocks. Total - Equity Securities 95.30
Money Market Instruments 4.70
MF Units – Liquid Funds 0.00
Grand Total 100.00
Asset Allocation in crore as on June 30, 2020
0.78 Fund Manager's Comments
5%
In the month of June 2020, the Indian headline indices ended on a positive note with
the Sensex (+7.6%) and Nifty (+7.5%) outperforming other key global indices. The BSE
Midcap (+10.2%) and BSE Smallcap (+13.6%) have outperformed the headline indices.
Markets ended in green on the back of Governments directions to unlock in a phased
manner, IMD forecast of normal monsoon and SC giving clarification on loan
moratorium case. The markets were resilient for the month despite India-China face-
15.71 off. On the Economy front, IIP growth plummeted by -55% in April-20 as against -
95% 18.3% in Mar-20 due to the implementation of nationwide lockdown. CPI food inflation
moderated to 9.3% in May-20 as against 10.5% in April-20 led by softer vegetable
Equity Money Market Instruments prices. Key global indices have ended in green on the back of monetary measures by
key central banks and improving economic activity. FPIs bought equity worth US$ 2.47
bn and DIIs bought equity worth US$ 0.32 bn in cash segment for the month.
Returns (%)
Globally, continuity in governments providing fiscal stimulus, gradual recovery in
Equity Elite Composite
Period economic activity and geopolitical tensions across the globe including the rift between
Opportunities Benchmark* India-China would be the key factors in determining the market direction going ahead.
1 Month 6.91 4.62 On the domestic front significant uncertainties persist over the recovery of economy in
6 Months -14.98 -8.47 the near term due to raising infection rates and continued social distancing norms. As
1 Year -11.80 -5.76 the lockdown has resulted in income devastation, deterioration of corporate balance
2 Years -1.88 0.99 sheets and unemployment, the economic recovery is unlikely to be V-Shaped in the
near term. Given the inherent uncertainties in the near term we would approach the
3 Years 0.98 3.83 markets with a cautious view and stick to companies which have stronger balance
5 Years sheets.
Since Inception 3.14 5.25
*For details please refer "Fund at a Glance; # Annualised Retuns In light of the changing dynamics, we prefer rural & consumption themes (Select FMCG
Industry -wise Exposure and Agri), IT and utilities to which we have realigned our portfolio. Going ahead, with
the ever-changing dynamics we may take call on specific sector/companies.
Bakery products 2.27%
Telecommunication Services 3.61%
Miscellaneous 3.97%
Asset Management Services (Mutual Funds) 4.00%
Cosmetics, toiletries, soaps & detergents 4.11%
Tobacco Products 4.32%
Drugs & pharmaceuticals 6.31%
Refinery 7.91%
Computer software 12.28%
Financial and Insurance Activities 23.97%
Others 27.25%
0% 5% 10% 15% 20% 25% 30%
Quantitative Indicators (Equity)
Std Dev (Annualised) Sharpe Ratio Portfolio Beta
26.84% -0.46 1.41Balanced Fund (SFIN:ULIF005161109BALANCEDFN143)
Fact Sheet for June 2020 ( based on portfolio as on 30.06.2020 )
Investment Objective Portfolio
Nature of Security/Security Name Rating Percentage
To provide higher growth with reasonable security, by investing primarily in equity
instruments and moderate allocation in debt securities/ bonds. Equity
Top 10 Equity Securities
Infosys Technologies Ltd 4.76
Name Date of Inception NAV as on June 30, 2020 Reliance Industries Ltd 4.66
Balanced Fund 25-Nov-09 Rs. 19.6083 HDFC Bank Ltd 3.52
Tata Consultancy Services Ltd 2.93
AUM Fund Manager Funds managed by the Fund Manager ICICI Bank Ltd 2.92
Sandeep Shirsat Equity - 0, Debt - 7, Balanced - 5 Bharti Airtel Ltd 2.63
Rs. 103 crore
Viraj Nadkarni Equity - 7, Debt - 0, Balanced - 5 ITC Ltd 2.45
HDFC 2.22
Targeted Asset Allocation Pattern in Percentage Axis Bank Ltd 1.96
Minimum Maximum Actual State Bank of India 1.93
Equity Shares 50 70 63 Others (See Annexure 1 for details) 33.43
Debt Securities and Bonds 30 50 32 Total - Equity Securities 63.41
Cash and Money Market Investments 0 20 5
The actual asset allocation will remain within the 'minimum' and 'maximum' range based on market Debt
opportunities and future outlook of the markets
Top Sovereign Securities
8.17% Government of India 2044 4.61
Fund Positioning 8.3% Government of India 2040 2.01
This Fund is positioned as a balanced mix of debt and equity, with the asset allocation 8.83% Government of India 2041 1.21
pattern providing a good opportunity to provide consistent and sustainable returns. The Total - Sovereign Securities 7.84
equity portion will have a highly diversified portfolio with high liquidity while the debt portion
will comprise of high rated debt instruments with a low to moderate liquidity. The asset Top 10 Corporate bonds
allocation will follow a macro level market scenario and the individual stock selection will be 7.17% National Highways Authority of India 2021 AAA 3.50
with micro level performance expectations of the stocks and securities.
9.35% Rural Electrification Corp 2022 AAA 3.15
9.95% Food Corporation of India 2022 AAA 3.14
9.22% LIC Housing Finance Ltd 2024 AAA 2.73
7.95% India Infradebt Limited 2024 AAA 2.09
Asset Allocation in crore as on June 30, 2020 7.71% L&T Finance 2022 AAA 2.05
4.67 9.29% Power Finance Corporation Ltd 2022 AAA 1.94
5% 8.5% HDFC 2020 AAA 1.94
10.02% Mahindra & Mahindra Fin. Serv. 2022 AA+ 1.34
33.17 10.15% Mahindra & Mahindra Fin. Serv. 2022 AA+ 1.06
32% Others (See Annexure 1 for details) 1.30
65.58 Total - Corporate bonds 24.24
63%
Money Market Instruments 4.51
MF Units – Liquid Funds 0.00
Grand Total 100.00
Equity Debt Money Market Instruments
Returns (%)
Balanced Composite
Period
Fund Benchmark*
1 Month 5.42 4.94
6 Months -9.50 -6.68
1 Year -5.96 -3.23
2 Years 2.14 3.05 Credit Profile of Debt and Money Market Investments
3 Years 2.58 4.69 Nature Percentage
5 Years 4.58 5.86 GSEC & T Bills 21.42
Since Inception 6.56 7.29 AAA & P1+ & PR1+ & A1+ 58.99
*For details please refer "Fund at a Glance AA+ & AA 6.55
Industry -wise Exposure (%) AA- 0.00
Telecommunication Services 2.63%
A & Below 0.69
Fixed Deposits with Banks 0.00
Trading 3.14%
CBLO/TREPS/ Other Money Market Investments 12.34
Business Services & Consultancy 3.50% Total 100.00
Drugs & pharmaceuticals 3.67%
Maturity Profile of Debt Portfolio
Housing finance services 5.45%
Period Exposure in Percentage
Refinery 5.74% 0 - 3 Months 17.64
Infrastructure Finance Services 7.43% 3 - 12 Months 0.00
Sovereign 7.84%
1 - 3 Years 47.76
3 - 5 Years 13.17
Computer software 8.53%
5 - 10 Years 0.00
Financial and Insurance Activities 22.44% > 10 Years 21.42
Others 29.63% Total 100.00
0% 5% 10% 15% 20% 25% 30% 35%
Quantitative Indicators (Equity)
Std Dev (Annualised) Sharpe Ratio Portfolio Beta
19.10% -0.40 0.99
Quantitative Indicators (Debt)
Average Maturity (Years) Modified Duration (Years) Fund Manager's Comments
6.45 3.60 Please refer to the page “Fund Manager's Comments”Balanced 1 Fund (SFIN:ULIF011010910BALAN1FUND143)
Fact Sheet for June 2020 ( based on portfolio as on 30.06.2020 )
Investment Objective Portfolio
Nature of Security/Security Name Rating Percentage
To provide higher growth with reasonable security, by investing primarily in equity
instruments and moderate allocation in debt securities/ bonds. Equity
Top 10 Equity Securities
HDFC Bank Ltd 5.20
Name Date of Inception NAV as on June 30, 2020 Infosys Technologies Ltd 4.64
Balanced 1 Fund 14-Sep-10 Rs. 18.0429 Reliance Industries Ltd 4.51
HDFC 3.72
AUM Fund Manager Funds managed by the Fund Manager ICICI Bank Ltd 3.49
Sandeep Shirsat Equity - 0, Debt - 7, Balanced - 5 ITC Ltd 2.96
Rs. 338 crore
Viraj Nadkarni Equity - 7, Debt - 0, Balanced - 5 Bharti Airtel Ltd 2.70
Tata Consultancy Services Ltd 2.54
Targeted Asset Allocation Pattern in Percentage Hindustan Unilever Ltd 2.29
Minimum Maximum Actual Larsen & Toubro Limited 1.92
Equity Shares 50 70 61 Others (See Annexure 1 for details) 27.35
Debt Securities and Bonds 30 50 32 Total - Equity Securities 61.31
Cash and Money Market Investments 0 20 6
The actual asset allocation will remain within the 'minimum' and 'maximum' range based on market Debt
opportunities and future outlook of the markets
Top Sovereign Securities
8.08% Government of India 2022 4.77
Fund Positioning 6.19% Government of India 2034 2.94
This Fund is positioned as a balanced mix of debt and equity, with the asset allocation 6.45% Government of India 2029 1.45
pattern providing a good opportunity to provide consistent and sustainable returns. The 6.68% Government of India 2031 0.92
equity portion will have a highly diversified portfolio with high liquidity while the debt portion 7.57% Government of India 2033 0.65
will comprise of high rated debt instruments with a low to moderate liquidity. The asset 7.72% Government of India 2025 0.38
allocation will follow a macro level market scenario and the individual stock selection will be 8.97% Government of India 2030 0.36
with micro level performance expectations of the stocks and securities.
Total - Sovereign Securities 11.47
Top 10 Corporate bonds
8.57% Rural Electrification Corp 2024 AAA 4.93
Asset Allocation in crore as on June 30, 2020 9.95% Food Corporation of India 2022 AAA 3.44
21.89 9.05% JK Lakshmi Cement Ltd 2021 AA- 3.02
7% 9.35% Rural Electrification Corp 2022 AAA 1.96
7.95% India Infradebt Limited 2024 AAA 1.60
108.97 7.8% Apollo Tyres Ltd 2022 AA+ 1.24
32% 8.6% LIC Housing Finance Ltd 2020 AAA 0.89
207.38
9.39% LIC Housing Finance Ltd 2024 AAA 0.74
61%
8.07% Energy Efficiency Services Ltd 2021 AA- 0.61
9.75% Rural Electrification Corp 2021 AAA 0.60
Others (See Annexure 1 for details) 1.74
Total - Corporate bonds 20.75
Equity Debt Money Market Instruments
Money Market Instruments 6.47
Returns (%) MF Units – Liquid Funds 0.00
Balanced 1 Composite Grand Total 100.00
Period
Fund Benchmark*
1 Month 4.71 4.94
6 Months -8.68 -6.68
1 Year -6.28 -3.23
2 Years 1.54 3.05 Credit Profile of Debt and Money Market Investments
3 Years 2.54 4.69 Nature Percentage
5 Years 4.49 5.86 GSEC & T Bills 29.64
Since Inception 6.21 6.92 AAA & P1+ & PR1+ & A1+ 40.21
*For details please refer "Fund at a Glance AA+ & AA 3.62
Industry -wise Exposure (%) AA- 9.38
Drugs & pharmaceuticals 2.92%
A & Below 0.43
Fixed Deposits with Banks 0.00
Tobacco Products 2.96%
CBLO/TREPS/ Other Money Market Investments 16.73
Cosmetics, toiletries, soaps & detergents 3.10% Total 100.00
Trading 4.05%
Maturity Profile of Debt Portfolio
Cement 4.21%
Period Exposure in Percentage
Refinery 4.96% 0 - 3 Months 20.56
Computer software 7.97% 3 - 12 Months 8.68
Infrastructure Finance Services 9.24%
1 - 3 Years 34.70
3 - 5 Years 19.73
Sovereign 11.47%
5 - 10 Years 3.75
Financial and Insurance Activities 20.16% > 10 Years 12.58
Others 28.96% Total 100.00
0% 5% 10% 15% 20% 25% 30% 35%
Quantitative Indicators (Equity)
Std Dev (Annualised) Sharpe Ratio Portfolio Beta
18.42% -0.44 0.96
Quantitative Indicators (Debt)
Average Maturity (Years) Modified Duration (Years) Fund Manager's Comments
3.60 2.66 Please refer to the page “Fund Manager's Comments”You can also read