STOCK MARKET AND MACROECONOMIC VARIABLES: EVIDENCE FOR BRAZIL
←
→
Page content transcription
If your browser does not render page correctly, please read the page content below
ISSN 2237-7662, Florianópolis, SC, v. 19, 1-15,
 e2892, 2020

 DOI: 10.16930/2237-766220202892
 Available at http://revista.crcsc.org.br

 STOCK MARKET AND MACROECONOMIC VARIABLES: EVIDENCE
 FOR BRAZIL
 LUAN VINICIUS BERNARDELLI
 Universidade Estadual de Maringá. Address: Av. Colombo, No. 5790, Zone 7
 | 87020-900 | Paraná/PR | Brazil.
 http://orcid.org/0000-0003-1410-2318
 luanviniciusbernardelli@gmail.com

 GUSTAVO HENRIQUE LEITE DE CASTRO
 Universidade de São Paulo. Address: Av. Prof. Luciano Gualberto, 908 |
 Butantã | 05508-010 | São Paulo/SP | Brazil.
 http://orcid.org/0000-0003-4604-7640
 castro.guh@gmail.com

ABSTRACT
This article analyzes the influence of macroeconomic variables on the stock market. The analysis
of this theme is crucial in the current economic context given the severe crisis and the continued
growth of the stock market. This article covers an existing research gap about current stock
market movements. The Geneneralized Least Squares Method with Prais-Winsten
transformation was applied to correct the first-order autoregressive problem. The results show
that the macroeconomic variables continue to influence Ibovespa, as stated in the literature.
However, the central government’s financial stability variable has no explanatory power over the
Brazilian stock market index, corroborating the literature and converging with the empirical
observations from 2016 to 2019 of fiscal imbalance and growth of the Ibovespa.

Keywords: Macroeconomics. Financial market. Performance. Stock market.

1 INTRODUCTION
 Capital market development is essential for the occurrence of economic development. In
particular, the stock market plays a key role in raising funds for companies and, consequently, in
increasing investment, productivity and employment levels. Throughout history, it is clear that
countless countries have benefited from the increased efficiency of savings intermediation
provided by the sophistication of the financial capital market (Grôppo, 2004).
 In times of strong economic change, stock markets become volatile and respond quickly
to macroeconomic changes. In Brazil, the Ibovespa index is the most important indicator of stock
market performance (Pimenta & Scherma, 2010), however, this indicator has changed
significantly in recent years. Data from the Central Bank of Brazil (Bacen) 2019 1 show that the
average value of the Ibovespa went from 40,405 points in January 2016 to 100,967 in June 2019,
representing an increase of approximately 149%.

Submission on 6/29/2019. Review on 10/15/2019. Accepted on 1/6/2020. Published on 1/31/2020.

1
 Time Series Manager (SGS) System Series No. 7,845.

 Revista Catarinense da Ciência Contábil, ISSN 2237-7662, Florianópolis, SC, v. 19, 1-15, e2892, 2020

2 of 15
 Luan Vinicius Bernardelli, Gustavo Henrique Leite de Castro

 It is not possible to accurately predict the behavior of the stock market, however, several
empirical studies point to the importance of economic variables such as exchange rate, gross
domestic product (GDP), basic interest rate and inflation (Bernardelli & Bernardelli, 2016;
Bernardelli, Bernardelli & Castro, 2017; Grôppo, 2005; Oliveira, 2006; Oliveira & Frascaroli,
2014). Linked to that theoretical framework, this research provides new features when compared
to other studies that investigated the stock market in Brazil and its relationship with
macroeconomic variables, since it advances in the analysis with the introduction of new
variables, following those who have been suggested in studies by Grôppo (2005), Pimenta Junior
and Higuchi (2008), Silva and Coronel (2012), Silva, Barbosa and Ribeiro (2016) and Machado,
Gartner and Machado (2018). In addition, analyzes have been introduced for the fiscal stability
of the federal government, the behavior of the Ibovespa index in the previous period and its
trend, not to mention the current single economic context, which combines economic recession
with optimal stock market performance2, and requires careful analysis of this relationship.
 Thus, this paper aims to analyze the impact of macroeconomic variables in the current
context of appreciation of the Brazilian stock market. The justification for the elaboration of this
study comes from the practical contribution generated from the results found that serve investors,
policymakers, entrepreneurs and other economic agents who are interested in understanding how
the economy and the capital market related, which may affect the strategy, and the performance
of companies or the performance of the economy itself. This is because capital market
development fosters economic development, stimulates the production of goods and services,
and raises the level of well-being of all society.
 Thus, the hypotheses established are (i) macroeconomic variables are correlated with the
stock market; (ii) the international stock market is positively correlated with the Ibovespa; (iii)
the Brazilian stock market is positively related to time; and (iv) fiscal stability of the central
government relates to the Ibovespa. This covers a gap in empirical research that has not
empirically evaluated these variables in the Brazilian stock market over a recent period.
 To meet the established objectives, this paper is divided into: literature review on the
relationship of macroeconomics and capital markets; methodology used for analysis; results
presentation; discussion of results in light of current literature; and, eventually, final
considerations.

2 MACROECONOMY AND CAPITAL MARKET
 Several authors have investigated the impact of macroeconomic variables on the world
stock market, such as Chen (1991), Clare and Thomas (1994), Wu and Su (1998), Kwon and
Shin (1999), Maysami and Koh (2000), Maysami, Howe and Rahmat (2004), Islam and
Watanapalachaikul (2003), Boucher (2006) and Kumar (2008).
 This relationship is being strongly researched in Brazil, such as the studies by Grôppo
(2005), Oliveira (2006), Oliveira and Frascaroli (2014), Bernardelli and Bernardelli (2016),
Bernardelli et al. (2017), Machado et al. (2018) and Santana, Lima and Ferreira (2018).
 However, none of the studies applied in Brazil included the central government stability,
the Ibovespa trend and the impact of the international stock market as a variable, generating a
gap in the literature to be explored, since these variables are of great importance in explaining
one of the first variables taken into account when considering the stock market is the exchange
rate, so that several empirical studies sought to identify this relationship (Table 1).

2
 Between April 2015 and April 2019 Ibovespa increased substantially, while GDP stagnated (Bacen 2019a).

 Revista Catarinense da Ciência Contábil, ISSN 2237-7662, Florianópolis, SC, v. 19, 1-15, e2892, 2020
3 of 15
 Stock market and macroeconomic variables: evidence for Brazil

Table 1
Comparison of results between the exchange rate and the stock market
 Authors Period Scope Relationship
 Aggarwal (1981) 1974 – 1978 United States (USA) Positively correlated
 Solnik (1987) 1973 – 1983 Eight major Western countries. Non-significant causality
 Soenen and Hennigar
 1980 – 1986 United States (USA) Negatively correlated
 (1988)
 Soenen and Aggarwal Positive correlation for three
 1980 – 1987 Eight major Western countries.
 (1989) countries and negative for five.
 Issam, Abdalla and India, Korea, Pakistan and the
 1985 – 1994 Unidirectional happenstance
 Victor (1997) Philippines
Chamberlain, Howe and Significant for American banks and
 1986 – 1992 American and Japanese banks
 Popper (1997) not significant for Japanese banks.
 Nieh and Lee (2001) 1993 – 1996 G-7 countries Non-significant relationship.
Phylaktis and Ravazzolo Group of countries based on the Positive relationship between the
 1980 – 1998
 (2005) pacific ocean stock price and exchange rates
 Oliveira (2006) 1972 – 2003 Brazil Positive relationship
 Santana et al. (2018) 1994 – 2014 Brazil Negative relationship
 Machado, Gartner and
 1999 – 2017 Brazil Positive relationship
 Machado (2018)
Source: adapted from Bernardelli and Bernardelli (2016).

 As the authors themselves reported, there is no clear empirical relationship between the
impact of exchange rates and financial market indicators. In fact, this relationship may differ,
depending on the country, or even on the time period analyzed.
 Also a much-investigated but less controversial issue is the risk-free interest rate
normally attributed to government bonds. Internationally, many studies have investigated this
relationship and found negative results, such as Maysami and Koh (2000) and Islam and
Watanapalachaikul (2003). In the case of Brazil, this relationship has been investigated by
different authors, such as Oliveira (2006), Grôppo (2005), Oliveira and Frascaroli (2014),
Bernardelli and Bernardelli (2016), Bernardelli et al. (2017), Machado, Gartner and Machado
(2018) and Santana, Lima and Ferreira (2018).
 All results, except for the studies by Chen (2009) and Machado et al. (2018)3, have
shown a negative relation between the Selic rate and the stock market. Such a result can be
explained from a theoretical point of view, as the public security would be a substitute product of
the stock market, since the surplus agent can select which product to invest in. Although the
expected result is consensus in the literature, it is of fundamental importance to include this
variable in the model in order to avoid problems of omitting important variables.
 In relation to economic growth, the increase in the level of economic activity contributes
positively to the performance of companies, which, as a result, is captured by stock prices
(Bernardelli & Bernardelli, 2016). Thus, the impact of this variable is expected to be positive.
 Another issue that has been hotly debated in recent years in Brazil is the state's financial
stability (Arantes & Lopreato, 2017; Durigan Júnior, Saito, Bergmann, & Fouto, 2018; Silva &
Gamboa, 2011). The level of financial stability of the government and its ability to collect affects
the credit risk of the country and companies and, consequently, this is passed on to investment
decisions and, ultimately, has a reflection on stock prices, as pointed out by the study from
Franzen, Meurer, Gonçalves and Seabra (2009). The importance of a country's fiscal stability in
investigating financial investment flows lies in the fact that capitals are not only governed by the
rates of return but also by the risk attributed to the operation (Santos & Coelho, 2010;
Sanvicente, 2015; Vieira, 2004).

3
 The studies found a positive short- and long-term relationship between interest rate variation and stock market
returns.

 Revista Catarinense da Ciência Contábil, ISSN 2237-7662, Florianópolis, SC, v. 19, 1-15, e2892, 2020
4 of 15
 Luan Vinicius Bernardelli, Gustavo Henrique Leite de Castro

 However, studies on the relationship between fiscal stability and the stock market are still
incipient in Brazil. Thus, in order to verify the relationship between fiscal stability and the
Ibovespa, the central government's financial stability variable (NFSP) has been used as a proxy
for central government financial stability, which, according to Bacen (2019b), is used as a
parameter for assessing the probability of solvency of the public sector and for international
comparisons. The variable total revenue of the federal government has also been used.
 Finally, the international stock market fluctuation may be a sign of a global crisis, and the
so-called contagion effect is reflected in all stock markets, as portrayed by Vartanian (2012).
Thus, the financial market of emerging countries, such as Brazil, Russia and China, is influenced
by the American financial market, represented largely by the Dow Jones index (Farias & Sáfadi,
2009). This corroborates the research by Oliveira and Medeiros (2009), in which the authors
tested the lead lag hypothesis between the US and the Brazilian stock market and concluded that
it is possible to make some prediction about the Ibovespa based on the trajectory information of
the Dow Jones index, that is, the results reveal that the Ibovespa return is largely explained by
the Dow Jones movement. Thus, we used the Dow Jones index, which is considered by Gaio,
Ambrozini, Bonacim and Junior (2014), Angelico and Oliveira (2016) and Silva Ribeiro, Leite
and Justo (2016) as the most representative index of the international market, such a benchmark
for Ibovespa.

3 METHODOLOGICAL PROCEDURES
3.1 Econometric tools
 As pointed out in the introductory section, this paper seeks to analyze the impact of
macroeconomic variables on the Brazilian stock market. Before defining the best method to be
estimated, some econometric tests have been performed in order to identify possible problems
that would result in biased and inconsistent parameter estimates. Tests were performed to detect
multicollinearity, heteroscedasticity and autocorrelation problems. In order to detect
multicollinearity, the variance inflation factor (VIF) has been utilized. To test the null hypothesis
of homoscedasticity of the residues, the Breusch-Pagan test has been employed. To detect
autocorrelation, the test used was the one proposed by Durbin-Watson.
 In time series, a usual problem encountered in the data is serial autocorrelation.
According to Gujarati and Porter (2011), autocorrelation can be defined as a correlation between
members of time-ordered series of observations. To solve this problem, the regression has been
performed by the Prais-Winsten method. The treatment by this method has been selected because
there was no data loss in the series and the results generated were very similar to those of
conventional multiple regression. It is an interactive process that ends after a satisfactory
convergence of the autocorrelation coefficient (Greene, 2012). Thus, as Greene (2012) notes, the
Prais-Winsten transformation removes the autocorrelation and heteroscedasticity present in the
data.
 Because it is a time series, it is necessary to analyze the stationarity of the variables.
According to Bueno (2011), time series may be stationary or not. The non-stationary series has a
tendency, which may be deterministic or stochastic in nature. The deterministic non stationary
series, plus a random component, fluctuates around a time trend. Thus, Gujarati and Porter
(2011) point out that it is necessary to verify that the mean and variance of the samples do not
change systematically over time. To confirm the non-stationarity of the variables, unit root tests
– Dickey-Fuller Augmented (ADF) and Phillips-Perron (PP) have been performed.

 Revista Catarinense da Ciência Contábil, ISSN 2237-7662, Florianópolis, SC, v. 19, 1-15, e2892, 2020
5 of 15
 Stock market and macroeconomic variables: evidence for Brazil

3.2 Database and empirical model
 As shown earlier, the proposed empirical model is inspired by variables already analyzed
in empirical studies for Brazil, according to Grôppo (2005), Oliveira (2006), Oliveira and
Frascaroli (2014), Bernardelli and Bernardelli (2016) and Bernardelli et al. (2017). However, in
addition to the variables commonly used, important variables (not analyzed in other empirical
studies for Brazil) have been included; Such as, for example, government revenue, an
international stock market index and the need for government funding.
 The database used is a monthly time series covering the period from January 2003 to
March 2019, totaling 195 observations. The dependent variable selected to evidence stock
market fluctuations was the Ibovespa, available from Bacen (2019a). The variables used are
described in Table 2.

Table 2
Variables used in the model
 Variable Description Source
 Bacen (2019a)
 Ibovespa Bovespa – monthly index – Points – (Logarithmized)
 Serial No. 7,845
 Bacen (2019a)
 GDP Monthly GDP in Dollars (U$) – (Logarithmized)
 Serial No. 4,385
 Exchange Bacen (2019a)
 Real effective exchange rate index (IPCA) – Jun/1994=100
 Rate Serial No. 11,752
 Interest rate - Overnight/Selic rate, daily accumulated values over Bacen (2019a)
 Selic
 the month. Serial No. 4,390
 Central government primary result – total revenue – 2003 prices – Bacen (2019a)
 Receita_gov
 (Logarithmized) Serial No. 7,544
 Stock Index – Dow Jones – Closing – Economic Value –
 Dow_Jones Ipeadata (2019)
 GM366_DOW366 (Logarithmized)
 Bacen (2019a)
Ibovespa_t-1 Ibovespa - monthly percentage change – % – 1-period lag
 Serial No. 7,832
 NFSP without exchange devaluation (% GDP) – current monthly
 Bacen (2019a)
 NFSP flow – nominal result – external – federal government and central
 Serial No. 5,310
 bank – %
 Increasing value that receives value 1 in the first period of the series
 Trends
 and is increased by +1 over each period.
Source: prepared by the authors (2019).

 The “Ibovespa” variable is the main stock market index. It has been created in 1968 and,
over 50 years, has established itself as a reference for investors around the world. It is the most
important indicator of average performance of the most traded and representative assets of the
Brazilian stock market (Bmf&Bovespa, 2019).
 According to Brondani, Baggio, Agudo and Sanjuán (2013), Ibovespa is intended to serve
as an average indicator of stock market behavior. Thus, its composition seeks to approximate as
closely as possible to the actual configuration of on demand trades.
 As seen in Table 2, the variables that did not represent rates have been logarithmized
(natural logarithm - NL), which can be interpreted by their elasticities. Thus, Equation 1 presents
the proposed empirical model.

 = 0 + 1 + 2 + 3 + 4
 + 5 + 6 Δ _ − 1 + 7 Equation (1)
 + 8 ê +
 = 1,2 … 195

 In which Ibovespa is explained by: (1) GDP; (2) the exchange rate; (3) the Selic interest
rate; (4) government revenue; (5) the Dow Jones stock index; (6) the Ibovespa percentage
change lagged in one period; (7) the variation of NFSP; and (8) the trend (Table 2).
 Revista Catarinense da Ciência Contábil, ISSN 2237-7662, Florianópolis, SC, v. 19, 1-15, e2892, 2020
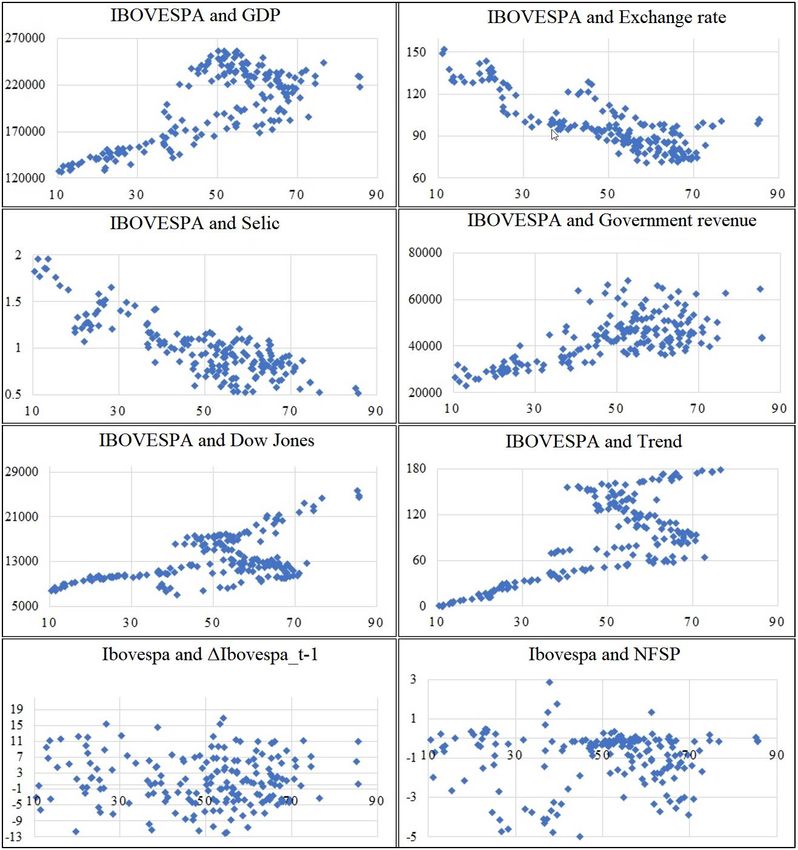
6 of 15
 Luan Vinicius Bernardelli, Gustavo Henrique Leite de Castro

4 RESULTS
 Table 3 presents a summary of the data used, informing the number of observations,
mean, standard deviation and the maximum and minimum values. It is noteworthy that, as
described in the methodology, the variables that did not represent rates have been logarithmized.

Table 3
Mean, standard error, minimum and maximum sample values
 Variable Average Standard error Minimum Maximum
ln_Ibovespa 10.76 0.45 9.23 11.48
ln_PIB 11.79 0.45 10.67 12.33
Exchange rate 99.40 18.55 71.76 160.19
Selic 0.97 0.33 0.47 2.08
ln_Receita government 11.10 0.19 10.64 11.90
ln_Dow Jones (1) 0.005 0.03 -0.15 0.09
ΔIbovespa_t-1 1.34 6.49 -24.80 16.97
NFSP -1.00 2.98 -14.02 6.02
Trends 98 52.97 1 195
Source: prepared by the authors (2019).
Notes: (i) the value (1) means that the variables are in first difference, ie, ( −1 − ).

 The data presented in Table 3 show that the Ibovespa indicator presented a high disparity
in relation to its minimum and maximum value. Namely, the minimum value of the sample has
been recorded at 10,280 points in February 2003 and the maximum value was of 97,393 points in
January 2019. This result points toward a rising trend in the series as the minimum value is
found at the beginning of the sample and the maximum value in the last month of analysis.
 Regarding the real exchange rate, the maximum found value was March 2003, while the
minimum value refers to July 2011. Regarding the Selic rate, the maximum value is July 2003
and the minimum value is March 2019. As far as government revenue is concerned, there were
no significant changes in actual taxpaying power.
 As can be seen in Figure 1, the previous behavior presented for the variables is partially
in line with the theoretical framework presented in the previous sections, as a positive
relationship has been identified for GDP, government revenues and the Dow Jones Index, and a
negative relationship for the interest rate. The variables NFSP and Ibovespa variation, lagged in
one period, do not present clear correlation.

 Revista Catarinense da Ciência Contábil, ISSN 2237-7662, Florianópolis, SC, v. 19, 1-15, e2892, 2020
7 of 15
 Stock market and macroeconomic variables: evidence for Brazil

Figure 1. Correlation between variables applied in empirical analysis
Source: Prepared by the authors (2019).

 Although correlations do not provide clear evidence on the relationships of variables, this
is an initial step before making estimates by the econometric model. The next step is to verify
stationarity, that is, if the series develops randomly over time around a constant average. The
theoretical concepts evidenced in section 3 have been employed. Table 4 presents the results of
the increased Dick-Fuller (ADF) and Phillips Perron (PP) tests.

Table 4
ADF and PP tests for the study variables
 VARIABLE TERM EST_T 1% 5% 10% DECISION
 Ibovespa c -3.03 -3.47 -2.88 -2.58 Stationary
 GDP c -2.68 -3.47 -2.88 -2.58 Stationary
 ADF Exchange rate c -3.59 -3.47 -2.88 -2.58 Stationary
 Selic c,t -2.17 -4.01 -3.44 -3.14 Non-stationary
 Government revenue c -1.11 -3.47 -2.88 -2.58 Non-stationary

 Revista Catarinense da Ciência Contábil, ISSN 2237-7662, Florianópolis, SC, v. 19, 1-15, e2892, 2020
8 of 15
 Luan Vinicius Bernardelli, Gustavo Henrique Leite de Castro

 Dow Jones c,t -1.55 -4.01 -3.43 -3.14 Non-stationary
 Dow Jones (1) c,t -12.85 -4.01 -3.43 -3.14 Stationary
 ΔIbovespa_t-1 c -11.93 -3.47 -2.88 -2.58 Stationary
 NFSP c -8.58 -3.47 -2.88 -2.58 Stationary
 Ibovespa c -2.92 -3.47 -2.88 -2.58 Stationary
 GDP c -2.88 -3.47 -2.88 -2.58 Stationary
 Exchange rate c -2.70 -3.47 -2.88 -2.58 Stationary
 Selic c,t -3.41 -3.47 -2.88 -2.58 Stationary
 PP Government revenue c -9.15 -4.00 -3.43 -3.14 Stationary
 Dow Jones c,t -1.87 -4.01 -3.43 -3.14 Non-stationary
 Dow Jones (1) c,t -12.93 -4.01 -3.43 -3.14 Stationary
 ΔIbovespa_t-1 c -11.91 -3.47 -2.88 -2.58 Stationary
 NFSP c -8.69 -3.47 -2.88 -2.58 Stationary
Source: prepared by the authors (2019).
Note: (i) variables with the term “(1)” indicate that they were lagged at first difference; (ii) the trend variable is
stationary in level; (iii) the Kwiatkowski-Phillips-Schmidt-Shin (KPSS) test was also applied to the Selic and
Revenue variable, confirming that it has a stationary behavior.

 Based on t-statistic and its respective critical value in the ADF test, it can be verified that
at a level of 1% of significance, the variables exchange, NFSP and Ibovespa_t-1 are stationary in
level, that is, the null hypothesis is rejected: H0 (there is a unit root, whether the time series is
not stationary, or it has a stochastic tendency), as are the assumptions made in the
methodological section, while Ibovespa variables and government revenue are stationary at a
significance level of 5%. However, the Dow Jones variable required the first difference lag to
become stationary at significance levels of 1% and 5%. Since this variable has been
logarithmized, the first difference indicates the rate of change from one period to another, ie, the
series' growth rate. It is noteworthy that the Selic and Government variables were not stationary
in the ADF test, so, as a decision criterion, the KPSS test has been performed, which indicates
that the series were stationary. Thus, Table 5 presents the regression results.

Table 5
Regression result
Variable Coefficient Standard error T-test
GDP (1) 0.143* (0.082) 1.74
Exchange rate −0.007*** (0,001) -6.29
Selic −0.117*** (0,039) -3.03
Government revenue 0.051** (0,023) 2.20
Dow Jones (1) 0.495*** (0,077) 6.41
Trends 0.006*** (0,002) 4.02
ΔIbovespa_t-1 0.002*** (0,000) 3.82
NFSP 0,002 (0,001) 1.63
Constant 8.666*** (0,985) 8.79
Notes 195 Original Durbin-Watson: 0.70
R-squared 0.885 Durbin-Watson transformed: 1.93
Source: Prepared by the authors (2019).
Notes: (ii) variables with the term “(1)” indicate that they were lagged in the first difference; (ii) Notes: *** p
9 of 15
 Stock market and macroeconomic variables: evidence for Brazil

quality of the fit in the model, however, in order to test the variables utilized based on the
literature presented in the previous section, we decided to keep the proposed model, in order to
empirically verify their relationship with the Ibovespa. The test value of Durbin-Watson
transform indicates that the autocorrelation problem was solved by using the regression method
Prais-Winsten.

5 DISCUSSION
 The results presented in the previous section provide important background for evaluating
the assumptions set out in the introductory section. Initially, we noted that the found coefficients
of the macroeconomic variables, presented in Table 5, present a behavior similar to what the
literature predicts. For example, in relation to economic activity, represented by the GDP
variable, the activity is positively related to the Ibovespa index (Aga & Kocaman, 2006), as it
acts as a source of funds for private investments. Similar result to the one obtained by Oliveira
(2006), which also shows the positive relationship between GDP and the stock market index for
Brazil, Germany, Singapore, Spain, Italy and the United Kingdom. The results are justified by
the fact that if economic activity increases, as a consequence companies tend to earn higher
profits, pay higher dividends and, consequently, increase demand in the stock market
(Bernardelli et al., 2017). It should be noted that the research by Machado et al. (2018) pointed
to a negative relationship between GDP and stock market returns.
 In relation with the exchange rate, the application of the proposed methodology found a
negative result for the exchange variation, that is, if an increase in the real exchange rate occurs,
a reduction in the stock market index is expected. Similar result was found by Bernardelli and
Bernardelli (2016), Bernardelli et al. (2017), and Santana et al. (2018). It is important to mention
that most studies show a negative relationship between the exchange rate and the stock market,
except for the study by Machado et al. (2018), which found a long-term positive relationship
between the exchange rate and the stock market return. One explanation for this result (negative
relationship) is provided by Bernardelli et al. (2017), who attribute the negative impact of the
exchange rate to the fact that much of the investments come from the international market and an
increase in the exchange rate may inhibit such action.
 Regarding the interest rate, the results suggest a negative relationship. Similar to what
was substantiated by Oliveira (2006), Geske and Roll (1983), Bernardelli and Bernardelli (2016),
Bernardelli et al. (2017) and Santana et al. (2018), indicate a direct negative relationship
between the interest rate and the stock exchange. This result is understandable from an economic
point of view as the interest rate is taken as an opportunity cost to the investor, ie the surplus
agent may choose to allocate its resources to stock market securities or fixed income securities
that are pegged to it. Directly or indirectly at the interest rate; as interest rates rise, the
opportunity cost increases, leading to an expected reduction in stock market demand. However,
studies by Chen (2009) for the United States and Machado et al. (2018) for Brazil pointed to a
long-term positive relationship between interest rate and stock market return, both in the upward
and downward regimes.
 The government revenue variable was statistically significant, so it has explanatory
power over the Ibovespa variations, as presented in the research by Franzen et al. (2009). This
analysis found that an increase in government revenues positively impacts the Ibovespa. This
variable proved to be a proxy for measuring the level of economic activity and its relationship
with the Ibovespa.
 As for the variable introduced to capture the relationship between the international and
the Brazilian stock market (the Dow Jones index), the result presented shows that there is a
negative relationship, as advocated by Farias and Sáfadi (2009) and Vartanian (2012). In this
study the relationship was positive, thus, the increase in the Dow Jones index tends to positively
affect the Ibovespa. The justification for this is due to the reaction of domestic investors to

 Revista Catarinense da Ciência Contábil, ISSN 2237-7662, Florianópolis, SC, v. 19, 1-15, e2892, 2020
10 of 15
 Luan Vinicius Bernardelli, Gustavo Henrique Leite de Castro

certain behaviors of international investors. However, some local events affect only the national
market, as already pointed out by Oliveira and Medeiros (2009), Angelico and Oliveira (2016)
and Silva Ribeiro, Leite and Justo (2016). Thus, it is not possible to reject the initially
established hypothesis that the international stock market is positively correlated with the
Ibovespa. Similar results were found in the studies by Gaio et al. (2014) for Brazil.
 The trend variable included in the regression aims to capture an upward or downward
trend in the Ibovespa index. The result shows an increasing trend in the period analyzed, so that,
regardless of the other variables, the Ibovespa index tends to grow. While testing the variable
ΔIbovespa_t-1, a positive relationship has been found, showing that the previous performance of
the variable in question is taken into account in the decision making of the investment,
characterizing the backward-looking process (Bouvatier & Lepetit, 2008; Dantas, Micheletto,
Cardoso, & Sá, 2017). However, this relationship is not significant between the variation of the
Ibovespa of the previous period and the current Ibovespa, since the coefficient presented is of
low scale. Again, it is not possible to reject the hypothesis that there is a growing trend of the
Brazilian stock market over the analyzed period.
 Finally, the results of the variable representing the government's financial stability level,
NFSP, were not statistically significant, unlike the expected result and supported by Vieira
(2004), Franzen et al. (2009), Santos and Coelho (2010) and Sanvicente (2015). However, it may
have an indirect relationship, since for the government to finance itself, it is necessary to sell
securities with a higher rate of return than the market, which leads investors to migrate from the
stock market (Ibovespa) to the securities market (Souza, 2006). Finally, the initially established
hypothesis that central government fiscal stability is related to the Ibovespa is rejected.

6 FINAL CONSIDERATIONS
 The good development of the financial market is fundamental for nations and contributes
significantly to companies, especially with regard to financing for productive investment. In this
sense, this work is relevant because it performs a theoretical analysis of the main studies related
to the interconnection between the stock market and the macroeconomic variables. Altogether
with the theoretical survey, we proposed an empirical study covering Brazil from 2003 to 2019,
which made possible to correlate the results found with the literature on this subject.
 Although the theme has been analyzed by several studies in Brazil, there was a gap in
empirical applications by not testing variables related to government stability, the performance
of international markets, as well as by testing the own inertia of this indicator. Thus, this paper
fills a gap in the literature by considering the importance of macroeconomic variables such as
GDP, interest rate and exchange rate, as well as contemplating other less studied variables, but
which are relevant to the decision making of agents, such as economic factors, such as the Dow
Jones Index, the central government financial stability indicator, and Ibovespa behavioral
variables, such as the trend and past performance.
 The found results were relevant, given that, for the GDP, interest rate and exchange rate
variables, the estimates pointed to a behavior according to the literature, being the first positively
and the second and third negatively correlated, even in a recessive economic context. Thus, it is
not possible to reject the hypothesis that macroeconomic variables are correlated with the stock
market. Regarding the Dow Jones index, the result shows a strong lagged positive relationship
between the indicator and the Ibovespa, which does not allow for rejecting the hypothesis that
the international market is positively correlated with the Ibovespa. This result is especially
important for investors, as a variation in the international stock market is expected to change in
the same direction over the subsequent period in the Brazilian stock market. With respect to the
trend variable, estimates indicate a positive trend in the Brazilian stock market, which makes it
impossible to reject the hypothesis that there is a growing trend in the stock market in Brazil.

 Revista Catarinense da Ciência Contábil, ISSN 2237-7662, Florianópolis, SC, v. 19, 1-15, e2892, 2020
11 of 15
 Stock market and macroeconomic variables: evidence for Brazil

 Finally, in relation to the government revenue and public sector borrowing (NFSP)
variables, the results show that while government revenues are positively related to the Ibovespa,
there is no statistically significant relationship between the NFSP variable and the index. This
allows us to reject the hypothesis that central government fiscal stability is related to the
Ibovespa. For future studies, a plausible management to identify the relationship between the
federal government's fiscal stability and the Ibovespa is to test other state financial stability
variables (net debt and gross debt), or even country risk variables (Emerging Markets Bond
Index Plus, Credit Default Swap and Rating).
 In addition to the macroeconomic scenario, the good performance of the stock market
depends to a large extent on the performance of listed companies. In this sense, one of the
limitations found in this paper is the non-use of accounting variables of the companies that make
up the Brazilian stock market.
 Thus, it is evident that stock markets are of fundamental importance to the world's
economies and their operation is complex and intriguing. In this context, the understanding of
the mechanisms that affect stock market performance is of great interest to investors, companies,
managers, public policy makers, among other economic agents. In Brazil, special interest is
given to the understanding of such factors, given the appreciation of the stock market in Brazil
that has occurred in recent years. In this sense, this study provides important evidence on the
impact of macroeconomic variables on stock market valuation, generating significant
contributions to the literature in question. Thus, the suggestion for the continuation of this work
is to analyze, together, macroeconomic and accounting variables via the panel data technique,
which will allow us to estimate the influence of the company's accounting variables on its market
value.

REFERENCES
Aga, M., & Kocaman, B. E. R. N. A. (2006). An empirical investigation of the relationship
 between inflation, P/E ratios and stock price behaviors using a new series called Index-20 for
 Istanbul Stock Exchange. International Research Journal of Finance and Economics, 6(3),
 133-165.

Aggarwal, R. (1981). Exchange rates and stock prices: A study of U.S. capital markets under
 floating exchange rates. Akron Business and Economics Review, 22(2), 7-12.

Angelico, D. G., & de Oliveira, S. C. (2016). Modelo ARMA-GARCH e precedência temporal
 entre índices acionários. Revista Gestão da Produção, Operações e Sistemas, 11(1), 97.

Arantes, F., & Lopreato, F. (2017). O novo consenso em macroeconomia no Brasil: a política
 fiscal do plano real ao segundo governo Lula. Revista de Economia Contemporânea, 21(3), 1-
 34.

BACEN, Banco Central do Brasil. (2019a). Sistema Gerenciador de Séries Temporais.
 Recuperado em 28 junho, 2019, de https://www3.bcb.gov.br/sgspub

BACEN, Banco Central do Brasil. (2019b). Manual de Estatísticas Fiscais. Recuperado em 02
 setembro, 2019, de https://www.bcb.gov.br/ftp/infecon/Estatisticasfiscais.pdf

Bernardelli, L. V., & Bernardelli, A. G. (2016). Análise sobre a Relação do Mercado Acionário
 com as Variáveis Macroeconômicas no Período de 2004 a 2014. Revista Evidenciação
 Contábil & Finanças, 4(1), 4-17.

 Revista Catarinense da Ciência Contábil, ISSN 2237-7662, Florianópolis, SC, v. 19, 1-15, e2892, 2020
12 of 15
 Luan Vinicius Bernardelli, Gustavo Henrique Leite de Castro

Bernardelli, L. V., Bernardelli, A. G., & Castro, G. H. L. de (2017). A Influência das Variáveis
 Macroeconômicas e do Índice de Expectativas no Mercado Acionário Brasileiro: Uma
 Análise Empírica para os Anos de 1995 a 2015. Revista de Gestão, Finanças e
 Contabilidade, 7(1), 78-96.

BMF&BOVESPA, Bolsa de Valores, Mercadorias e Futuros. (2019). Índice Bovespa (Ibovespa).
 Recuperado em 28 junho, 2019, de
 http://www.bmfbovespa.com.br/pt_br/produtos/indices/indices-amplos/indice-bovespa-
 ibovespa.htm

Boucher, C. (2006). Stock prices, inflation and stock returns predictability. Finance, 27(2), 71-
 101.

Bouvatier, V., & Lepetit, L. (2008). Banks procyclicality behavior: does provisioning matter?
 Journal of International Financial Markets, Institutions and Money, 18(5), 513-526.

Brondani, E. L. A., Baggio, D. K., Agudo, L. F., & Sanjuán, I. M. (2013). Influência do índice
 Dow Jones industrial average sobreo índice Ibovespa. Horizontes Empresariales, 12(2), 23-
 44.

Bueno, R. L. S. (2011). Econometria de Séries Temporais. (2. ed.). São Paulo: Cengage
 Learning.

Chamberlain, S., Howe, J. S., & Popper, H. (1997). The exchange rate exposure of US and
 Japanese banking institutions. Journal of banking & finance, 21(6), 871-892.

Chen, N. F. (1991). Financial investment opportunities and the macroeconomy. The Journal of
 Finance, 46(2), 529-554.

Chen, S. S. (2009). Predicting the bear stock market: Macroeconomic variables as leading
 indicators. Journal of Banking & Finance, 33(2), 211-223.

Clare, A. D., & Thomas, S. H. (1994). Macroeconomic Factors, the APT and the UK
 Stockmarket. Journal of Business Finance & Accounting, 21(3), 309-330.

Dantas, J. A., Micheletto, M. A., Cardoso, F. A., & Sá, A. A. P. F. de (2017). Perdas em crédito
 nos bancos brasileiros: modelos de perdas esperadas e de perdas incorridas e impactos da
 IFRS 9. Revista de Gestão, Finanças e Contabilidade, 7(2), 156-175.

Durigan Júnior, C. A., Saito, A. T., Bergmann, D. R., & Fouto, N. M. M. (2018). Fatores
 macroeconômicos, indicadores industriais e o spread bancário no Brasil. Revista de Ciências
 da Administração, 51(20), 26-41.

Farias, H. P., & Sáfadi, T. (2009). Causalidade entre as principais bolsas de valores do
 mundo. Revista de Administração Mackenzie (Mackenzie Management Review), 11(2).

Franzen, A., Meurer, R., Gonçalves, C. E. S., & Seabra, F. (2009). Determinantes do fluxo de
 investimentos de portfólio para o mercado acionário brasileiro. Estudos Econômicos (São
 Paulo), 39(2), 301-328.

 Revista Catarinense da Ciência Contábil, ISSN 2237-7662, Florianópolis, SC, v. 19, 1-15, e2892, 2020
13 of 15
 Stock market and macroeconomic variables: evidence for Brazil

Gaio, L. E., Ambrozini, M. A., Bonacim, C. A. G., & Junior, T. P. (2014). Interdependência
 entre os mercados mundiais de ações: uma análise de volatilidades. Revista Base
 (Administração e Contabilidade) da UNISINOS, 11(3), 259-274.

Geske, R., & Roll, R. (1983). The fiscal and monetary linkage between stock returns and
 inflation. The journal of Finance, 38(1), 1-33.

Greene, W. (2012). Econometric analysis. (7. ed.). New York: Pearson.

Grôppo, G. S. (2004). Causalidade das variáveis macroeconômicas sobre o Ibovespa.
 Dissertação de mestrado, Escola Superior de Agricultura Luiz de Queiroz, USP, Piracicaba,
 SP, Brasil.

Grôppo, G. (2005). Relações dinâmicas entre um conjunto selecionado de variáveis
 macroeconômicas e o Ibovespa. Revista de Economia e Administração, 4(4).

Gujarati, D. N., & Porter, D. C. (2011). Econometria Básica (5. ed.). Porto Alegre: Bookman.

Islam, S. M., & Watanapalachaikul, S. (2003). Time series financial econometrics of the Thai
 stock market: a multivariate error correction and valuation model. Global Finance, 10(5), 90-
 127.

Issam, S. A., Abdalla, & Victor, M. (1997). Exchange rate and stock price interactions in
 emerging financial markets: evidence on India, Korea, Pakistan and the Philippines. Applied
 financial economics, 7(1), 25-35.

Kumar, P. (2008). Is Indian Stock Market Related with Exchange Rate and Inflation? An
 Empirical Test Using Time Series. An Empirical Test Using Time Series (October 14, 2008).

Kwon, C. S., & Shin, T. S. (1999). Cointegration and causality between macroeconomic
 variables and stock market returns. Global Finance Journal, 10(1), 71-81.

Machado, M. R. R., Gartner, I. R., & Machado, L. (2018). Relação entre Ibovespa e Variáveis
 Macroeconômicas: Evidências a Partir de um Modelo Markov-Switching. Revista Brasileira
 de Finanças, 15(3), 435-468.

Maysami, R. C., & Koh, T. S. (2000). A vector error correction model of the Singapore stock
 market. International Review of Economics & Finance, 9(1), 79-96.

Maysami, R. C., Howe, L. C., & Rahmat, M. A. (2004). Relationship between macroeconomic
 variables and stock market indices: Cointegration evidence from stock exchange of
 Singapore’s all-S sector Indices. Jurnal Pengurusan (UKM Journal of Management), 24.

Nieh, C. C., & Lee, C. F. (2001). Dynamic relationship between stock prices and exchange rates
 for G-7 countries. The Quarterly Review of Economics and Finance, 41(4), 477-490.

Oliveira, G. R., & Medeiros, R. O. (2009). Testando a Existência de Efeitos Lead-Lag entre os
 Mercados Acionários Norte-Americano e Brasileiro. BBR-Brazilian Business Review, 6(1).

Oliveira, J. C. T., & Frascaroli, B. F. (2014). Impacto dos fatores macroeconômicos na emissão
 de ações na bolsa de valores. Revista de Gestão, Finanças e Contabilidade, 4(1), 30-51.

 Revista Catarinense da Ciência Contábil, ISSN 2237-7662, Florianópolis, SC, v. 19, 1-15, e2892, 2020
14 of 15
 Luan Vinicius Bernardelli, Gustavo Henrique Leite de Castro

Oliveira, L. O. G. (2006). Análise Empírica da Relação Entre o Mercado Acionário e Variáveis
 Macroeconômicas: de 1972 a 2003. Recuperado em 28 junho, 2019, de
 www.tede.ufsc.br/teses/PCNM0125.pdf

Phylaktis, K., & Ravazzolo, F. (2005). Stock market linkages in emerging markets: implications
 for international portfolio diversification. Journal of International Financial Markets,
 Institutions and Money, 15(2), 91-106.

Pimenta Junior, T., & Higuchi, R. H. (2008). Variáveis macroeconômicas e o Ibovespa: um
 estudo da relação de causalidade. REAd-Revista Eletrônica de Administração, 14(2), 296-315.

Pimenta, T. P., & Scherma, F. R. (2010). Um estudo da influência entre o dólar e o ibovespa no
 período 1999-2003. GESTÃO. Org-Revista Eletrônica de Gestão Organizacional, 3(1).

Santana, H. N., de Lima, S. A., & Ferreira, B. P. (2018). 20 Anos de Real: uma análise da
 relação entre câmbio, inflação, taxa de juros e o Ibovespa. Revista Gestão & Tecnologia,
 18(2), 44-69.

Santos, J. O., & Coelho, P. A. (2010). Análise da relação risco e retorno em carteiras compostas
 por índices de bolsa de valores de países desenvolvidos e de países emergentes integrantes do
 bloco econômico BRIC. Revista Contabilidade & Finanças, 21(54), 23-37.

Sanvicente, A. Z. (2015). Relevância de prêmio por risco país no custo de capital das empresas.
 Revista de Administração Contemporânea, 19(spe), 38-52.

Silva, A., Silva Barbosa, J., & Ribeiro, F. (2016). Comportamento do Volume de Negociações e
 do Risco de Mercado antes e após os Resultados das Eleições Presidenciais em 2014: Um
 Estudo com Empresas Brasileiras de Capital Aberto. Revista Evidenciação Contábil &
 Finanças, 5(1), 39-55.

Silva Ribeiro, A. A., Leite, Á. R., & Justo, W. R. (2016). Análise de cointegração e causalidade
 entre variáveis macroeconômicas e o índice Dow Jones sobre o Ibovespa. Revista de
 Administração da Universidade Federal de Santa Maria, 9(1), 121-137.

Silva, F. M., & Coronel, D. A. (2012). Análise da Causalidade e Cointegração entre Variáveis
 macroeconômicas e o Ibovespa. Revista de Administração FACES Journal, 2(3) 31-52.

Silva, R., & Gamboa, U. R. de (2011). Regime fiscal e sustentabilidade da dívida pública
 brasileira-1986 a 2006. Revista Gestão & Políticas Públicas, 1(1), 250-280.

Soenen, L. A., & Aggarwal, R. (1989). Financial prices as determinants of changes in currency
 values. In 25th Annual Meetings of Eastern Finance Association, Philadelphia, 2(0), 2-2.

Soenen, L. A., & Hennigar, E. S. (1988). An analysis of exchange rates and stock prices – the
 US experience between 1980 and 1986. Akron Business and Economic Review, 19(4), 7-16.

Solnik, B. (1987). Using financial prices to test exchange rate models: A note. The journal of
 Finance, 42(1), 141-149.

 Revista Catarinense da Ciência Contábil, ISSN 2237-7662, Florianópolis, SC, v. 19, 1-15, e2892, 2020
15 of 15
 Stock market and macroeconomic variables: evidence for Brazil

Souza, N. A. (2016). Gestão estratégica do desenvolvimento endógeno: crescimento auto-
 sustentado exige novos investimentos. Interações, 8(13).

Vartanian, P. R. (2012). Impactos do índice Dow Jones, commodities e câmbio sobre o Ibovespa:
 uma análise do efeito contágio. Revista de Administração Contemporânea, 16(4), 608-627.

Vieira, F. V. (2004). Endividamento Público e Impactos sobre Fluxos de Capitais, Risco-País e
 Diferencial de Juros no Brasil (1995-2002): Modelo VAR e Testes de Causalidade. Análise
 Econômica, 22(42), 129-148.

Wu, C., & Su, Y. C. (1998). Dynamic relations among international stock markets. International
 Review of Economics & Finance, 7(1), 63-84.

 Revista Catarinense da Ciência Contábil, ISSN 2237-7662, Florianópolis, SC, v. 19, 1-15, e2892, 2020
You can also read