A National-Scale Assessment of Population and Built-Environment Exposure in Tsunami Evacuation Zones - MDPI
←
→
Page content transcription
If your browser does not render page correctly, please read the page content below
geosciences
Article
A National-Scale Assessment of Population
and Built-Environment Exposure in Tsunami
Evacuation Zones
Ryan Paulik 1, * , Heather Craig 2 and Benjamin Popovich 1
 1   National Institute of Weather and Atmospheric Research (NIWA), 301 Evans Bay Parade, Greta Point
     Wellington 6021, New Zealand; benjamin.popovich@niwa.co.nz
 2   National Institute of Weather and Atmospheric Research (NIWA), 10 Kyle Street, Riccarton,
     Christchurch 8011, New Zealand; heather.craig@niwa.co.nz
 *   Correspondence: ryan.paulik@niwa.co.nz

 Received: 30 June 2020; Accepted: 28 July 2020; Published: 30 July 2020

 Abstract: Evacuation zones are a critical tool for mitigating loss of life in tsunami events. In New
 Zealand, tsunami evacuation zones are implemented by emergency management agencies at regional
 or sub-regional scales, providing national coverage for populated coastlines at risk to tsunami
 inundation. In this study, we apply the exposure component of a risk model framework (RiskScape)
 to deliver a first national-scale assessment of New Zealand’s population and built-environment
 exposure in tsunami evacuation zones. Usually-resident populations, buildings, land and transport
 network components are identified at an asset level and enumerated at national and regional scales.
 Evacuation zones are occupied by just under 10% of New Zealand’s population, residing in 399,000
 residential buildings. These are supported by a further 5400 critical buildings and 6300 km of road
 transport network. Approximately 40% of exposed populations and buildings occupy evacuation
 zones expected to be inundated once every 500 years. This includes over 150,000 people in highly
 vulnerable age groups, i.e., children and elderly. The complex arrangement of built environments
 highlights a need for disaster risk managers to proactively identify and prepare populations for
 evacuation based on their vulnerability to harm from tsunami and ability to access resources for
 recovery after the event.

 Keywords: tsunami; evacuation; exposure; population; buildings; RiskScape

1. Introduction
     Population evacuation from tsunami is essential for preventing loss of life [1]. Tsunami have caused
over 250,000 deaths globally in the last 20 years, mostly from near-field events with short wave arrival
times [2,3]. In response, disaster risk management agencies and researchers have mapped tsunami hazard
threat areas [4] to establish evacuation zones [5]. Tsunami evacuation zones identify areas where a threat
to human safety requires people to leave inundation areas rather than sheltering in place. The zones are
now a critical risk-mitigation tool in tsunami-prone areas that educate coastal populations on tsunami
inundation threats and identify locations and routes for evacuation to safe areas [1,5].
     Evacuation zones are maps representing areas at risk to tsunami inundation. Delineating
evacuation zones requires methodologies for mapping inundation at different spatial scales [6].
Inundation mapping methods range from simple attenuation rules based on maximum wave height
at coast [7] to complex numerical modelling of tsunami wave propagation and inundation from
tsunamigenic sources [8,9]. Tsunami inundation scenarios can be mapped as deterministic ‘maximum
credible’ or single source events, or probabilistic events, representing numerous sources and tsunami

Geosciences 2020, 10, 291; doi:10.3390/geosciences10080291                 www.mdpi.com/journal/geosciences
Geosciences 2020, 10, 291                                                                          2 of 15

events. Evacuation zone boundaries are often defined from the inundation area expected from a
maximum tsunami run-up height or temporal recurrence interval.
      Comprehensive tsunami risk assessments apply models that analyze the exposure and vulnerability
of elements at risk (e.g., populations and assets) to estimate impacts from inundation hazards [10]. Risk
analysis in tsunami evacuation planning can characterize populations and built assets exposed
to inundation, then apply vulnerability models to quantify their damage response [1,11,12].
This determines where vulnerable populations (e.g., children and elderly) may experience harm
or evacuation difficulties, and impediments from secondary hazards such as building collapse, road
damage and debris. Despite recent advancements in understanding the evacuation response of
populations using methods such as agent based [13,14] or least-cost distance [15] models, few studies
investigate population and built-asset exposure or impacts in evacuation or hazard zones at national or
regional scales. This information is important for implementing a cohesive preparedness and response
to tsunami events [11].
      In New Zealand, tsunami evacuation zone implementation is prescribed by National Emergency
Management Agency (NEMA) guidelines [16]. The guideline provides a consistent national approach
for fifteen regional emergency management agencies (termed Civil Defence Groups) to map tsunami
evacuation zones, create public information for evacuation response and align tsunami evacuation
plans and processes with official tsunami warnings. In 2020, spatial maps of evacuation zones
are implemented by all agencies at regional or sub-regional scales, providing national coverage
for populated coastlines at risk to tsunami inundation. Publicly available evacuation zone maps
and recent government provision of open spatial data for built assets now provide an opportunity
to assess national- and regional-scale exposure of populations and built environments in tsunami
evacuation zones.
      This study presents a first national-scale assessment of New Zealand’s population and
built-environment exposure in tsunami evacuation zones. Here, we define exposure as the ‘location
of people, built assets and land that overlap with tsunami evacuation zones. We use the exposure
component of an analytical risk model framework, RiskScape [17], to enumerate population, built-land
and asset exposure in evacuation zones representing varying levels of tsunami threat. We present
exposure information at national and regional authority scales and discuss its implications for future
tsunami evacuation preparedness and response planning. This study contributes to the expansion of
global data and knowledge of population and built-environment exposure to tsunami hazards.

2. Materials and Methods

2.1. Regional Setting
     New Zealand’s location on the edge of the “Pacific Ring of Fire” creates exposure to numerous
tsunami sources. The country lies on the Australian and Pacific Plate boundary, with the Hikurangi
subduction margin a near-field source capable of producing local tsunami waves from great (MW > 8.0)
subduction earthquakes [18] (Figure 1a). This subduction margin poses the greatest concern to New
Zealand due to its potential for generating large waves and onshore flow depths (>5 m) with short
arrival times ( 8.0 expected to reach coastlines of New Zealand’s northern regions at least every
500 years [22]. Waves generated from this area could arrive within 4 h. In the last 150 years, three
tsunami generated by earthquakes off the Peru–Chile trench have caused inundation along New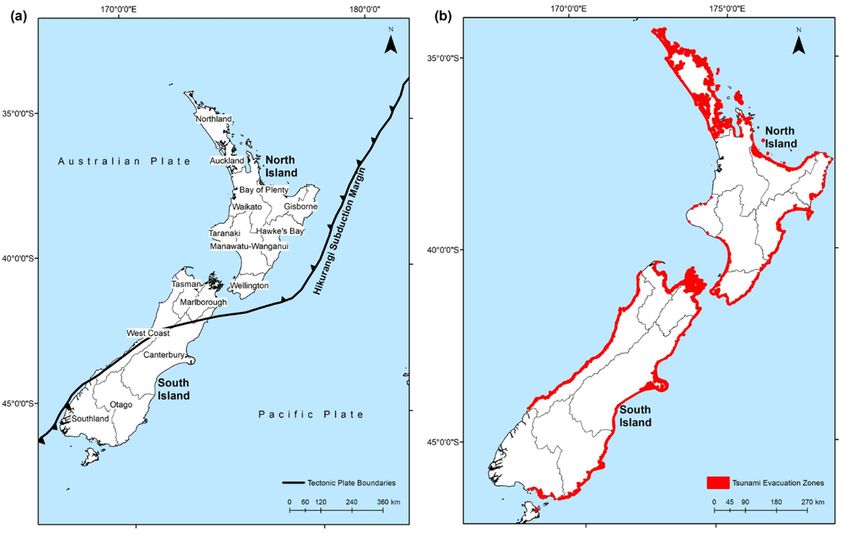
Geosciences 2020, 10, 291 3 of 15
Zealand’s eastern coastlines [23]. This source area poses the most frequent far-field tsunami hazard
Geosciences
threat, with2020, 10, x FOR
waves PEER REVIEW
typically reaching coastlines 12 to 15 h after generation [24]. 3 of 15
Figure 1. (a) New Zealand regional authority boundaries and (b) coastline coverage with mapped
Figure 1.evacuation
tsunami (a) New Zealand
zones. regional authority boundaries and (b) coastline coverage with mapped
tsunami evacuation zones.
New Zealand’s coastline is over 14,000 km in length and bordered by sixteen regional authorities
(FigureNew1a),Zealand’s coastline
administered is over
by fifteen 14,000 emergency
regional km in length and bordered
management by sixteen
agencies regional
(includes authorities
a joint agency
(Figure
for Nelson1a),andadministered by fifteen
Tasman regions). regional
Eighteen emergency
coastal towns and management agencies
cities, ranging in size(includes
from 10,000 a joint
to
agency for
1,675,000 Nelson
people, and Tasman
represent regions). Eighteen
approximately 70% of Newcoastal towns total
Zealand’s and cities, ranging
population. in sizepopulations
Coastal from 10,000
to 1,675,000
and built assetspeople, represent
are highly exposed approximately
to inundation70% of New
hazards such Zealand’s total population.
as coastal flooding and sea-level Coastal
rise.
Apopulations and built of
resident population assets areand
72,065 highly
more exposed to inundation
than 49,000 buildings hazards
could besuch
exposedas coastal flooding
to coastal and
flooding
sea-level
from rise. A resident
present-day 100 yearpopulation of 72,065
annual recurrence and more
interval (ARI) than 49,000sea
extreme buildings
levels (ESL could
100 )be exposed
[25]. A mean to
coastal flooding
sea-level rise of 1 from
m morepresent-day
than doubles 100 this
yearexposure
annual to recurrence
over 177,000 interval
people (ARI)
andextreme sea levels
125,000 buildings.
(ESL100low-lying
These ) [25]. A mean sea-level
populations andrise of 1 mare
buildings more than doubles
connected this exposure
by an extensive transportto over 177,000
network withpeople
over
and 125,000 buildings. These low-lying populations and buildings are connected
1400 km of roads, 86 km of railway and 13 international and domestic airports on land exposed to by an extensive
transport
ESL network
100 flooding. Aswith over 1400
present-day ESL km100 of roads, 86range
elevations km of railway
from 1.4 mand 13 m
to 4.2 international
around the New and domestic
Zealand
airports on
coastline land
[25], exposed
many to ESLthere
areas where 100 flooding. As present-day
are populations and builtESL 100 elevations
assets exposed range fromflooding
to coastal 1.4 m towill
4.2
m susceptible
be around the to New Zealand from
inundation coastline [25], many
near-field, areas
regional where
and there
far-field are populations
source tsunami. and built assets
exposed to coastal flooding will be susceptible to inundation from near-field, regional and far-field
2.2. Exposure
source tsunami.Mapping Methodology
The exposure analysis presented in this study applies the RiskScape multi-hazard risk model
2.2. Exposure
framework [17]. Mapping Methodology
RiskScape provides a modular framework configurable for analyzing tsunami
exposure
The exposure analysis presented in or
and impacts from deterministic probabilistic
this inundation
study applies scenarios.
the RiskScape The systemrisk
multi-hazard combines
model
hazard,
frameworkexposure
[17]. (i.e., elements
RiskScape at risk), and
provides vulnerability
a modular datasetsconfigurable
framework in a state-of-the-art softwaretsunami
for analyzing engine
that quantifies
exposure risk of exposure
and impacts or impact or
from deterministic at probabilistic
national to local scales. RiskScape
inundation is configured
scenarios. The here to
system combines
enumerate populations, built assets and land, and their geometric quantities exposed
hazard, exposure (i.e., elements at risk), and vulnerability datasets in a state-of-the-art software within tsunami
evacuation
engine thatzones (Figure
quantifies risk2).ofExposure
exposure model
or impactdatasets are described
at national to local in Section
scales. 2.3. andisSection
RiskScape 2.4.,
configured
and
hereassessment process
to enumerate in Section
populations, 2.5.assets and land, and their geometric quantities exposed within
built
tsunami evacuation zones (Figure 2). Exposure model datasets are described in Section 2.3. and
Section 2.4., and assessment process in Section 2.5.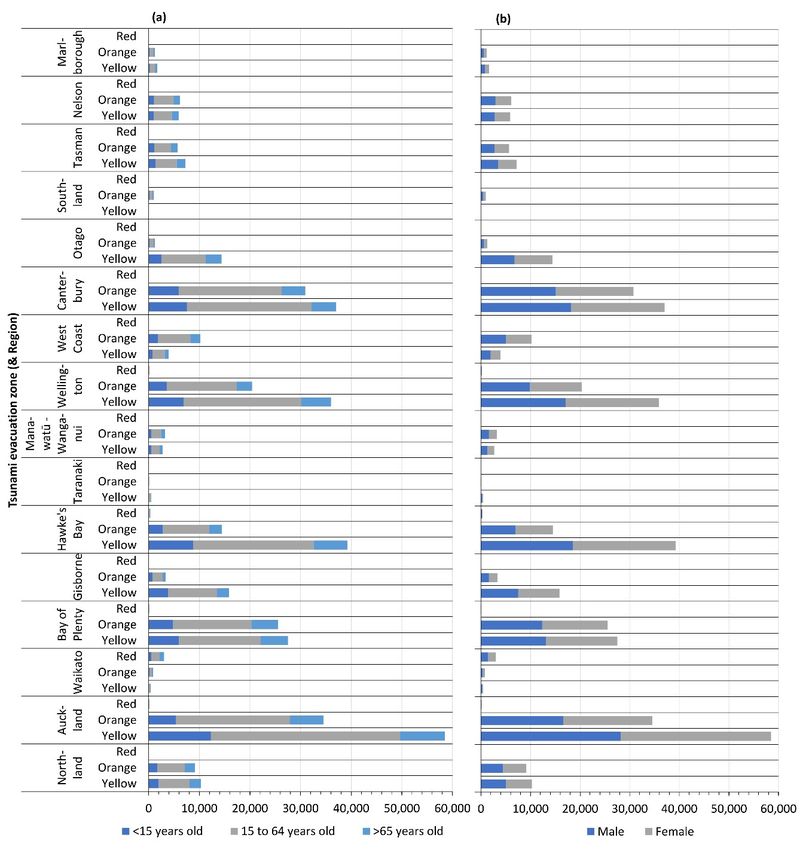
Geosciences 2020, 10, 291 4 of 15
Geosciences 2020, 10, x FOR PEER REVIEW 4 of 15
Figure 2. Schematic representation of the RiskScape exposure model framework and workflow applied
Figure 2. Schematic representation of the RiskScape exposure model framework and workflow
in this study.
applied in this study.
2.3. Tsunami Evacuation Zone Maps
2.3. Tsunami Evacuation Zone Maps
New Zealand’s fifteen regional emergency management agencies have mapped tsunami
New Zealand’s
evacuations zones for fifteen
coastlinesregional
in theiremergency
jurisdictional management
areas (Figure agencies
1b). Tsunamihave mapped
evacuation tsunami
zones
evacuations
are required zones for coastlines
to be consistent withinNEMA
their jurisdictional
guidelines, areas promoting (Figure 1b). Tsunami
a nationally evacuation
consistent zones
approach
are required to be consistent with NEMA guidelines, promoting a
for mapping zones [16]. Constraints on technical capacity, data and tools for tsunami inundationnationally consistent approach for
mapping zones
modelling, however,[16].meanConstraints on technical
that a range of inundation capacity,
mappingdata methods
and toolsare forrequired
tsunamito inundation
determine
evacuation zones. These range from simple ‘bathtub’ models or attenuation rules through todetermine
modelling, however, mean that a range of inundation mapping methods are required to complex
evacuationmodelling
numerical zones. These range from simple
of tsunamigenic sources, ‘bathtub’ models or attenuation
wave propagation rules through
and inundation. NEMA to complex
guidelines
numerical
account formodelling of tsunamigenic
these methodological sources,
variations, wave propagation
providing a framework andwith
inundation. NEMA guidelines
four developmental levels
account for these methodological variations, providing a framework
that evaluate model complexity and reliability for tsunami evacuation zone mapping [16]. with four developmental levels
that evaluate model complexity and reliability for tsunami evacuation
‘Level One’ inundation models apply a bathtub approach, where maximum wave amplitude zone mapping [16].
‘Level
heights One’ inundation
are projected inland tomodels
derive apply
a run-up a bathtub approach, where
height. Evacuation maximumstate
zone guidelines wavethatamplitude
this is a
heights are projected inland to derive a run-up height. Evacuation
least preferred approach as it does not consider tsunami behaviour such as attenuation as the zone guidelines state that this is a
wave
least preferred
moves approach
inland. ‘Level Two’as models
it does notapply consider tsunami
a rule-based behaviour method,
attenuation such as attenuation
whereby run-up as thelimits
wave
moves inland. ‘Level Two’ models apply a rule-based attenuation
and inundation areas are estimated from decreasing wave amplitude heights with distance inland. method, whereby run-up limits
andinstance,
For inundationthese areas
modelsare may
estimated
apply from decreasing wave
a 1% attenuation rule toamplitude heights
estimate inland runwith distance
up that inland.
corresponds
Forwave
to instance,
heightthese
decreasemodels
by 1 m mayfor apply
every 100 a 1% attenuation
m inland. ‘Levelrule Two’tomodels
estimate inland
intend run up that
to determine an
corresponds to wave height decrease by 1 m for every 100 m inland.
interim inundation area while further resources and bathymetric and topographic details are gathered ‘Level Two’ models intend to
determine an interim inundation area while further resources and
to allow for model refinement. These models are applied region-wide to delineate evacuation zones forbathymetric and topographic
details are gathered
Northland, Taranaki,toManawatu-Wanganui,
allow for model refinement. Nelson, These models areWest
Marlborough, applied region-wide
Coast, Otago and to coastline
delineate
evacuation zones for Northland, Taranaki, Manawatu-Wanganui,
segments in the Waikato, Hawkes Bay and Wellington regions (Table S1). ‘Level Three’ modelling Nelson, Marlborough, West Coast,is
Otago and
applied coastline segments
in Auckland, Gisborne,inHawkes
the Waikato, Hawkes Bay
Bay, Wellington and Wellington
(harbour coastlines) regions (Table S1). where
and Canterbury, ‘Level
Three’ modelling
deterministic tsunamiis applied in Auckland,
inundation scenariosGisborne,
are simulated Hawkes usingBay, Wellington
complex (harbourmodels
physics-based coastlines)
that
and Canterbury, where deterministic tsunami inundation scenarios
combine seismic source, propagation and inundation models (Table S1). These models incorporate are simulated using complex
physics-based
factors such as models
seismic that combine
trigger seismic source,
characteristics, propagation
land surface roughnessand and
inundation
small-scale modelswater (Table
flowsS1).to
These models incorporate factors such as seismic trigger characteristics,
derive inundation areas and evacuation zone maps. ‘Level Four’ models apply probabilistic seismic, land surface roughness and
small-scale water
propagation flows to derive
and inundation modelsinundation
to deriveareas and evacuation
an ‘envelope’ zoneinundation
of tsunami maps. ‘Level Four’
over an models
annual
apply probabilistic
recurrence interval to seismic, propagation
represent evacuation andzones.
inundation models
This level to derive an
of modelling ‘envelope’
is rarely applied of tsunami
in New
inundation
Zealand dueover
to itsancomplexity
annual recurrence interval
and financial to represent
resource evacuation zones. This level of modelling
requirements.
is rarely
Newapplied
Zealand in tsunami
New Zealand due tozones
evacuation its complexity
correspond andtofinancial
tsunamiresource
inundation requirements.
risk levels. Three
zones are identified: the ‘red zone’—low-lying land up to two meters elevation aboverisk
New Zealand tsunami evacuation zones correspond to tsunami inundation mean levels. Three
high water
zones are identified: the ‘red zone’—low-lying land up to two meters
springs (MHWS); the ‘orange zone’—the expected inundation area from a 500 year annual recurrence elevation above mean high
water springs
interval (MHWS);
(ARI) event with the ‘orange
a travel timezone’—the
of greater than expected
an hour;inundation
and the area
‘yellowfrom a 500 year
zone’—the annual
expected
recurrence interval (ARI) event with a travel time of greater than an hour;
area inundated in a 2500 year return period event with an 84% confidence level, or larger magnitude and the ‘yellow zone’—the
expected area
near-field event inundated
[16]. Zone inboundaries
a 2500 yearmay return be period
adjusted event withwith
to align an 84% confidence
linear features, level,
such as or roads,
larger
magnitude
before beingnear-field
communicated event to[16].
theZone
public boundaries
(Figure 3a). may be adjusted
Tsunami to align
evacuation zonewithmapslinear
for features,
New Zealand such
as roads, before being communicated to the public (Figure 3a).
regions are openly accessible from emergency management agencies on request or through ArcGIS Tsunami evacuation zone maps for
New Zealand regions are openly accessible
REST (Representational State Transfer) servers (Table S1). from emergency management agencies on request or
through ArcGIS REST (Representational State Transfer) servers (Table S1).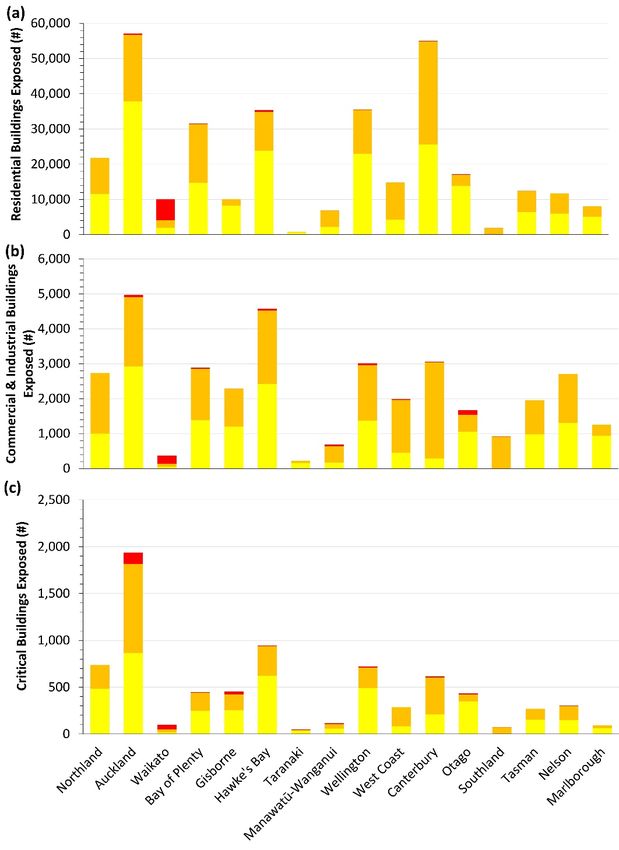
Geosciences 2020, 10, 291                                                                              5 of 15
 Geosciences 2020, 10, x FOR PEER REVIEW                                                                5 of 15

     Figure 3. Tsunami evacuation zones and building exposure for Napier City (Hawke’s Bay, North Island,
      Figure 3. Tsunami evacuation zones and building exposure for Napier City (Hawke’s Bay, North
     New Zealand), showing (a) red, orange and yellow zones; and (b) buildings exposed in each zone.
      Island, New Zealand), showing (a) red, orange and yellow zones; and (b) buildings exposed in each
      zone.
2.4. Built-Environment Maps

 2.4. Built environments
      Built-Environment    are considered here as land areas above MHWS used for human activities.
                         Maps
Spatial maps representing built-environment elements in tsunami evacuation zones were obtained
       Built environments are considered here as land areas above MHWS used for human activities.
from government and open access data sources (Table S2). Elements representing ‘built assets’ were
 Spatial maps representing built-environment elements in tsunami evacuation zones were obtained
limited to buildings and transport network components (roads, railway, airports) (Table 1). These built
 from government and open access data sources (Table S2). Elements representing ‘built assets’ were
assets were considered important for the congregation or movement of at-risk populations within
 limited to buildings and transport network components (roads, railway, airports) (Table 1). These
evacuation zones. ‘Built land’ representing ‘built-up’ (i.e., settlements, infrastructure) and ‘primary
 built assets were considered important for the congregation or movement of at-risk populations
production’ land areas identified in the 2018–2019 summer period is also included [26]. Built land
 within evacuation zones. ‘Built land’ representing ‘built-up’ (i.e., settlements, infrastructure) and
and assets are geometrically represented as either vector polygons or lines with location and sizes
 ‘primary production’ land areas identified in the 2018–2019 summer period is also included [26]. Built
approaching 1:10,000 scale. Buildings and transport network components are identified at the asset
 land and assets are geometrically represented as either vector polygons or lines with location and
level; however, physical and non-physical information were limited to attributes with consistent
 sizes approaching 1:10,000 scale. Buildings and transport network components are identified at the
information at this level (Table 1; Table S2). Inconsistent attribute information allowed only for reliable
 asset level; however, physical and non-physical information were limited to attributes with consistent
reporting of counts or linear extents for railways and airports.
 information at this level (Table 1; Table S2). Inconsistent attribute information allowed only for
      Use category and usually-resident population attributes were included in the analysis as contextual
 reliable reporting of counts or linear extents for railways and airports.
information for buildings. Twelve categories representing residential and non-residential buildings
       Use category and usually-resident population attributes were included in the analysis as
were spatially joined to individual building outlines from available national datasets (Table S2) [27].
 contextual information for buildings. Twelve categories representing residential and non-residential
Residential building use categories informed attribution of usually-resident populations. Statistics New
 buildings were spatially joined to individual building outlines from available national datasets (Table
Zealand performs a national population census including the count, age and gender of people usually
 S2) [27]. Residential building use categories informed attribution of usually-resident populations.
living in residences stated in the March 2013 census [28]. Usually-resident populations are aggregated
 Statistics New Zealand performs a national population census including the count, age and gender
to meshblock areas occupied by 0 to 1899 people, and divided into both age (65 years) and basic gender (male, female) groups. Meshblock populations were used to calculate
 populations are aggregated to meshblock areas occupied by 0 to 1899 people, and divided into both
building population density rates by dividing the total meshblock population by the total meshblock
 age (65 years) and basic gender (male, female) groups. Meshblock
residential building outline area (i.e., people/m2 ). Population densities were then multiplied by the
 populations were used to calculate building population density rates by dividing the total meshblock
outline area of each residential building object to estimate the usually-resident building population.
 population by the total meshblock residential building outline area (i.e., people/m2). Population
 densities were then multiplied by the outline area of each residential building object to estimate the
 usually-resident building population.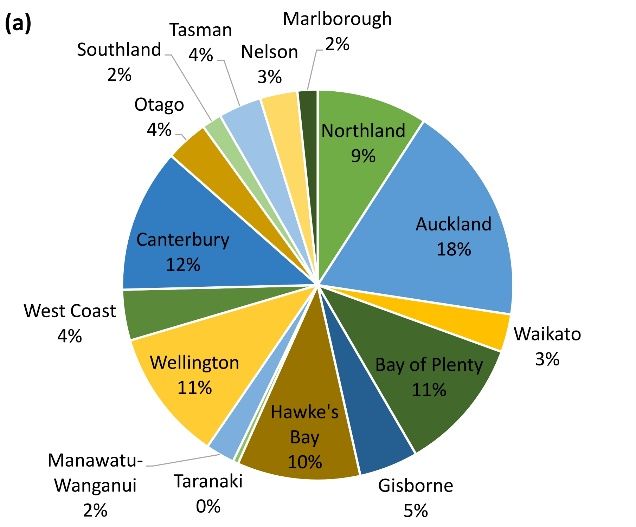
Geosciences 2020, 10, 291                                                                                       6 of 15

                       Table 1. Built-environment elements at risk and contextual information.

      Element
                        Object Type       Attributes        Units         Geometry               Data Owner
      Category
                                         Use Category,                                       Government
        Land                Land Cover                      km2            Polygon
                                             Area                                          Research Institute
                                                                                          Government Research
                                          Population                                        Institute, Central
      Buildings              Building    (age, gender),       -            Polygon         Government, Local
                                         Use Category                                         Government,
                                                                                              Private Sector
                                          Length, Use
                              Roads         Category         km              Line         Central Government
      Transport                          Traffic Volume
                             Railway         Length         km              Line          Central Government
                             Airports         Area          km2            Polygon        Central Government

2.5. Exposure Assessment
     Tsunami evacuation zones were combined with built-environment population, built-land and
asset maps in RiskScape [17] to enumerate exposure metrics at the asset level. RiskScape applies
geoprocessing functions to intersect vector geometries representing evacuation zones, built-land and
assets, and regional authority jurisdictional boundary locations, then recalculate geometric units for
built-land and assets located within each evacuation zone and regional authority boundary. In this
study, population, built-land and asset exposure in evacuation zones is aggregated from asset level to
national and regional authority scale, and reported for vector polygon counts (#), polygon area (km2 )
and line length (km).

3. Results
     In this section, we present information on regional-scale population (Section 3.1.) and
built-environment (Section 3.2.) land (Section 3.2.1.), and asset (Section 3.2.2.) exposure in tsunami
evacuation zones. Exposure information is reported for ‘red’, ‘orange’ and ‘yellow’ zones, as prescribed by
national guidelines [16]. National-scale exposure for evacuation zones are presented in Table 2, and raw
data for regional-scale exposure provided in Table S3.

3.1. Population
     Over 430,000 people, nine percent of New Zealand’s population, reside in tsunami evacuation
zones (Table 2). Of these, nearly 40% (>170,000 people) occupy ‘red’ and ‘orange’ zones, expected to be
exposed to tsunami inundation within a 500 year ARI. Population exposure in these zones is highest in
Auckland (34,693), Canterbury (30,943) and Bay of Plenty (25,681). Larger urban coastal populations
in these regions are exposed to tsunami from regional (i.e., Tonga-Kermadec trench and Hikurangi
subduction margin) and far-field (i.e., Peru–Chile trench) sources. Wave arrival times for regional
source events may provide populations in these regions with less than 4 h for evacuation. Hawke’s
Bay has the highest regional population (12,800) in ‘red’ and ‘orange’ zones. The region is also at risk
to near-field tsunami preceded by an earthquake on the Hikurangi subduction margin may provide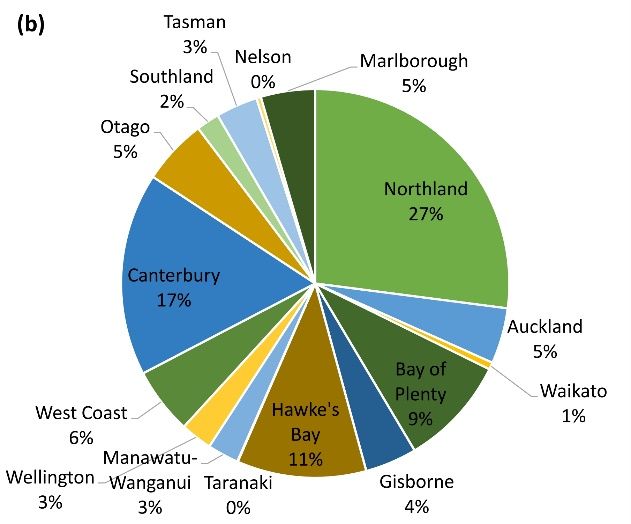
Geosciences 2020, 10, 291                                                                                         7 of 15

      New Zealand has approximately 209,000 people who self-identified as male and 224,000 people
self-identified as female residing in tsunami evacuation zones. The largest variance in gender exposure
occurs in Auckland, where 3500 more females are exposed in evacuation zones (Figure 4b). In addition,
the Bay of Plenty, Hawke’s Bay and Wellington regions each have over 2000 more women than
men exposed.

3.2. Built Environments

3.2.1. Land
     New Zealand tsunami evacuation zones cover a built-land area of 2709 km2 . This area consists
of 354 km2 ‘built-up’ land (i.e., settlements, infrastructure) and 2355 km2 ‘primary production’ land
(Table 2). More than half of exposed land is located within ‘red’ or ‘orange’ zones.
     Most built-up land in evacuation zones occurs in New Zealand’s most populous regions (Figure 3a).
North Island east coast regions including, Auckland (18%), Bay of Plenty (11%) and Hawke’s Bay (10%)
account for nearly 40% of built-up land exposure, covering 116 km2 (Figure 5a). Built land within
Hawke’s Bay evacuation zones is vulnerable to tsunami inundation from near-field sources with short
wave-arrival times (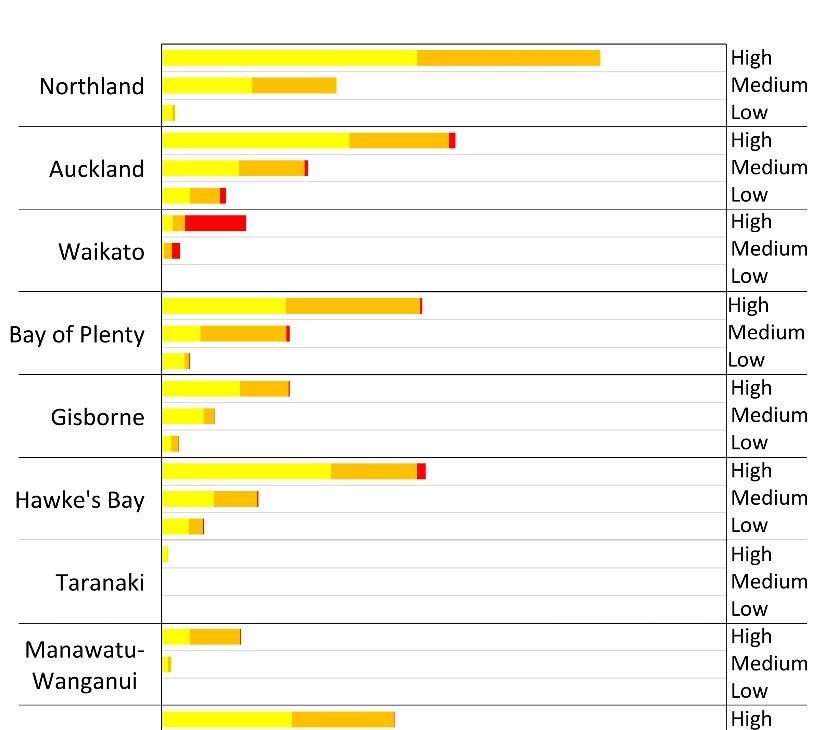
Geosciences 2020, 10, 291                                                                                         8 of 15
      Geosciences 2020, 10, x FOR PEER REVIEW                                                               8 of 15

      Figure  4. Regional
           Figure          population
                  4. Regional populationexposure
                                         exposure by
                                                  by (a) age; and
                                                     (a) age;  and(b)
                                                                   (b)gender
                                                                       genderin in  ‘red’,
                                                                                 ‘red’,    ‘orange’
                                                                                        ‘orange’ and and  ‘yellow’
                                                                                                     ‘yellow’
      tsunami  evacuation
           tsunami         zones.
                   evacuation zones.
       Geosciences 2020, 10, x FOR PEER REVIEW                                                              9 of 15
      3.2. Built Environments

      3.2.1. Land
           New Zealand tsunami evacuation zones cover a built-land area of 2709 km2. This area consists
      of 354 km2 ‘built-up’ land (i.e., settlements, infrastructure) and 2355 km2 ‘primary production’ land
      (Table 2). More than half of exposed land is located within ‘red’ or ‘orange’ zones.
           Most built-up land in evacuation zones occurs in New Zealand’s most populous regions (Figure
      3a). North Island east coast regions including, Auckland (18%), Bay of Plenty (11%) and Hawke’s Bay
      (10%) account for nearly 40% of built-up land exposure, covering 116 km2 (Figure 5a). Built land
      within Hawke’s Bay evacuation zones is vulnerable to tsunami inundation from near-field sources
      with short wave-arrival times (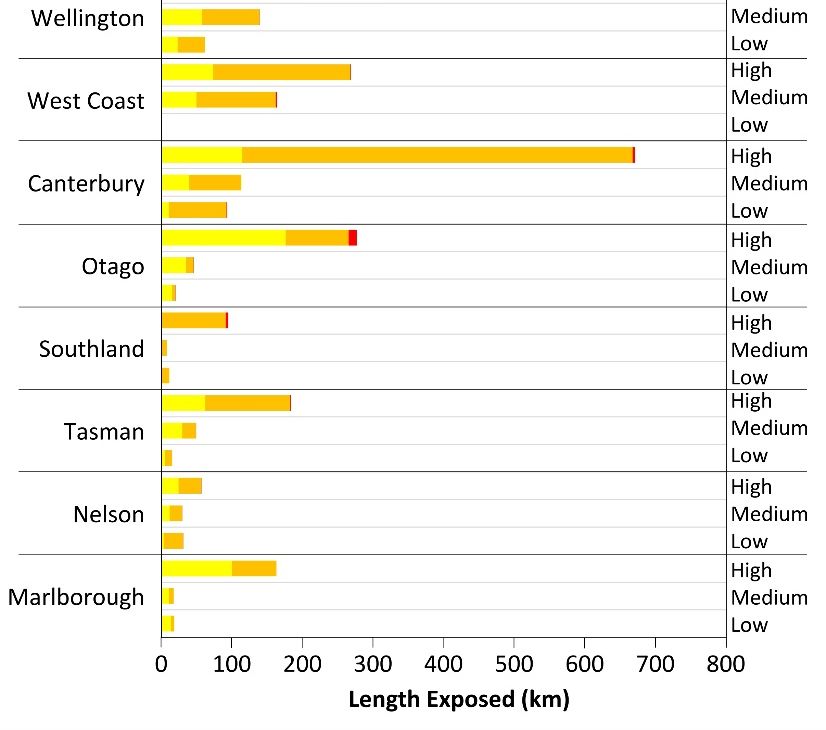
Geosciences 2020, 10, 291                                                                           9 of 15

     Land used for primary production activities such as pastoral farming and horticulture has higher
exposure in North Island evacuation zones (1408 km2 ). Over one-third of this land exposure occurs in
Northland (616 km2 ) and exceeds 200 km2 in both Hawke’s Bay (245 km2 ) and Bay of Plenty (209 km2 )
(Figure 5b). In Hawkes Bay, over 35 km2 is located the ‘red’ zone. South Island production land is most
highly exposed in Canterbury (385 km2 ). Canterbury (13 km2 ) and Otago (12 km2 ) regions, bordering
the South Island east coast, observe similar levels of ‘red’ zone exposure for primary production land.

3.2.2. Building and Infrastructure Assets
       In New Zealand, over 490,000 buildings are constructed in tsunami evacuation zones, with 215,722
(43%) in ‘red’ or ‘orange’ zones (Table 2; Table S3). Residential uses represent 81% of total building
 exposure. These buildings also represent the location of most people considered as New Zealand’s
 usually-resident population in this study. Residential building exposure is higher east coast regions on
 both islands, and exceeds 50,000 in Auckland and Canterbury, New Zealand’s two most populous
 regions. Waikato region (5983) has the highest residential exposure in ‘red’ zones, followed by Hawke’s
 Bay (547) (Figure 6a). Red-zone buildings in these regions are susceptible to tsunami generated from
 regional or near-field sources with typical wave arrival times between 30 min and 3 h. Although no
 retirement home buildings are exposed in ‘red’ zones, 139 are exposed in ‘orange’ zones. ‘Orange’ zone
 retirement buildings are mostly located in Auckland (81) and Hawkes Bay (36). These facilities are
 usually occupied by persons >65 years old and therefore, represent a higher potential risk for human
 harm during tsunami events.
       Most evacuation zone buildings used for commercial (10,965) or industrial (29,444) purposes are
 in New Zealand’s most populous regions: Auckland, Wellington, and Christchurch (Figure 6b). In the
 South Island, most commercial and industrial buildings in Canterbury (>90%) are located in ‘orange’
 zones. In the North Island, lower levels of building exposure ‘orange’ zones are observed though
 several regions (i.e., Auckland, Bay of Plenty, Hawkes Bay, Wellington) exceed 2000 buildings across
 all zones.
       Critical buildings, such as hospitals, emergency management and government buildings often
 designated for emergency response and recovery activities from tsunami events total 8949 in evacuation
 zones for New Zealand (Table 2). Hospital and medical building exposure totals 195 in ‘red’ and
‘orange’ zones, with a further 229 emergency management buildings. Auckland (1485) has considerably
 higher critical building exposure than other North Island regions, including 136 buildings in the ‘red’
 zone (Figure 6c; Table S3). In the South Island, Canterbury (410) has the highest critical building
 exposure in ‘red’ (15) and ‘orange’ (395) zones. Over 1000 educational buildings are exposed in these
 zones across New Zealand. Many educational buildings will be occupied by people 10,000 vehicles/day) highway networks are most extensively exposed in Auckland (91 km)
 and Canterbury (93 km). A little more than 11 km of high-volume roads are exposed in ‘red’ zones
(Table 2), with 8.4 km located in the Auckland region. On the South Islands east coast, Canterbury has
 more than 80 km of high-volume national highway road exposure in ‘orange’ zones (Figure 7). Daily
 traffic volumes on national highways respectively exceed 25,000 and 15,000 vehicles per day in urban
 and rural areas.
       Most international and domestic airports in New Zealand are located on flat, low-lying land close
 to coastlines. Twenty-three airports are built in evacuation zones, mostly located in ‘yellow’ zones (18)
(Table S3). Five airports in ‘orange’ zones are used for domestic purposes with commercial services
Geosciences 2020, 10, 291 10 of 15 for business and tourism (Hawke’s Bay, Southland, West Coast) or recreational and charter flights (Canterbury and West Coast). Dual international and domestic airports in Auckland and Wellington are located in ‘yellow’ zones. ‘Yellow’ zones in the Wellington region represent areas potentially at risk to tsunami inundation from near-field sources with short (10,000 vehicles/day) highway networks are most extensively exposed in Auckland (91 km) and Canterbury (93 km). A little more than 11 km of high-volume roads are
Geosciences 2020,
Geosciences       10, x291
            2020, 10,   FOR PEER REVIEW                                                                             11 of
                                                                                                                    11 of 15
                                                                                                                          15

      Figure 7.
     Figure     Regional road
             7. Regional   road exposure
                                exposure within
                                          within ‘red’,
                                                  ‘red’, ‘orange’
                                                          ‘orange’ and
                                                                   and ‘yellow’
                                                                        ‘yellow’ tsunami
                                                                                 tsunami evacuation
                                                                                          evacuation zones
                                                                                                     zones for
                                                                                                            for
     ‘high’ (>10,000   vehicles/day), ‘medium’ (>3000     vehicles/day)  and  ’low’ (10,000 vehicles/day), ‘medium’ (>3000 vehicles/day) and 'low’ (
Geosciences 2020, 10, 291 12 of 15 land and assets at national and regional scales. Population and built-asset exposure mostly occurs on land expected to be at risk to tsunami inundation from either a 500 year ARI event with a travel time of greater than an hour (i.e., ‘orange’ zone), or a 2500 year return period event with an 84% confidence level, or larger magnitude near-field event (i.e., ‘Yellow’ Zone). Our analysis shows that just under 10% of New Zealand’s usually-resident population reside in evacuation zones, with over 150,000 people representing children and elderly age groups. These groups are acutely vulnerable to harm, observing high mortality rates in global tsunami events [29]. Vulnerable populations also occupy the 165,000 residential buildings in zones potentially at risk from inundation within a 500 year ARI, i.e., ‘orange’ zones. New Zealand’s residential buildings are predominantly low rise (i.e., 5000) for regions with major urban areas (>50,000 people) located on eastern coastlines including, Auckland, Bay of Plenty, Hawkes Bay and Canterbury. These age groups are proportionately highest for North Island east coast regions such as Waikato, Bay of Plenty, Gisborne and Hawkes Bay, where coastal settlements attract residents of retirement age (>65 years). In these regions, evacuations could be further complicated from a higher likelihood of tsunami from near-field or regional source events, with wave arrival times (
Geosciences 2020, 10, 291                                                                                    13 of 15

evacuation planning including, requirements for detailed investigations to delineate evacuation zones
based on hazard and risk.
      While this study delivers a first national-scale assessment of population and built-environment
exposure in New Zealand tsunami evacuation zones, information on human and built-asset impacts and
criticality of the latter is not provided. Several local- to regional-scale assessments have been performed
using vulnerability models (i.e., fragility functions) with high-resolution inundation maps and
built-asset spatial data to quantify tsunami impacts including physical building damage [10,12,32,33].
This information is critical for identifying threats to evacuation zone populations by secondary hazards
such as building collapse. The asset-level analysis presented here enabled exposure to be quantified
for evacuation zones and reported at scales consistent with emergency management decision making.
However, incomplete or inconsistent asset-level attribute information across multiple built-asset
types would have limited a subsequent analysis of impacts for built-environment assets. A focus on
developing tsunami risk model frameworks that comprise reliable asset-level datasets, high-resolution
inundation maps and standardized human and built-asset vulnerability models will improve national-
and regional-scale evacuation zone impact assessments that inform measures to evacuate people from
future tsunami events.

5. Conclusions
      This study presents a first national-scale assessment of New Zealand’s population and
built-environment exposure in tsunami evacuation zones. We applied the exposure component
of a risk model framework (RiskScape) to enumerate populations, built-land and asset exposure in
evacuation zones. New Zealand has national-scale coverage for populated coastlines at risk to tsunami
inundation. Most zones are delineated using simple rule-based attenuation methods to map inundation
threats. The multi-zone maps representing tsunami evacuation zones were suitable for regional-scale
exposure analysis to inform a national-scale assessment.
      New Zealand has considerable population, built-land and asset exposure in tsunami evacuation
zones. Our analysis shows that just under 10% of New Zealand’s population residing in 399,000
residential buildings are in evacuation zones. These are supported by a further 5400 critical buildings
and 6300 km of road transport network. Approximately 40% of exposed populations and buildings
occupy evacuation zones expected to be inundated within a 500 year recurrence interval. This includes
over 150,000 people representing highly vulnerable age groups, i.e., children and elderly. These age
groups are proportionately higher in North Island east coast regions, with a higher likelihood of
tsunami from near-field or regional source events producing wave arrival times (
Geosciences 2020, 10, 291 14 of 15
Funding: This study was funded by the National Institute of Water and Atmospheric research (NIWA) through
the New Zealand Government’s Science Strategic Investment Fund (SSIF), grant number CARH2006.
Acknowledgments: The authors gratefully acknowledge the provision of tsunami evacuation zone maps from
Auckland Council, Bay of Plenty Regional Council, Environment Canterbury, Gisborne District Council, Hawke’s
Bay Regional Council, Horizons Regional Council, Marlborough District Council, Nelson City Council, Northland
Regional Council, Otago Regional Council, Environment Southland, Taranaki Regional Council, Tasman District
Council, Waikato Regional Council, Greater Wellington Regional Council, and West Coast Regional Council. The
authors also thank and acknowledge the following organizations for data provision: LINZ (especially Daniel
Silk, for building footprints, airports, railway data), NZTA (road networks), Statistics NZ (population census),
Eagle Technology Group Ltd. (school, hospital, CDEM center, and emergency service locations), NIWA/GNS
Science (building use types), and Landcare Research (land cover database). We would also like to thank Dr Shaun
Williams (NIWA) for valuable discussions on New Zealand’s tsunami hazard record.
Conflicts of Interest: The authors declare no conflict of interest.
References
1. Scheer, J.S.; Varela, V.; Eftychidis, G. A generic framework for tsunami evacuation planning. Phys. Chem. Earth
2012, 49, 79–91. [CrossRef]
2. Imamura, F.; Boreta, S.P.; Suppasri, A.; Muhari, A. Recent occurrences of serious tsunami damage and the
future challenges of tsunami disaster risk reduction. Prog. Disast. Sci. 2019, 1, 100009. [CrossRef]
3. Gusiakov, V. Tsunami History. In The Sea; Harvard University Press: Cambridge, MA, USA, 2009; pp. 23–53.
ISBN 9780674031739.
4. Wegscheider, S.; Post, J.; Zosseder, K.; Mück, M.; Strunz, G.; Riedlinger, T.; Muhari, A.; Anwar, H.Z.
Generating tsunami risk knowledge at community level as a base for planning and implementation of risk
reduction strategies. Nat. Hazards Earth Syst. Sci. 2010, 11, 249–258. [CrossRef]
5. Kurowski, M.J.; Hedley, N.; Clague, J.J. An assessment of educational tsunami evacuation map designs in
Washington and Oregon. Nat. Hazards 2011, 59, 1205. [CrossRef]
6. Smart, G.M.; Crowley, K.H.M.; Lane, E. Estimating tsunami run-up. Nat. Hazards 2015, 80, 1933–1947.
[CrossRef]
7. Leonard, G.S.; Power, W.L.; Lukovic, B.; Smith, W.D.; Johnston, D.M.; Langridge, R.; Downes, G. Interim
Tsunami Evacuation Planning Zone Boundary Mapping for the Wellington and Horizons Regions Defined by a
GIS-Calculated Attenuation Rule; GNS Science: Wellington, New Zealand, 2009.
8. Imamura, F. Tsunami modeling: Calculating inundation and hazard maps. In The Sea: Tsunami; Bernard, E.I.,
Robinson, A.R., Eds.; Harvard University Press: London, UK, 2009.
9. Synolakis, C.E.; Bernard, E.N.; Titov, V.V.; Kânoğlu, U.T.K.U.; Gonzalez, F.I. Validation and Verification of
Tsunami Numerical Models. Pure Appl. Geophys. 2008, 165, 2197–2228. [CrossRef]
10. Goda, K.; De Risi, R. Multi-hazard loss estimation for shaking and tsunami using stochastic rupture sources.
Int. J. Dis. Risk Red. 2018, 28, 539–554. [CrossRef]
11. Freire, S.; Aubrecht, C.; Wegscheider, S. Advancing tsunami risk assessment by improving spatio-temporal
population exposure and evacuation modeling. Nat. Hazards 2013, 68, 1311–1324. [CrossRef]
12. Triantafyllou, I.; Novikova, T.; Charalampakis, M.; Fokaefs, A.; Papadopoulos, G.A. Quantitative Tsunami
Risk Assessment in Terms of Building Replacement Cost Based on Tsunami Modelling and GIS Methods:
The Case of Crete Isl., Hellenic Arc. Pure Appl. Geophys. 2019, 176, 3207–3225. [CrossRef]
13. Mas, E.; Koshimura, S.; Imamura, F.; Suppasri, A.; Muhari, A.; Adriano, B. Recent Advances in Agent-Based
Tsunami Evacuation Simulations: Case Studies in Indonesia, Thailand, Japan and Peru. Pure Appl. Geophys.
2015, 172, 3409–3424. [CrossRef]
14. Wang, H.; Mostafizi, A.; Cramer, L.A.; Cox, D.; Park, H. An agent-based model of a multimodal near-field
tsunami evacuation: Decision-making and life safety. Transp. Res. Part C Emerg. Technol. 2016, 64, 86–100.
[CrossRef]
15. Fraser, S.A.; Wood, N.J.; Johnston, D.M.; Leonard, G.S.; Greening, P.D.; Rossetto, T. Variable population
exposure and distributed travel speeds in least-cost tsunami evacuation modelling. Nat. Hazards Earth Syst.
Sci. 2014, 14, 2975–2991. [CrossRef]
16. Ministry of Civil Defence and Emergency Management. National Emergency Management Agency, Tsunami
Evacuation Zones: Director’s Guideline for Civil Defence Emergency Management Groups [DGL08/08]; Ministry of
Civil Defence and Emergency Management: Wellington, New Zealand, 2008.Geosciences 2020, 10, 291 15 of 15
17. Schmidt, J.; Matcham, I.; Reese, S.; King, A.; Bell, R.; Henderson, R.; Smart, G.; Cousins, J.; Smith, W.;
Heron, D. Quantitative multi-risk analysis for natural hazards: A framework for multi-risk modelling.
Nat. Hazards 2011, 58, 1169–1192. [CrossRef]
18. Clark, K.; Howarth, J.; Litchfield, N.; Cochran, U.; Turnbull, J.; Dowling, L.; Howell, A.; Berryman, K.;
Wolfe, F. Geological evidence for past large earthquakes and tsunamis along the Hikurangi subduction
margin, New Zealand. Mar. Geol. 2019, 412, 139–172. [CrossRef]
19. Fraser, S.A.; Power, W.L.; Wang, X.; Wallace, L.M.; Mueller, C.; Johnston, D.M. Tsunami inundation in Napier,
New Zealand, due to local earthquake sources. Nat. Hazards 2014, 70, 415–445. [CrossRef]
20. Power, W.; Wallace, L.; Wang, X.; Reyners, M. Tsunami Hazard Posed to New Zealand by the Kermadec
and Southern New Hebrides Subduction Margins: An Assessment Based on Plate Boundary Kinematics,
Interseismic Coupling, and Historical Seismicity. Pure Appl. Geophys. 2012, 169, 1–36. [CrossRef]
21. Power, W.; Downes, G.; Stirling, M. Estimation of Tsunami Hazard in New Zealand due to South American
Earthquakes. Pure Appl. Geophys. 2007, 164, 547–564. [CrossRef]
22. Power, W. Review of Tsunami Hazard in New Zealand (2013 Update); GNS Science: Wellington, New Zealand,
2013; pp. 1–222.
23. De Lange, W.P.; Healy, T.R. New Zealand tsunamis 1840–1982. N. Z. J. Geol. Geophys. 1986, 29, 115–134.
[CrossRef]
24. Borrero, J.C.; Goring, D.G. South American Tsunamis in Lyttelton Harbor, New Zealand. Pure Appl. Geophys.
2015, 172, 757–772. [CrossRef]
25. Paulik, R.; Stephens, S.A.; Bell, R.G.; Wadhwa, S.; Popovich, B. National-Scale Built-Environment Exposure
to 100-Year Extreme Sea Levels and Sea-Level Rise. Sustainability 2020, 12, 1513. [CrossRef]
26. Dymond, J.R.; Shepherd, J.D.; Newsome, P.F.; Belliss, S. Estimating change in areas of indigenous vegetation
cover in New Zealand from the New Zealand Land Cover Database (LCDB). N. Z. J. Econ. 2017, 41, 56–64.
[CrossRef]
27. Statistics New Zealand. 2013 Census Usually Resident Population Counts. Available online: http://archive.
stats.govt.nz/browse_for_stats/population/census_counts/2013CensusUsuallyResidentPopulationCounts_
HOTP2013Census.aspx (accessed on 25 February 2020).
28. Lin, S.-L.; Cousins, J.; King, A. Development of New Zealand exposure dataset for use in loss
modelling. In Proceedings of the Australian Structural Engineering Conference (ASEC), Brisbane, Australia,
22–25 November 2016; pp. 476–485.
29. González-Riancho, P.; Aliaga, B.; Hettiarachchi, S.; González, M.; Medina, R. A contribution to the selection
of tsunami human vulnerability indicators: Conclusions from tsunami impacts in Sri Lanka and Thailand
(2004), Samoa (2009), Chile (2010) and Japan (2011). Nat. Hazards Earth Syst. Sci. 2015, 15, 1493–1514.
[CrossRef]
30. Suppasri, A.; Mas, E.; Charvet, I.; Gunasekera, R.; Imai, K.; Fukutani, Y.; Abe, Y.; Imamura, F. Building
damage characteristics based on surveyed data and fragility curves of the 2011 Great East Japan tsunami.
Nat. Hazards 2013, 66, 319–341. [CrossRef]
31. Tarbotton, C.; Dall’Osso, F.; Dominey-Howes, D.; Goff, J. The use of empirical vulnerability functions to
assess the response of buildings to tsunami impact: Comparative review and summary of best practice.
Earth Sci. Rev. 2015, 142, 120–134. [CrossRef]
32. Paulik, R.; Lane, E.; Williams, S.; Power, W. Changes in Tsunami Risk to Residential Buildings at Omaha
Beach, New Zealand. Geosciences 2019, 9, 113. [CrossRef]
33. Weibe, D.M.; Cox, D.T. Application of fragility curves to estimate building damage and economic loss at a
community scale: A case study of Seaside, Oregon. Nat. Hazards 2014, 71, 2043–2061. [CrossRef]
© 2020 by the authors. Licensee MDPI, Basel, Switzerland. This article is an open access
article distributed under the terms and conditions of the Creative Commons Attribution
(CC BY) license (http://creativecommons.org/licenses/by/4.0/).You can also read