Evaluation of Electronic Health Records to Monitor Illness From Harmful Algal Bloom Exposure in the United States
←
→
Page content transcription
If your browser does not render page correctly, please read the page content below

A D V A N C E M E N T O F T H E SCIENCE

                               Evaluation of Electronic
                               Health Records to Monitor
                               Illness From Harmful Algal
                               Bloom Exposure in the
                               United States                                                                        Amy Lavery, MSPH, PhD
                                                                                                                        Lorraine Backer, PhD
                                                                                                                        Johnni Daniel, DHSc
                                                                                                   National Center for Environmental Health,
                                                                                                   Centers for Disease Control and Prevention

                                                                                                      Defining HAB exposure and related illness
    Abstract               Harmful algal blooms (HABs) are the rapid growth
                                                                                                   is difficult due to challenges with character-
                                                                                                   izing and reporting HAB contact (Backer
    of algae that can produce toxic or harmful effects in people and animals.                      et al., 2015; Bradley et al., 2013; Serrano et
    Potential health effects include respiratory illness, gastrointestinal illness,                al., 2015; Torbick et al., 2018). Electronic
    skin and eye irritation, and sometimes more severe toxic effects such as                       health records (EHRs) present an opportu-
    liver damage. Defining HAB exposure and related illness is challenging                         nity to study health encounters specifically
                                                                                                   related to HAB exposure through use of
    for many reasons, including characterizing the exposure. Large electronic                      medical diagnostic codes. Figure 1 presents
    health record databases present an opportunity to study health encounters                      the International Classification of Diseases
    specifically related to HAB exposure through querying medical diagnostic                       (ICD) codes available to classify HAB expo-
    codes. We queried the MarketScan Research Databases between January                            sures (ICD-9 and ICD-10) and toxic effects
                                                                                                   of HABs (ICD-10 only) during a medical
    2009 and April 2019 for use of the International Classification of Diseases
                                                                                                   encounter (hereafter referred to as HAB
    (ICD) codes for HAB exposure. We found a total of 558 records that used                        exposure codes). Important to note for this
    either the ICD-9 or ICD-10 code for HAB exposure. Respiratory illness                          analysis, we excluded HAB exposure related
    was most commonly reported along with the HAB exposure code. Use of                            to seafood poisonings and concentrated on
    HAB exposure codes showed seasonal fluctuations during 2012–2019.                              environmental exposures to HABs.
                                                                                                      Only one study has examined the utility
    We found that although the HAB-related ICD-9 and ICD-10 codes were
                                                                                                   of HAB exposure diagnostic codes; however,
    used infrequently, they were most often recorded during bloom seasons in                       the analysis was limited to the state of New
    warmer months. This analysis is the first that utilizes a large-scale national                 York and to the use of ICD-9 codes (medical
    database of de-identified health records to understand the use of medical                      facilities have been using ICD-10 codes since
    diagnostic codes related to algae exposure.                                                    2015) (Figgatt et al., 2016). It is unclear
                                                                                                   how these diagnostic codes are used across
                                                                                                   the U.S. and how the updated ICD-10 codes
                                                                                                   might result in different or improved HAB-
Introduction                                       severe toxic effects such as liver failure or   related illness classification.
Harmful algal blooms (HABs) are the rapid          paralysis (Centers for Disease Control and         If medical diagnostic codes for HAB expo-
growth of algae that can produce toxic             Prevention, 2020; Fleming et al., 2011;         sure are used effectively, EHRs could pro-
or harmful effects in people and animals           National Institute of Environmental Health      vide a platform for enhanced surveillance of
(National Oceanic and Atmospheric Admin-           Sciences, 2021). HABs are increasing in fre-    HAB exposures and related illnesses, includ-
istration, 2020). Short-term health effects        quency and duration within the U.S., pre-       ing potential assessment of long-term health
have been associated with HAB exposure             senting an increased risk for adverse health    effects. Additionally, assessing corresponding
through skin contact, ingestion, or inhala-        outcomes associated with exposure (Davis        procedure or laboratory codes used during the
tion of algal toxins. Health effects include       & Gobler, 2016). Information about the          medical encounter might provide insight into
respiratory illness, gastrointestinal illness,     prevalence and long-term health effects of      health effects that have not been extensively
skin and eye irritation, and sometimes more        HAB exposure is more limited.                   studied. The purpose of this study was to

8       Volume 83 • Number 9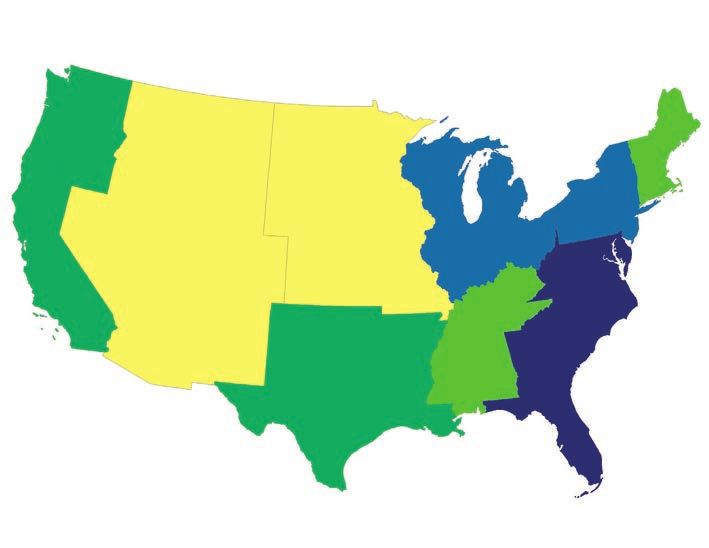
January 1, 2009, and December 31, 2018.
                                                                                                                      This study was exempt from Centers for Dis-
  FIGURE 1
                                                                                                                      ease Control and Prevention Institutional
  ICD Codes for Harmful Algal Bloom Exposure                                                                          Review Board approval because secondary
                                                                                                                      data were used and did not constitute human
                                  ICD-9 (Through September 2015)                                                      subject research.

                                                                                                                      Cohort Creation
                                                                                                                      Data were accessed for this project through
               E928.6: Environmental exposure to harmful algae and toxins
                                                                                                                      the online MarketScan Treatment Pathways
                                                                                                                      portal. In the portal, a cohort of records was
                                                                                                                      created in both the Commercial and Medic-
                                                                                                                      aid databases using the ICD-9 and ICD-10
               V87.32: Contact with and (suspected) exposure to algae bloom                                           HAB exposure codes for categories and sub-
                                                                                                                      categories (Figure 1).
                                                                                                                         The created cohorts then consisted of any
                                    ICD-10 (October 2015–Present)                                                     patient who had an ICD code of interest
                                                                                                                      along with an “index date” for when the code
                                                                                                                      was assigned. The index date corresponds to
               T65.82 (non-billable diagnosis): Toxic effect of harmful algae and algae
                                                                                                                      the first time that ICD code was used for that
               toxins, including T65.821 (A/D/S), T65.822 (A/D/S), T65.823 (A/D/S),
               and T65.824 (A/D/S)
                                                                                                                      person and was used to add that record into
                                                                                                                      the cohort. The two cohorts were then ana-
                                                                                                                      lyzed separately to compare results from the
               Z77.121:Contact with and (suspected) exposure to harmful algae                                         two databases.
               and algae toxins
                                                                                                                      Analysis
                                                                                                                      Data were analyzed using the MarketScan
  ICD = International Classification of Diseases; A = initial encounter; D = subsequent encounter; S = sequela.       Treatment Pathways portal, Excel, and Stata
                                                                                                                      statistical software version 15. Basic demo-
                                                                                                                      graphic information was summarized by
                                                                                                                      frequency of occurrence and percentage of
evaluate the use of ICD-9 and ICD-10 medical                        A convenience sample of claims records            the overall records within the cohort. The
diagnostic codes for HAB exposure across the                     across the U.S. was used to populate both            total number of records in the two databases
U.S. using a large, de-identified EHR database.                  databases. Records include physician office          (Commercial and Medicaid) was charted
                                                                 visits, hospital stays (inpatient and outpa-         by year and quarter to visualize changes in
Methods                                                          tient), pharmacy orders (outpatient phar-            occurrence over time and season. For the
                                                                 macy orders), and other healthcare services          Commercial database only, the number of
Description of Data Set and Study                                such as mental health care. Available vari-          events occurring by U.S. Census Bureau
Population                                                       ables in the Commercial database include             region was displayed and visualized using
We used the IBM MarketScan Research Data-                        age, sex, proximate events that occur on the         ArcMap version 10.5.1. Additional health
bases (IBM Watson Health), which contain                         same day as the event of interest, region of         events and procedures were evaluated and
de-identified healthcare claims data for indi-                   occurrence, cost of medical visit, and hos-          described that occurred on the index date
viduals with commercial insurance and some                       pitalization status including length of stay.        that the HAB exposure code was used.
Medicaid beneficiaries. The Commercial                           Available variables in the Medicaid database
Claims and Encounters Database (hereafter                        include age, sex, race, proximate events that        Results
referred to as Commercial database) contains                     occur on the same day as the event of inter-         A total of 558 records contained one of the
data from currently employed persons and                         est, cost of visit, and hospitalization status.      HAB exposure codes, including 380 records
their dependents, former covered employees                          For this analysis, we selected the two            in the Commercial database and 178 records
insured using the extended COBRA plans, and                      most recent data sets within MarketScan for          in the Medicaid database. Within the two
early retirees who are not eligible for Medicare                 Commercial and Medicaid claims. The most             databases, 366 records were coded using the
(IBM Watson Health, 2017). The Medicaid                          recent Commercial data set was available for         ICD-9 classifications while 192 were coded
Database includes data from several state-                       approximately 90 million people between              using the ICD-10 classifications. ICD-9 cod-
based Medicaid programs for individuals cov-                     January 1, 2012, and April 30, 2019. The             ing transferred to ICD-10 in October 2015
ered under the fee-for-service and managed                       most recent Medicaid data set was available          and ICD-10 was the only available coding
care plans (IBM Watson Health, 2017).                            for approximately 23 million people between          system starting in 2016.

                                                                                                                   May 2021 • Journal of Environmental Health     9
A D V A N C E M E N T O F T H E SCIENCE

   Table 1 shows the demographic makeup of
the records within the two cohorts. The major-
                                                        TABLE 1
ity of records were for individuals between the
ages of 18–44 (33%) and 45–64 (44%) in the              Demographic Characteristics of MarketScan Data Cohorts With
Commercial cohort and under the age of 18 in            Harmful Algal Bloom Exposure (ICD) Codes
the Medicaid cohort (62%). Although the cost
of a medical visit was somewhat low (median             Characteristic                          Commercial Claimsa                                   Medicaid Claimsa
was $122 for the Commercial cohort and $61                                                 January 1, 2012–April 30, 2019                      January 1, 2009–December 31,
for the Medicaid cohort), some visits cost sev-                                                                                                            2018
eral thousands of dollars for a hospital stay                                                   Count                  Frequency                   Count                   Frequency
lasting for >1 week. Within both cohorts, 144                                                 (N = 380)                   (%)                    (N = 178)                    (%)
people had a hospital inpatient or emergency            Age
department visit on the same day in which                   0–17                                  63                       16.6                      111                       62.3
the HAB exposure code was used. Due to the                  18–44                                125                       32.9                       45                       25.3
nature of the database, it is unclear if the hos-           45–64                                167                       43.9                       22                       12.4
pital stays were directly associated with the
                                                            ≥65                                   25                        6.6                        –                         –
HAB exposure code.
   Figure 2 shows the number of records                 Sex
with an HAB exposure code in both cohorts                   Female                               204                       53.7                       94                       52.8
by quarter and year, starting in 2012 when                  Male                                 176                       46.3                       84                       47.2
both data sets were available. Overall, 2014            Race
and 2018 were the years with the most use
                                                            Black                                  –                         –                        43                       24.2
of HAB exposure codes. As expected, more
                                                            Hispanic                               –                         –                        –b                        –b
HAB exposure code records occurred dur-
ing the spring and summer months (April–                   White                                   –                         –                       100                       56.2
September), which comprise quarters 2 and                   Other                                  –                         –                        –b                        –b
3 in Figure 2. The earlier years using ICD-9            Region
codes lacked pronounced peaks during quar-                  East North Central                    54                       14.2                        –                         –
ters 2 and 3 during 2012 and 2013, whereas
                                                            East South Central                    30                        7.9                        –                         –
the ICD-10 codes had more defined seasonal
peaks for the years with complete quarterly                 Middle Atlantic                       53                       13.9                        –                         –
reports. In 2018, a large peak was present                  Mountain                              21                        5.5                        –                         –
in quarters 3 and 4 corresponding with a                    New England                           25                        6.6                        –                         –
large-scale red tide event in August–Novem-                 Pacific                               34                        8.9                        –                         –
ber 2018. HAB exposure code use was more                    South Atlantic                       115                       30.3                        –                         –
prominent in the South Atlantic region, fol-
                                                           West North Central                      –b                       –b                         –                         –
lowed by the East North Central and Middle
Atlantic regions (Figure 3).                               West South Central                     38                       10.0                        –                         –
   Table 2 displays the top 5 diagnostic codes          Urban/rural
that were used for people on the same day                   Urban                                326                       85.8                        –                         –
that an HAB exposure code was used. Respi-                  Rural                                 49                       12.9                        –                         –
ratory events such as cough and shortness of            Inpatient or emergency                    66                       17.4                       78                       43.8
breath were most often used (16.3%). Codes              visits
documenting an allergy were used for 38                                                        Median                Interquartile                 Median                Interquartile
people (6.8%). The top 100 diagnostic codes                                                                             Range                                               Range
used at the same time as an HAB diagnosis               Cost of medical visit                  $122.34             $75.69–$200.82                  $61.16               $8.99–$105.09
code were grouped into common disor-                    (U.S. dollars)
ders associated with HAB exposure. These                Length of hospital stay                    4                       3–7                         –                         –
groupings included respiratory events (e.g.,            (days)c
asthma, shortness of breath); neurological
                                                        ICD = International Classification of Diseases.
events (e.g., headache, dizziness); gastro-             a
                                                          The Commercial claims database did not have data on race; the Medicaid claims database did not have data on region or
intestinal events (e.g., diarrhea, vomiting);           urban/rural residence.
and skin and eye irritation events (e.g., con-          b
                                                          Data suppressed due to small sample size.
junctivitis, rash). When combining cohorts,             c
                                                         Length of stay for any visits resulting in hospitalization. Only one person in the Medicaid database was hospitalized (4 days total).
approximately 207 individuals (37.1%) had

10      Volume 83 • Number 9
respiratory events recorded on the same
day an HAB code was used for them. Fewer
FIGURE 2
records listed neurological events such as
Count of Harmful Algal Bloom ICD Codes by Year From January 1, headaches and dizziness (n = 66, 11.8%); eye
2012–April 30, 2019, MarketScan Data or skin irritation (n = 61, 10.9%); or gastroin-
testinal events (n = 32, 5.7%).
40 Several procedures were listed for the same
days as the HAB exposure code visit. Many of
35
ICD-9 to ICD-10
the procedures documented were for overall
Transition medical evaluations. Several blood draw tests
30
were ordered as part of these medical work-
25
ups as well. For 29 individuals (5.2%) in the
cohort, an inhalation treatment was ordered
Count (#)
20 to assist with acute airway obstruction or dif-
ficulty breathing.
15
Discussion
10 MarketScan data provided an initial platform
to investigate the use of HAB exposure diag-
5 nostic codes across the U.S. While this data-
base is limited mostly to individuals insured
0 with commercial or employer-based plans,
Q1
Q2
Q3
Q4
Q1
Q2
Q3
Q4
Q1
Q2
Q3
Q4
Q1
Q2
Q3
Q4
Q1
Q2
Q3
Q4
Q1
Q2
Q3
Q4
Q1
Q2
Q3
Q4
Q1
the database provided >90 million Commer-
2012 2013 2014 2015 2016 2017 2018 2019 cial claims records and >20 million Medicaid
Year/Quarter claim records to review. The main finding
ICD = International Classification of Diseases; Q1 = January–March; Q2 = April–June, Q3 = July–September;
from this analysis is that ICD codes for HAB
Q4 = October–December. exposure are used infrequently. The data set,
however, provided an opportunity to exam-
ine whether the ICD-10 codes were used
more often or in a more specific way to docu-
ment HAB exposure than the ICD-9 codes.
FIGURE 3
Although a relatively small number of
Count of Harmful Algal Bloom ICD Codes by Region From January 1, records were available in this data set, Fig-
2012–April 30, 2019, MarketScan Data ure 2 shows that the use of HAB exposure
codes corresponds mostly to the time of
year that HAB events occurred, namely dur-
ing the warmer months when conditions are
New conducive to algal growth. Interestingly, we
Pacific
England observed a difference in age categories when
West comparing records in the Commercial data-
Middle
North
Atlantic base and the Medicaid database. A majority
Central East North
Mountain of the records in the Medicaid database with
Central
HAB exposure codes were for children and
teenagers under the age of 18 (62%) com-
pared with more records between the ages
East South
West South Atlantic of 18–64 in the Commercial database. It is
South Central unclear why we saw this difference between
Count Central
the two databases. As of 2019, approxi-
5–21 mately 71 million people in the U.S. were
22–30 covered under Medicaid, a large percentage
31–38 of whom are children (50%) (Mikulic, 2020).
39–54 Although the Commercial database contains
55–115 some dependents within it, it is possible that
ICD = International Classification of Diseases. not as many children are covered within this
database compared with the Medicaid data-
May 2021 • Journal of Environmental Health 11A D V A N C E M E N T O F T H E SCIENCE
base, although we could not validate this
assumption in our analysis.
Summarizing the other diagnostic codes that TABLE 2
were used at the same time as an HAB exposure Top 5 ICD-9 and ICD-10 Health Diagnostic Codes Associated With
code helped to identify common health com- a Harmful Algal Bloom Exposure Visit
plaints related to these exposures. As expected,
the most common ICD codes reported at the Event Name # of Frequency
same time as an HAB exposure code were Individuals (%)
those for respiratory events and were most ICD-9
likely associated with the presence of Karenia
786.2: Cough 42 7.5
brevis red tides in the Gulf of Mexico (Backer
et al., 2005; Fleming et al., 2011; Kirkpatrick et 995.3: Allergy, unspecified 38 6.8
al., 2006). A large peak in HAB exposure code 780.79: Other malaise and fatigue 16 2.9
use occurred during a particularly intense red 784.0: Headache 12 2.2
tide event in the Gulf of Mexico in August– V70.0: Routine general medical examination at a healthcare facility 12 2.2
November 2018. Examination of the data by ICD-10
region corroborated this assumption, as the
R05: Cough 37 6.6
South Atlantic region contained approximately
30% of the total records. These results cor- R0602: Shortness of breath 12 2.2
respond to a study of emergency department I10: Essential (primary) hypertension 11 2.0
admissions in 2002 in Florida that found a J029: Acute pharyngitis, unspecified 11 2.0
significant increase in the rate of admissions J069: Acute upper respiratory infection, unspecified 11 2.0
for respiratory disease during a red tide event
compared with a time when there was no red ICD = International Classification of Diseases.
tide (Kirkpatrick et al., 2006).
Interestingly, the next highest count of
respiratory events (coded on the same visit were associated with recreational exposure to advisory (89%) indicated that their health
as an individual’s HAB exposure code) was in cyanoHABs. The study also found that higher issues were not serious enough to seek medi-
the East North Central region that comprises cell counts of cyanobacteria were associated cal attention (McCarty et al., 2016). People
many Great Lakes states. Other blooms, such with an increase in the relative risk for GI also might not report HAB exposure to their
as cyanobacterial harmful algal blooms (cya- symptoms. In 2014, a large microcystin HAB healthcare provider or know to mention it
noHABs), could be the source of respiratory bloom occurred on Lake Erie, contaminating during their medical visit.
irritants in this region (Backer et al., 2015, municipal drinking water and causing a do- While the findings from this data set are
2010; Stewart et al., 2006). Studies on rec- not-drink advisory for over 400,000 people. enlightening, limitations within the data set
reational water users have shown that toxins A community assessment during this event made us unable to verify that we had cor-
from cyanoHABs are detectable in the air and found that the contamination was associated rectly classified people with HAB exposure
measurable in personal air samplers, and that with a variety of health symptoms primarily codes. First, an exploration of the proximate
these toxins could be directly responsible related to GI distress such as nausea, vomit- events that occurred on the same day as the
for respiratory irritation (Backer et al., 2008, ing, abdominal pain, and diarrhea (McCarty HAB exposure codes showed several condi-
2010). Respiratory irritation, however, is also et al., 2016). Although the MarketScan data tions that would be unrelated to HAB expo-
associated with gases and vapors (e.g., hydro- reported few GI events in the East North Cen- sure such as “diabetes mellitus without men-
gen sulfide, methane) released as blooms die tral and Middle Atlantic regions that include tion of complication,” “tobacco use disorder,”
off, and these chemicals could be responsi- Lake Erie and surrounding states, during or “routine gynecological examination.” It is
ble for the reported respiratory effects from 2014, most of the HAB-exposure codes (41%) likely these codes were used to describe the
cyanoHABs. Studies are underway to better were recorded within these regions. patient’s status overall; however, it is unclear
understand the health effects from aerosol- These results likely represent only a sub- whether these codes were related to the symp-
ized cyanoHABs. set of people who have symptoms or illnesses toms presented at the medical visit. Several
Few gastrointestinal (GI) events were caused by HAB exposure because the data people also had a diagnostic code for fever,
recorded during the time an HAB exposure are a subsample from EHRs across the U.S. which, while unexpected based on what we
code was used. Past reports of GI events In addition, it is possible that only those know about HAB toxin exposure, should be
and outbreaks, however, have been asso- with more severe symptoms are likely to visit explored further.
ciated with HAB exposure (Backer et al., a medical provider for treatment. During Second, several codes were used to describe
2008; McCarty et al., 2016). In a prospec- the 2014 microcystin water contamination injuries or lacerations, which could be unre-
tive study of acute health effects, Lévesque in Ohio, most people who reported health lated to an actual HAB exposure. In addition,
et al. (2014) found that only GI symptoms symptoms during the do-not-drink water other codes sometimes were used that cor-
12 Volume 83 • Number 9responded to potentially different exposures to the health events (either because they fail exposure codes were used infrequently, they
or indicated that the person might have been to see the importance of the connection or were most often recorded during bloom
exposed to multiple substances: “Contact with fail to remember), or lack of general knowl- seasons in warmer months. The most com-
and exposure to other hazardous aromatic edge about HAB-related illness or use of HAB mon health outcomes associated with these
compounds” or “contact with and exposure to exposure codes by healthcare professionals. codes were respiratory symptoms. These
other potentially hazardous chemicals.” While As the symptoms associated with HABs findings suggest that EHR databases, though
these other exposure codes might be related to are common among other illnesses and dis- far from perfect, can be useful in examining
an HAB exposure event, it is unclear if these orders, it is important to have exposure diag- trends in HAB-related illness reports in the
codes were indicative of the HAB exposure nostic code classifications to differentiate U.S.
itself or another substance in the environment HAB-related illness from other exposures.
at the same time as the HAB event condition. Our findings can inform future medical Disclaimer: The findings and conclusions
Finally, because we were able to search only education on the importance of using spe- in this article are those of the author(s) and
through records with ICD codes, we might cific ICD codes for HAB exposures. Patients do not necessarily represent the views of the
have missed patients whose exposure to an should also be encouraged to tell their phy- Centers for Disease Control and Prevention
HAB was documented elsewhere in the record. sicians about their environmental exposures, or U.S. Department of Health and Human
Despite these limitations, exploring large specifically when HABs are present. Once Services. The article has not been revised or
scale EHR systems—and in particular those there is increased knowledge by healthcare edited to conform to agency standards.
such as MarketScan that have primary care professionals regarding environmental expo-
medical visits documented along with hospi- sures such as HABs, EHR databases will be Corresponding Author: Amy Lavery, Environ-
tal visits—can help researchers estimate the much more useful for tracking environmen- mental Epidemiologist, National Center for
occurrence of HAB-related illness across the tal exposures and associated health effects. Environmental Health, Centers for Disease
U.S. Defining HAB exposure and related ill- Control and Prevention, 4770 Buford High-
ness can be challenging because of misdiag- Conclusion way NE, Atlanta, GA 30341.
noses, failure of the patient fully disclosing In this initial evaluation of the MarketScan Email: alavery@cdc.gov.
exposures they might have had leading up databases, we found that although HAB
References
Backer, L.C., Carmichael, W., Kirkpatrick, B., Williams, C., Irvin, nobacteria an environmental risk factor for amyotrophic lateral
M., Zhou, Y., Johnson, T.B., Nierenberg, K., Hill, V.R., Kieszak, sclerosis and other neurodegenerative diseases? Amyotrophic Lat-
S.M., & Cheng, Y.S. (2008). Recreational exposure to low con- eral Sclerosis & Frontotemporal Degeneration, 14(5–6), 325–333.
centrations of microcystins during an algal bloom in a small lake. https://doi.org/10.3109/21678421.2012.750364
Marine Drugs, 6(2), 389–406. https://doi.org/10.3390/md6020389 Centers for Disease Control and Prevention. (2020). Harmful algal
Backer, L.C., Kirkpatrick, B., Fleming, L.E., Cheng, Y.S., Pierce, R., bloom (HAB)-associated illness. https://www.cdc.gov/habs/index.html
Bean, J.A., Clark, R., Johnson, D., Wanner, A., Tamer, R., Zhou, Davis, T.W., & Gobler, C.J. (2016). Preface for special issue on
Y., & Baden, D.G. (2005). Occupational exposure to aerosolized “Global expansion of harmful cyanobacterial blooms: Diversity,
brevetoxins during Florida red tide events: Effects on a healthy ecology, causes, and controls.” Harmful Algae, 54, 1–3. https://doi.
worker population. Environmental Health Perspectives, 113(5), org/10.1016/j.hal.2016.02.003
644–649. https://doi.org/10.1289/ehp.7502 Figgatt, M., Muscatiello, N., Wilson, L., & Dziewulski, D. (2016).
Backer, L.C., Manassaram-Baptiste, D., LePrell, R., & Bolton, B. Harmful algal bloom-associated illness surveillance: Lessons from
(2015). Cyanobacteria and algae blooms: Review of health and reported hospital visits in New York, 2008–2014. American Jour-
environmental data from the Harmful Algal Bloom-Related Illness nal of Public Health, 106(3), 440–442. https://doi.org/10.2105/
Surveillance System (HABISS) 2007–2011. Toxins, 7(4), 1048– AJPH.2015.302988
1064. https://doi.org/10.3390/toxins7041048 Fleming, L.E., Kirkpatrick, B., Backer, L.C., Walsh, C.J., Nieren-
Backer, L.C., McNeel, S.V., Barber, T., Kirkpatrick, B., Williams, berg, K., Clark, J., Reich, A., Hollenbeck, J., Benson, J., Cheng,
C., Irvin, M., Zhou, Y., Johnson, T.B., Nierenberg, K., Aubel, M., Y.S., Naar, J., Pierce, R., Bourdelais, A.J., Abraham, W.M., Kirk-
LePrell, R., Chapman, A., Foss, A., Corum, S., Hill, V.R., Kieszak, patrick, G., Zaias, J., Wanner, A., Mendes, E., Shalat, S., . . .
S.M., & Cheng, Y.S. (2010). Recreational exposure to microcys- Baden, D.G. (2011). Review of Florida red tide and human health
tins during algal blooms in two California lakes. Toxicon, 55(5), effects. Harmful Algae, 10(2), 224–233. https://doi.org/10.1016/j.
909–921. https://doi.org/10.1016/j.toxicon.2009.07.006 hal.2010.08.006
Bradley, W.G., Borenstein, A.R., Nelson, L.M., Codd, G.A., Rosen,
B.H., Stommel, E.W., & Cox, P.A. (2013). Is exposure to cya- continued on page 14
May 2021 • Journal of Environmental Health 13A D V A N C E M E N T O F T H E SCIENCE
References continued from page 13
IBM Watson Health. (2017). IBM MarketScan Research Databases National Institute of Environmental Health Sciences. (2021).
user guide: Multi-State Medicaid Database. https://blog.gens1.com/ Algal blooms. https://www.niehs.nih.gov/health/topics/agents/algal-
files/dictionaries/MDCD_UserGuide.pdf blooms/index.cfm
Kirkpatrick, B., Fleming, L.E., Backer, L.C., Bean, J.A., Tamer, R., National Oceanic and Atmospheric Administration. (2020). Harm-
Kirkpatrick, G., Kane, T., Wanner, A., Dalpra, D., Reich, A., & ful algal blooms: Tiny organisms with a toxic punch. https://ocean
Baden, D.G. (2006). Environmental exposures to Florida red service.noaa.gov/hazards/hab/
tides: Effects on emergency room respiratory diagnoses admis- Serrano, T., Dupas, R., Upegui, E., Buscail, C., Grimaldi, C., & Viel,
sions. Harmful Algae, 5(5), 526–533. https://doi.org/10.1016/j. J.F. (2015). Geographical modeling of exposure risk to cyanobac-
hal.2005.09.004 teria for epidemiological purposes. Environment International, 81,
Lévesque, B., Gervais, M.C., Chevalier, P., Gauvin, D., Anassour- 18–25. https://doi.org/10.1016/j.envint.2015.04.007
Laouan-Sidi, E., Gingras, S., Fortin, N., Brisson, G., Greer, C., Stewart, I., Webb, P.M., Schluter, P.J., & Shaw, G.R. (2006). Recre-
& Bird, D. (2014). Prospective study of acute health effects ational and occupational field exposure to freshwater cyanobac-
in relation to exposure to cyanobacteria. Science of the Total teria—A review of anecdotal and case reports, epidemiological
Environment, 466–467, 397–403. https://doi.org/10.1016/j.scito studies and the challenges for epidemiologic assessment. Envi-
tenv.2013.07.045 ronmental Health: A Global Access Science Source, 5(6). https://doi.
McCarty, C.L., Nelson, L., Eitniear, S., Zgodzinski, E., Zabala, A., org/10.1186/1476-069X-5-6
Billing, L., & DiOrio, M. (2016). Community needs assessment Torbick, N., Ziniti, B., Stommel, E., Linder, E., Andrew, A., Caller,
after microcystin toxin contamination of a municipal water sup- T., Haney, J., Bradley, W., Henegan, P.L., & Shi, X. (2018). Assess-
ply—Lucas County, Ohio, September 2014. Morbidity and Mor- ing cyanobacterial harmful algal blooms as risk factors for amyo-
tality Weekly Report, 65(35), 925–929. https://doi.org/10.15585/ trophic lateral sclerosis. Neurotoxicity Research, 33, 199–212.
mmwr.mm6535a1 https://doi.org/10.1007/s12640-017-9740-y
Mikulic, M. (2020, May 4). Medicaid—Statistics & facts. Statista.
https://www.statista.com/topics/1091/medicaid/
Did You NEHA has released its 2020 Annual Report. The report highlights the milestones
and successes of the association in 2020 with a focus on capacity building,
Know? resources and partnerships, membership, and finances. Read for full report at
www.neha.org/about-neha/neha-annual-reports.
Employers increasingly require a professional
credential to verify that you are qualified and trained to
perform your job duties. Credentials improve the visibility
and credibility of our profession and they can result in
raises or promotions for the holder. For 80 years, NEHA
has fostered dedication, competency, and capability
through professional credentialing. We provide a path
to those who want to challenge themselves and keep
learning every day. Earning a credential is a personal
commitment to excellence and achievement.
Learn more at
neha.org/professional-development/credentials.
A credential today can improve all your tomorrows.
Did You
Know?
14 Volume 83 • Number 9 Copyright 2021, National Environmental Health Association (www.neha.org)You can also read