Revised extent of wetlands in New Zealand
←
→
Page content transcription
If your browser does not render page correctly, please read the page content below
Dymond
New Zealand
       et al.:Journal
               New Zealand
                      of Ecology
                             wetland
                                 (2021)
                                     extent
                                        45(2):
                                            revised
                                               3444 © 2021 New Zealand Ecological Society.                                             1

                  RESEARCH

Revised extent of wetlands in New Zealand

John R. Dymond1* , Marmar Sabetizade2,3 , Peter F. Newsome1, Garth R. Harmsworth1
and Anne-Gaelle Ausseil1
1
  Manaaki Whenua – Landcare Research, Palmerston North, New Zealand
2
  Department of Soil Science, University of Tehran, Tehran, Iran
3
  Leibniz Institute for Agricultural Engineering and Bioeconomy, Potsdam, Germany
*Author for correspondence (Email: dymondj@landcareresearch.co.nz)

Published online: 30 June 2021

          Abstract: Wetlands are highly valued and significant ecosystems with a large range of services and functions. To
          help manage and protect them, it is important to map and monitor their spatial extent and condition. However,
          wetlands have not yet been comprehensively and reliably mapped at the national level, although elements for
          mapping national coverage exist in two of our national databases: Waters of National Importance (WONI), and
          the New Zealand Land Cover Database (LCDB). The extent of freshwater wetlands in WONI was derived by
          identifying all types of freshwater wetlands, excluding inland saline. The extent of freshwater wetlands in the
          LCDB was derived by identifying areas with either a wet context, herbaceous freshwater vegetation, or flax.
          We then combined identified freshwater wetlands from the two databases recognising the superior boundary
          delineation of LCDB and the superior wetland detection of WONI. The current spatial extent of freshwater
          wetlands in New Zealand is now calculated at 249 214 ha, or 10.08% of the historical extent, rather than the
          7.4% reported by LCDB5 alone. This is at least 5954 ha less than that in 1996. The revised extent of freshwater
          wetlands is an improvement over either WONI or LCDB because it now includes a more comprehensive set of
          wetlands over 0.5 ha in area with well-defined boundaries. However, the revised extent does not include small
          wetlands less than 0.5 ha in area. While adding little to the total area of wetlands in New Zealand, small wetlands
          have significant ecological value. The National Policy Statement for Freshwater Management mandates the
          national mapping of the small wetlands down to 0.05 ha, but we suggest their ecological value be considered in
          land use change decisions only, thereby avoiding the excessive cost of mapping many millions of small wetlands.
          Keywords: ecosystem services, freshwater wetlands, saline wetlands, spatial extent, wetland loss

Introduction                                                           (Best 1979; Ogle & Cheyne 1981; McDowall 1990; Heather
                                                                       & Robertson 1996)—but wetland algae and invertebrates
Wetlands are terrestrial ecosystems that are permanently or            are not (Sorrell & Gerbeaux 2004). Compared with other
intermittently wet. Accordingly, they support a range of plants        natural ecosystems, wetlands support a disproportionately
and animals adapted to wet conditions (Stephenson et al 1983;          high number of threatened plants and animals (Clarkson et al.
Cromarty & Scott 1996; Johnson & Brooke 1998; Campbell &               2013), including 67% of fresh-water and estuarine fish species
Jackson 2004; Johnson & Gerbeaux 2004; Peters & Clarkson               (Allibone et al. 2010) and 13% of nationally threatened plant
2010). They are formed either by poor soil drainage or by              species (de Lange et al. 2009).
accumulation of water, and usually have emergent aquatic                   In New Zealand, wetlands have special significance for
plants (Sorrell & Gerbeaux 2004; McGlone 2009). Freshwater             Māori for a large range of cultural and spiritual values and uses
wetlands include bogs, fens, swamps, and marshes; these lie            including mahinga kai (cultural harvest sites), cultural identity,
on gradients of water flow (low to high), nutrient availability        and decision-making through Te Mana o Te Wai (Minister for
(low to high), pH (low to high), and peat content (high to low)        the Environment 2020). For Māori they include important
(Sorrel & Gerbeaux 2004).                                              traditional gathering sites for food, rongoā (medicines),
     Wetlands provide many ecosystem services, including               and many taonga species (such as fish, birds, and plants for
maintaining water quality and supply, regulating atmospheric           weaving), There is currently renewed interest in knowing
gases, sequestering carbon, sustaining unique biota, and               where these wetlands are, and what condition they are in, for
providing cultural, recreational, and educational resources            sustaining, managing, and restoring Māori values and broader
(Zedler & Kercher 2005; Dise 2009; Clarkson et al. 2013).              societal and ecological values (Taura et al. 2017).
New Zealand wetland vegetation is well described (Wardle                   To help manage these high-value ecosystems, it is
1991; Johnson & Brooke 1998;)—as are wetland fish and birds            necessary to map their spatial extent (Gumbley et al. 2005).
DOI: https://dx.doi.org/10.20423/nzjecol.45.32
2                                                                             New Zealand Journal of Ecology, Vol. 45, No. 2, 2021

It is critical that New Zealand produces a national overview       described by a land cover code and name (Thompson et al.
of wetland distribution across landscapes and land use to          2004; Dymond et al. 2016) at five points in time: summer
inform planning and policy, and for state of the environment       1996/97, summer 2001/02, summer 2008/09, summer 2012/13,
monitoring and reporting (Minister for the Environment 2020).      and summer 2018/19. As the name implies, the LCDB covers
National mapping can also highlight and prioritise issues,         all New Zealand (including the Chatham Islands, but not the
such as loss of wetlands, degradation, and loss of biodiversity,   Kermadec or the subantarctic islands) and all terrestrial (and
arising through land use changes (Robertson 2016). Mapping         some intertidal) ecosystems. The LCDB conforms to elements
wetlands over large areal extents requires remote sensing of       of Topo50, New Zealand’s 1:50 000 topographic database;
some form (Mahdavi et al. 2017). Many types of sensors have        for instance, the coastline, lakes and rivers are common. The
been used for automatic mapping of wetlands, but successful        minimum map unit of 1 ha is similar to that of Topo50.
applications are usually limited to local scales (Guo et al.            When first created, LCDB was new mapping, either
2017), and national applications typically have low accuracies     classified directly from SPOT and LandSat satellite imagery, or
~ 80% (Mahdianpari et al. 2020).                                   interpreted visually and digitised manually by image analysts
      Despite their high importance, wetlands have not yet         (Newsome 2017). Visual interpretation was supported by
been reliably mapped at the national level in New Zealand,         selected field-based observations. Since then, the mapping of
although elements exist in two national databases, WONI            each new version of LCDB has embodied processes to improve
(Wetlands of National Importance) and LCDB (Land Cover             polygon delineation mapping resolution and classification
Database), and in fragments of sub-national datasets maintained    accuracy, not only for the new mapping date but also for all
by some regional councils (Allan 2016). Wetlands of National       earlier dates. As such, it is an appropriate tool to track changes
Importance are derived from region-growing on satellite            in wetland extent.
imagery (i.e. automated identification of similar colour around         The Land Cover Database, at versions 2 and 3, was judged
seed point) from seeds of field-identified wetland centres         inappropriate for reporting on wetlands at national scale due to
(Ausseil et al. 2011). The Land Cover Database wetlands are        underestimations noted in the Wellington region (Davis et al.
derived from visual interpretation of satellite imagery and        2013). Since then, however, significant improvements have
manual delineation by an expert operator (Thompson et al.          been made at versions 3.1, 4, and 5. The Land Cover Database
2004). In this paper we derive a revised extent of freshwater      currently maps 33 land cover classes on mainland New Zealand
wetlands in New Zealand by combining WONI and LCDB                 (two further classes cater for particular vegetation communities
in a way that recognises the superior boundary delineation of      on the Chatham Islands). In respect of wetlands, four classes
LCDB and the superior wetland detection of WONI.                   apply: Herbaceous freshwater vegetation, Herbaceous saline
                                                                   vegetation, Flaxland, and Mangrove. In addition, LCDB has a
                                                                   ‘WETContext’ flag that identifies all sites that are edaphically
Methods                                                            wetlands despite having a land cover that does not explicitly
                                                                   identify with wetlands. In this way, environments such as
Databases used in study                                            swamp-forests and wet heathlands can be recognised as
Wetlands of National Importance is now a component of the          wetlands while retaining their formal land cover class. In
wider FENZ (Freshwater Environments of New Zealand)                addition to a general improvement in mapping quality from
database (Leathwick et al. 2010), a set of spatial data layers     version to version, LCDB has incorporated higher-quality
that describes and interprets environmental and biological         wetland information from regional councils (Waikato, Bay
patterns in New Zealand’s lakes, rivers, and wetlands (Ausseil     of Plenty, Taranaki, Manawatū-Whanganui, Wellington, and
et al. 2011), providing the Department of Conservation with a      Otago) and one district (Far North).
systematic conservation, planning, and reporting tool. Wetlands         In short, because of the different mapping methodologies
of National Importance describes the environmental attributes,     of WONI and LCDB, both are insufficient on their own
biodiversity values, pressures, and rankings of palustrine         to characterise the full extent of freshwater wetlands in
(inland, non-flowing, freshwater) wetlands, comprising             New Zealand. Wetlands of National Importance maps a
three interrelated layers of historical typology, current          larger spatial extent of wetlands, but is still missing many
sites, and current typology. Current sites were seeded from        wetlands mapped by LCDB. The Land Cover Database
observational data of various origins, including authoritative     delineates wetland polygons more precisely than WONI, but
wetland polygons from regional councils and authoritative          also is missing many wetlands mapped by WONI. To create a
point localities from regional councils (which then underwent      more comprehensive and reliable national map of freshwater
a raster-based region-growing process on satellite imagery);       wetlands, WONI and LCDB need to be combined, the gaps
and typology was based on evidential data from soil, substrate,    filled, and the disagreements resolved.
vegetation, slope, and hydrology (Allan 2016; Newsome
2017). The ecological scope of WONI was intended to be             Combining WONI and the LCDB
simply palustrine and inland saline hydrosystems as defined by     Our revised extent of freshwater wetlands derives from an
Johnson and Gerbeaux (2004). However, as visual inspection         explicit combination of WONI and LCDB5 at the national
of the current typology reveals the inclusion of some riverine,    scale. Wetlands of National Importance freshwater wetlands
estuarine, and lacustrine hydrosystems, mapping appears to         were prepared by dissolving intervening boundaries between
have exceeded the intended scope. The minimum mapping              all the freshwater types, that is, all types excluding inland
unit is 0.5 ha.                                                    saline. These were aggregated and smoothed using a PAEK
     The Land Cover Database is a multi-temporal classification    algorithm (Bodansky et al. 2002), and small slivers (< 0.05
of New Zealand’s land cover. Manaaki Whenua – Landcare             ha) were eliminated to derive a uniform and conjunct WONI
Research is the current compiler and custodian of the database     freshwater map. This was combined with the LCDB5 freshwater
and has been responsible for publishing the last three major       wetlands (herbaceous freshwater vegetation, or flax, or other
revisions. Land cover is delineated by polygon boundaries and      non-saline communities with wet context), and proximity
Dymond et al.: New Zealand wetland extent revised 3
tools were used to investigate areas in common and areas of Results
disagreement.
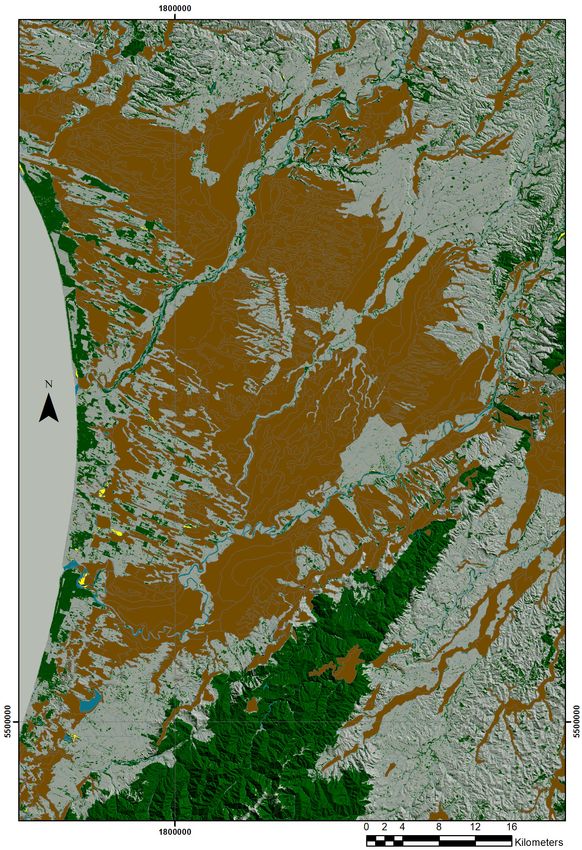
Areas of disagreement in contact with areas in common Combining areas in common, LCDB5 delineation and
were considered delineation differences (i.e., having a core detection differences, and WONI detection differences, with
area of agreement but with differently drawn borders). Areas of tidy-ups as detailed in the Appendix, gave the revised extent
disagreement detached from areas in common were considered of freshwater wetlands. Similarly, WONI saline wetlands
detection differences – these identified wetlands detected by (inland saline and reassessed polygons) were combined with
one database but not the other (Fig. 1). Delineation differences LCDB5 saline wetlands to complete our revised extent of
greater than 10 ha and having a tenuous connection to their area freshwater and saline wetlands in New Zealand. The area of
of agreement were visually checked to determine whether they the revised freshwater wetlands has increased from 182 864
were better classified as delineation or detection differences. ha, as reported by LCDB5, to 249 214 ha (Table 2), and the
Table 1 shows the areas of delineation and detection differences. number of wetlands has increased from 14 360, as reported
Note that WONI wetlands have a significantly larger area than by LCDB5, to 19 355.
LCDB wetlands, by 66 326 ha, and also that WONI wetlands The similar area of the revised extent and WONI is merely
with detection difference have a significantly larger area than coincidence, brought about by extra fragmentation and the
LCDB wetlands, by 49 536 ha. tendency to overestimate the extent of wetland systems by
Considering that LCDB5 was mapped from up-to-date WONI. This extra fragmentation, where wetlands in a group
and high-resolution satellite images of Sentinel-2 (European are identified as individuals rather than one wetland system,
Space Agency 2021) and wetland information from regional is demonstrated by WONI having over twice the number of
and district councils, we consider both detection and delineation wetlands as in the revised extent. The revised extent is 10.08%
differences in LCDB5 to be probable wetlands. Wetlands of of the pre-European historical extent, mapped by Ausseil et al.
National Importance was based on evidential data of various (2011) from wet soil types, which compares with 7.4% reported
origins, so we consider detection differences in WONI to be by LCDB5. Table 2 also shows that the area of saline wetlands
probable wetlands. However, because WONI boundaries were in the revised extent is 47 018 ha, only 266 ha greater than
defined using raster-based region-growing on low resolution that of LCDB5, and almost entirely attributable to herbaceous
satellite imagery (LANDSAT TM: 30m pixels), we do not saline vegetation and mangrove in LCDB5.
consider delineation differences in WONI to be probable An analysis of wetland areas shows that large wetlands
wetlands (Figure 1). contribute disproportionately to the total area of wetlands in
Figure 1. Schematic of detection and delineation differences. Blue shows WONI wetlands and green shows LCDB wetlands. The green
wetland on its own is an LCDB detection difference. The blue wetland on its own is a WONI detection difference. Green touching blue
is an LCDB delineation difference. Blue touching a green LCDB wetland is a WONI delineation difference.
Table 1. Area of freshwater wetlands for WONI and LCDB5, and areas of delineation and detection difference.
__________________________________________________________________________________________________________________________________________________________________
Freshwater wetlands (ha) Delineation (ha) Detection (ha)
__________________________________________________________________________________________________________________________________________________________________
LCDB5 182 864 32 992 22 844
WONI 249 190 49 781 72 3804 New Zealand Journal of Ecology, Vol. 45, No. 2, 2021
Table 2. Area of revised freshwater and saline wetlands in New Zealand by combining WONI and LCDB5.
__________________________________________________________________________________________________________________________________________________________________
Freshwater wetlands Number of freshwater Saline wetlands Number of saline
(ha) wetlands (ha) wetlands
__________________________________________________________________________________________________________________________________________________________________
Historical 2 471 080
WONI 249 190 45 732 291 75
LCDB5 182 864 14 360 46 752 6063
Revised extent 249 214 19 355 47 018 6080
__________________________________________________________________________________________________________________________________________________________________
New Zealand (Fig. 2 shows the distribution of wetland areas Discussion
in 1 ha increments). Many wetlands are small, with 5750 of
them less than 1 ha. The number of wetlands in area classes Revised extent and historical loss of wetlands
reduces exponentially as the area increases. For example, We have combined elements of the WONI wetlands database
there are only 287 wetlands with an area between 9 and 10 and the LCDB5 wetlands to form a revised extent of freshwater
ha. However, small wetlands do not contribute much to the wetlands in New Zealand with total area 249 214 ha. This is
cumulative area, because the larger wetlands, although less 10.08% of the pre-European historical extent, rather than the
frequent, contribute disproportionately to the cumulative area 7.4% reported by LCDB5 and the 10.1% reported by Ausseil
(Fig. 3). For example, all the wetlands with an area of less et al. (2011). (Note that the area of the historical extent is 9%
than 10 ha (i.e. 83.7% in number) sum to 39 080 ha, which is of the total area of New Zealand.) The area of the revised
only 15.6% of the cumulative area of all freshwater wetlands. extent may be further revised upwards as more detailed
regional wetland databases are added to the LCDB – currently
Waikato, Bay of Plenty, Taranaki, Manawatū-Whanganui,
Wellington, and Otago regions have been included, as well
as the Far North district.
The loss of 89.92% of historical wetlands is large in
comparison with global reductions. Mitsch & Gosselink (2000)
reported that about 50% of wetlands worldwide had been
lost, ranging from relatively minor losses in boreal countries
to more than 90% in some European countries. In some parts
of New Zealand, the loss of wetlands has been extreme, such
as in the Manawatū-Whanganui region on the plains between
the Whangaehu and Manawatū Rivers (Fig. 4). Although most
of the plains were originally wetlands, they have now been
drained for agriculture. One of the three remaining wetlands,
the Manawatū estuary (and associated saline wetlands), is
internationally recognised through the RAMSAR convention
(Gerbeaux 2003) for outstanding wildlife values. While few
of the historical wetlands are likely to be restored in the
future, because the land is now privately owned and devoted
to agriculture which contributes significantly to the regional
Figure 2. Number of wetlands within area classes.
economy (Jones et al. 1995), the remaining wetlands and
their associated ecosystem services could be protected, or
enhanced, by maintaining their condition and connectivity
with water courses (Sorrell et al. 2004; Ausseil et al. 2011;
Myers et al. 2013).
Ministry for the Environment have reported a loss of
1247 ha of wetlands in New Zealand between 2001 and
2016 (Ministry for the Environment 2019). These were
WONI wetlands discovered to have been completely lost by
visual examination of satellite imagery (Belliss et al. 2017).
Partial loss of wetlands was also noted but not quantified.
The recently released LCDB5 quantifies the loss (full and
partial) of freshwater wetlands between 1996 and 2018 as
5954 ha (Table 3). Given this continuing loss of freshwater
wetlands, we suggest that the revised extent of wetlands be
incorporated into the LCDB and that future losses from that
extent be monitored.
Improvement of revised extent
The revised extent of wetlands is more comprehensive than
Figure 3. Total area of all wetlands with size (ha) less than that LCDB because it includes wetlands from WONI that have local
given on x axis. evidence of existence (i.e. the WONI detection differences).Dymond et al.: New Zealand wetland extent revised 5 Figure 4. Map of current wetlands (yellow) and historical wetlands (brown) in the lower Manawatū-Whanganui region.
6                                                                                                 New Zealand Journal of Ecology, Vol. 45, No. 2, 2021

Table    3. The area of wetlands at five dates for LCDB5.
__________________________________________________________________________________________________________________________________________________________________

Years            Total area (ha)              Fresh water wetlands (ha)                    Saline water wetlands (ha)
__________________________________________________________________________________________________________________________________________________________________

1996                      235 750                                    188 818                                        46 931
2001                      234 544                                    187 677                                        46 867
2008                      232 849                                    186 002                                        46 846
2012                      231 245                                    184 424                                        46 821
2018                      229 617                                    182 864                                        46 752
__________________________________________________________________________________________________________________________________________________________________

The producers’ accuracy of LCDB wetlands was assessed at                             Māori values
93.7% (NZ Land Cover Database 2012; Dunningham et al.                                An early study on Māori values identified areal extent and
2000), so we would also expect the mapping accuracy of the                           condition of wetlands as important environmental indicators
revised extent to be of similar order, as it primarily comprises                     (Harmsworth 2002). Loss of wetlands, as measured by areal
LCDB wetland polygons. The accuracy of the WONI detection                            extent, is keenly felt by Māori because of their whakapapa
differences is unknown (never reported), and therefore might                         connection, spiritual attachment, and use of the resource for
reduce the producers’ accuracy of the revised extent below                           mahinga kai, all of which affects their sense of wellbeing
90%. However, it needs to be kept in mind that the accuracy                          (Awatere et al. 2017). Harmsworth (2002) also recognised
of any wetland map is highly uncertain: as ground data are                           that wetlands are considered part of an interconnected system
difficult to obtain, wetlands are highly dynamic and their energy                    linked to human values and uses, whereby all wetlands are
signatures are constantly changing, and steep environmental                          linked from the mountains to the sea (Te Uta ki Tai) – palustrine
gradients produce narrow ecotones below the resolving capacity                       wetlands (repo) are connected to rivers (awa, manga), lakes
of remote sensors (Gallant 2015). It is therefore difficult to                       (roto), estuaries (wahapū), and the sea (te moana). To represent
ascertain a quantitative expression of accuracy. However, we                         the physical inter-connection of wetlands across hydro-systems,
can say that the process of mapping is nationally consistent, and                    classes and types, and landscapes, we propose tagging both
more comprehensive and reliable than previous methods. All                           freshwater and saline wetlands in the LCDB with identifiers
wetlands over 0.5 ha in area are included and their boundaries                       that link them to the stream or river to which they drain. Simple
are well defined.                                                                    GIS (geographic information system) queries on all wetlands
                                                                                     in the system above a point of a water body, such as a river or
Ecological function                                                                  estuary, could then be readily executed.
The areal extent of wetlands is an important first indicator                              Avoiding loss or degradation of the remaining wetlands
of ecological function and associated conservation value.                            in New Zealand is a focus of the recently approved National
Ausseil et al. (2011) used a power law (following Rosenzweig                         Policy Statement for Freshwater Management (Minister
1995) relating conservation value to wetland area in their                           for the Environment 2020). Clause 3.23 states that “Every
prioritisation of wetlands for conservation. This power law                          regional council must identify and map every natural inland
suggests that conservation value increases as area increases,                        wetland in its region that is 0.05 hectares or greater in extent
but because the power exponent is less than one, it also                             …”. Although our revised freshwater wetland extent is an
suggests that the conservation value per unit area is greater for                    improvement on previous databases, the minimum mapping
smaller wetlands. So small wetlands, while not contributing                          unit is 1 ha and so it will not achieve the 0.05 ha limit of the
hugely to national areal extent (Fig. 3), may still contribute                       national policy statement. However, it would achieve a baseline
significantly to ecological function. Semlitsch and Bodie (1998)                     for national reporting purposes, which would include most of
confirmed this when they found that small isolated wetlands                          the areal extent of wetlands, as small wetlands would not add
contributed significantly to species biodiversity; as did Gibbs                      significantly to the total area (Fig. 3).
(1993) who found that small wetlands play a greater role in                               The 0.05 ha limit of the national policy statement is overly
the metapopulation dynamics of wetland animals than their                            optimistic for a national mapping exercise that would require
modest area implies.                                                                 excessive resources to map the several million small wetlands
     The addition of the WONI database, with many more                               (estimated from the relationship between wetland number
smaller wetlands than the LCDB, some down to 0.5 ha, will                            and area in Fig. 2) in New Zealand. Indeed, the difficulty of
have significantly increased the biodiversity represented in the                     automating an objective nation-wide method for mapping
national areal extent (we noted no spatial pattern regarding                         wetlands suggests that obligatory mapping of wetlands down
the location of WONI wetlands that were added to the revised                         to 0.05 ha is problematic and should be replaced by another
extent). In the absence of national consistent biodiversity data                     instrument that encourages the protection of wetland values
of wetlands, Ausseil et al (2011) used a typology of wetlands                        without obligatory mapping. It would be more pragmatic for
including bog, fen, swamp, marsh, pakihi/gumland, seepage,                           the obligation to be consideration of wetland values before
and inland saline. They used the typology together with                              a change in land use or management affecting those values;
measures of condition and complementarity to represent the                           Robertson et al. (2019) reported land use change as major
proportion of remaining biodiversity. While the typology was                         cause of wetland loss in Southland. This should require
useful, it was assessed using automated methods resulting in a                       consideration of values coming from areas as small as 0.05 ha,
low classification accuracy. We therefore recommend that the                         or even smaller for ephemeral wetlands containing threatened
typology also be applied to the wetlands in the revised extent                       species. This would require the mapping of several thousand
but using field assessment methods.                                                  small wetlands per year involved in land-use change, which
Dymond et al.: New Zealand wetland extent revised 7
could be achieved with moderate resources (available to most Landcare Research Contract Report LC2798. Lincoln,
regional councils), rather than several million in total, which New Zealand.
could only be achieved with excessive resources. Best HA 1979. Observations on habitat selection by South
The revised extent of freshwater wetlands is an Island fernbirds (Bowdleria punctate punctata). Notornis
improvement because it now includes a more comprehensive set 26: 279–287.
of wetlands over 0.5 ha in area with well-defined boundaries. Bodansky E, Gribov A, Pilouk M. 2002. Smoothing and
This should help the management of wetlands at national and compression of lines obtained by raster-to-vector
regional scales. In the economics of ecosystems and biodiversity conversion. In: Blostein D, Kwon YB eds. Graphics
(TEEB), the quantification of resources is thought to be an recognition algorithms and applications. Lecture notes
important part of management (ten Brink 2009), summed up in computer science 2390. Berlin, Springer. Pp. 256–265.
with the maxim, “you can’t manage what you don’t measure”. Campbell D, Jackson R 2004. Hydrology of wetlands. In:
With improved quantification of wetlands, benefits associated Harding J, Mosley P, Pearson C, Sorrell B eds. Freshwaters
with wetlands are more likely to be maintained and enhanced. of New Zealand. Christchurch, Caxton Press. Pp.
These benefits include not only maintenance and enhancement 20.1–20.14.
of multiple ecosystem services but also cost savings in climate Clarkson BR, Ausseil AE, Gerbeaux P 2013. Wetland
change mitigation and adaption, and protection of biodiversity ecosystem services. In Dymond JR ed. Ecosystem
(Russi et al. 2013). We suggest that, in future, the revised extent services in New Zealand – conditions and trends. Lincoln,
of freshwater wetlands be incorporated into the LCDB in a New Zealand: Manaaki Whenua Press. Pp. 192–202.
supervised process to ensure quality is maintained. This will Cromarty P, Scott DA 1996. A directory of wetlands in
enable the full extent of freshwater wetlands in New Zealand New Zealand. Wellington, Department of Conservation.
to be monitored for change. 394 p.
Davis M, Brown D, Robertson H, Chadderton L 2013. How
well does LCDB2 map wetlands in the Wellington region?
Acknowledgements DOC Research and Development Series 341. Wellington,
Department of Conservation. 21 p.
This research was funded by the Ministry of Business, de Lange PJ, Norton DA, Courtney SP, Heenan PB, Barkla
Innovation and Employment, under contract number JW, Cameron EK, Hitchmough AJ 2009. Threatened
C09X1709. and uncommon plants of New Zealand (2008 revision).
New Zealand Journal of Botany 47: 61–96.
Dise NB 2009. Peatland response to global change. Science
Author contributions 326: 810–811.
Dunningham A, Brownlie R, Firth J 2000. Classification
JD, PN, and MS conceived the project idea. MS undertook the accuracy assessment of NZLCBD1: results. Report to
analysis. JD, GH, and AA provided interpretation. JD, MS, the Ministry for the Environment. Rotorua, New Zealand
and GH wrote the paper. Forest Research Institute. 52 p.
Dymond JR, Shepherd JD, Newsome PF, Belliss S 2016.
Estimating change in areas of indigenous vegetation
References cover in New Zealand from the New Zealand Land Cover
Database (LCDB). New Zealand Journal of Ecology 41:
Allan M 2016. Remote sensing of Waikato wetlands; a literature 56–64.
review. Hamilton, Waikato Regional Council Technical European Space Agency 2021. Sentinel-2. https://sentinel.
Report 2016/21. 24 p. esa.int/web/sentinel/missions/sentinel-2 (Accessed 25
Allibone R, David B, Hitchmough R, Jellyman D, Ling N, May 2021).
Ravenscroft P, Waters J 2010. Conservation status of Gallant AL 2015. The challenges of remote monitoring of
New Zealand freshwater fish, 2009. New Zealand Journal wetlands. Remote Sensing 7: 10938–10950.
of Marine and Freshwater Research 44: 271–287. Gerbeaux P 2003. The Ramsar Convention: a review of
Ausseil A-GE, Gerbeaux P, Chadderton WL, Stephens RTT, wetlands management in New Zealand. Pacific Ecologist
Brown D, Leathwick JR 2008. Wetland ecosystems of 4: 37–41.
national importance for biodiversity: criteria, methods Gibbs JP 1993. Importance of small wetlands for the persistence
and candidate list of nationally important inland wetlands. of local populations of wetland-associated animals.
Landcare Research Contract Report LC0708/158 prepared Wetlands 13: 25–31.
for the Department of Conservation. Gumbley W, Johns D, Law G 2005. Management of
Ausseil A-GE, Chadderton WL, Gerbeaux P, Stephens RTT, wetland archaeological sites in New Zealand. Science
Leathwick JR 2011. Applying systematic conservation for Conservation 246. Wellington, Department of
planning principles to palustrine and inland saline wetlands Conservation. 40 p.
of New Zealand. Freshwater Biology 56: 142–161. Guo M, Li J, Sheng C, Xu J, Wu L 2017. A review of wetland
Awatere S, Harmsworth GR 2017. Mātauranga Māori. In: remote sensing. Sensors 17: 777–814.
Taura Y, van Schravendijk-Goodman C, Clarkson B eds. Harmsworth GR 2002. Coordinated monitoring of New Zealand
Te reo o te repo – the voice of the wetland. Connections, wetlands, phase 2, goal 2: Māori environmental
understandings and learnings for the restoration of our performance indicators for wetland condition and trend.
wetlands. Lincoln, Manaaki Whenua – Landcare Research. Landcare Research Contract Report LC 0102/099.
Pp. 151–154. Heather BD, Robertson HA 1996. The field guide to the birds
Belliss S, Shepherd JD, Newsome PF, Dymond JR 2017. An of New Zealand. Auckland, Penguin Group NZ. 464 p.
analysis of wetland loss between 2001/02 and 2015/16. Johnson PN, Brooke PA 1998. Wetland plants in New Zealand.8 New Zealand Journal of Ecology, Vol. 45, No. 2, 2021
Lincoln, Manaaki Whenua Press. 317 p. Russi D, ten Brink P, Farmer A, Badura T, Coates D, Forster J,
Johnson P, Gerbeaux P 2004. Wetland types in New Zealand. Kumar R, Davidson N 2013. The economics of ecosystems
Wellington, Department of Conservation. 184 p. and biodiversity for water and wetlands. London and
Jones D, Cocklin C, Cutting M 1995. Institutional and Brussels, IEEP; Gland, Ramsar Secretariat. 84 p.
landowner perspectives on wetland management in Semlitsch RD, Bodie R 1998. Are small, isolated wetlands
New Zealand. Journal of Environmental Management expendable? Conservation Biology 12: 1129–1133.
45: 143–161. Sorrell B, Gerbeaux P 2004. Wetland ecosystems. In: Harding
Leathwick JR, West D, Gerbeaux P, Kelly D, Robertson H, J, Mosley P, Pearson C, Sorrell B eds. Freshwaters of
Brown D, Chadderton WL, Ausseil AG 2010. Freshwater New Zealand. Christchurch, Caxton Press. Pp. 28.1–28.15.
ecosystems of New Zealand (FENZ) geodatabase: Version Sorrell B, Reeves P, Clarkson B 2004. Wetland management
1 – August 2010 User Guide. Wellington, Department of and restoration. In: Harding J, Mosley P, Pearson C,
Conservation. 51 p. Sorrell B eds. Freshwaters of New Zealand. Christchurch,
Mahdavi S, Salehi B, Granger J, Amani M, Brisco B, Huang New Zealand,Caxton Press. Pp 40.1–40.12.
W 2017. Remote sensing for wetland classification: a Stephenson GK, Card B, Mark AF, McLean R, Thompson K,
comprehensive review. GIScience and Remote Sensing Priest RM 1983. Wetlands: a diminishing resource. Water
55: 623–658. and Soil Miscellaneous Publication No. 58. Wellington,
Mahdianpari M, Salehi B, Mohammadimanesh F, Brisco B, National Water and Soil Conservation Organisation. 62 p.
Homayouni S, Gill E, DeLancey ER, Bourgeau-Chavez Taura Y, van Schravendijk-Goodman C, Clarkson B 2017.
L 2020. Big data for a big country: the first generation of Te reo o te repo – the voice of the wetland. Connections,
Canadian wetland inventory map at a spatial resolution of understandings and learnings for the restoration of our
10-m using Sentinel-1 and Sentinel-2 data on the Google wetlands. Lincoln, Manaaki Whenua – Landcare Research.
Earth Engine cloud computing platform. Canadian Journal 201 p.
of Remote Sensing 46: 15–33. ten Brink Ped. 2009. The economics of ecosystems and
McDowall RM 1990. New Zealand freshwater fishes: a natural biodiversity for national and international policy makers.
history and guide. Auckland, Heinemann Reed. 553 p. Milton Park, Routledge. 429 p.
McGlone MS 2009. Postglacial history of New Zealand Thompson S, Gruner I, Gapare N 2004. New Zealand land
wetlands and implications for conservation. New Zealand cover database Version 2 – Illustrated guide to target
Journal of Ecology 33: 1–23. classes. Wellington, Ministry for the Environment. 126 p.
Mitsch WJ, Gosselink JG 2000. Wetlands. 4th ed. New York, Wardle P 1991. Vegetation of New Zealand. Cambridge,
John Wiley. X p. Cambridge University Press. 672 p.
Myers SC, Clarkson BR, Reeves PN, Clarkson BD 2013. Zedler JB, Kercher S 2005. Wetland resources: status, trends,
Wetland management in New Zealand: are current ecosystem services and restorability. Annual Review of
approaches and policies sustaining wetland ecosystems Environment and Resources 30: 39–74.
in agricultural landscapes? Ecological Engineering 56:
107–120. Received: 13 December 2020; accepted: 8 April 2021
Ministry for the Environment 2018. Wetland extent, 2001- Editorial board member: Hannah Buckley
16. https://data.mfe.govt.nz/layer/95347-wetland-
extent-2001-16/ (Accessed 15/3/20).
Minister for the Environment 2020. National Policy Statement
for Freshwater Management 2020. Wellington, Minister Supplementary material
for the Environment. 70 p.
Newsome, PF 2017. Considering a future spatial framework Additional supporting information may be found in the
for wetland mapping and monitoring in New Zealand. supplementary material file for this article:
Landcare Research Contract Report LC3000 for Ministry
for the Environment. Appendix S1. Tidy-ups for the revised extent of freshwater
NZ Land Cover Database 2012. Accuracy assessment. http:// wetlands.
www.lcdb.scinfo.org.nz/about-lcdb/accuracy-assessment
(Accessed 25 May 2021). The New Zealand Journal of Ecology provides supporting
Ogle C, Cheyne J 1981. The wildlife and wildlife values of information supplied by the authors where this may assist
the Whangamarino wetlands. Wellington Fauna Survey readers. Such materials are peer-reviewed and copy-edited
Unit Report No. 28. Wellington, New Zealand Wildlife but any issues relating to this information (other than missing
Service. 94 p. files) should be addressed to the authors.
Peters M, Clarkson B 2010. Wetland restoration: a handbook
for New Zealand freshwater systems. Lincoln, Manaaki
Whenua Press. 273 p.
Robertson HA 2016. Wetland reserves in New Zealand:
the status of protected areas between 1990 and 2013.
New Zealand Journal of Ecology 40: 1–11.
Robertson HA, Ausseil A-G, Rance B, Betts H, Pomeroy
E 2019. Loss of wetlands since 1990 in Southland,
New Zealand. New Zealand Journal of Ecology 43:
3355–3364.
Rosenzweig ML 1995. Patterns in space: species area curves.
Cambridge, Cambridge University Press. 436 p.You can also read