WORKING PAPER SERIES | No. 58 - Estimating Land Prices and Opportunity Costs of Conservation in a Megadiversity Country - Africa Portal
←
→
Page content transcription
If your browser does not render page correctly, please read the page content below
African Technology Policy Studies Network
WORKING PAPER SERIES | No. 58
Estimating Land Prices and
Opportunity Costs of Conservation
in a Megadiversity Country

Philip M. Osano
Mathieu Rouget
Jane Turpie
Wilfried Thuiller
Andrew Balmford
Estimating Land Prices and Opportunity Costs of
     Conservation in a Megadiversity Country

                        Philip M. Osano          Jane Turpie
                   University of Cape Town,      University of Cape Town,
                                South Africa     South Africa
South African National Biodiversity Institute,
                                South Africa     Wilfried Thuiller
 Africa Technology Policy Studies Network,       South African National Biodiversity Institute,
                                      Kenya      South Africa
                                                 Laboratoire D'Ecologie Alpine
                        Mathieu Rouget           Université Joseph Fourier
South African National Biodiversity Institute,   France
                                South Africa
                   University of Cape Town,      Andrew Balmford
                                South Africa     University of Cape Town,
                                                 South Africa
                                                 University of Cambridge,
                                                 UK
The African Technology Policy Studies Network (ATPS) is a multi-
disciplinary network of researchers, private sector actors and
policy makers promoting the generation, dissemination, use and
mastery of science, technology and innovation (ST&I) for African
development, environmental sustainability and global inclusion.
ATPS intends to achieve its mandate through research, capacity
building and training, science communication/dissemination and
sensitization, participatory multi-stakeholder dialogue,
knowledge brokerage, and policy advocacy.
Published by the African Technology Policy Studies Network
P O Box 10081, 00100 GPO Nairobi Kenya
2011 Published by the African Technology Policy Studies Network
ISBN: 978-9966-030-10-8Table of Contents
Acknowledgement 4
Abstract 5
1. Introduction 6
2. Materials & Methods 8
3. Results 12
4. Discussions 14
References 16
Tables 19
Figures 22
Estimating Land Prices and Opportunity Costs of Conservation in a Megadiversity Country | 3Acknowledgement We obtained land purchase data from various estate agents and landowners in the Western Cape; R. Parker; WWF-SA; Western Cape Nature Conservation Board; Western Cape Department of Agriculture; South Africa National Parks Authority; Fauna & Flora International; Cape Town Metropolitan Council; and Cape Property Services. R. Cowling, M. Botha and two anonymous reviewers provided critical comments on an earlier draft of the manuscript. The South African National Biodiversity Institute provided facilities for this study. A.B was funded as Pola Pasvolsky Visiting Chair at the Percy Fitzpatrick Institute, University of Cape Town. P.O was supported by a Tropical Biology Association Scholarship, South African National Biodiversity Institute grant, a Percy Fitzpatrick Institute grant and an African Technology Policy Studies Network research fellowship. 4 | Estimating Land Prices and Opportunity Costs of Conservation in a Megadiversity Country
Abstract
We used data on 174 land purchases to estimate two aspects of opportunity costs across Western
Cape Province, South Africa; (i) that of complete loss (acquisition cost), and (ii) and partial loss of
benefits of land ownership, the latter due to biodiversity-friendly management on potentially arable
private land. Observed land prices varied by more than four orders of magnitude (from $US 15.ha-1
to 178,000.ha-1 per unit area of farmland). Mean annual precipitation, percentage of untransformed
land, property area, and topographic diversity were the most significant predictors of land price (R2
=0.67). Modelled acquisition costs were highest in vegetation types previously classified (based on
biological importance and degree of conversion) as Critically Endangered. Our upper estimate of
the annual opportunity costs of retaining remaining habitat patches ranged from negative to US$
8,300.ha-1.yr-1 (mean $US 56.ha-1.yr-1, expressed per unit area of remaining natural vegetation).
They were again highest in Critically Endangered (mean of $US 90.ha-1.yr-1) and lowest in the
Least Threatened vegetation types ($US 40.ha-1.yr-1).

Keywords: land price, opportunity cost, vegetation types, biodiversity conservation, Western Cape

                               Estimating Land Prices and Opportunity Costs of Conservation in a Megadiversity Country | 5
1. Introduction Successful biodiversity conservation interventions depend on the availability of reliable information on both their benefits and costs (Balmford et al., 2003, Naidoo and Ricketts, 2006, Naidoo et al., 2006). However, data on conservation costs are scarce. In their absence, planners are often obliged to use poor proxies of cost, such as the area of the land under consideration. This paper considers two particularly poorly studied aspects of opportunity cost: (I) purchase/acquisition costs (the cost of complete loss of the benefits of landownership); and (ii) opportunity cost to landowners of biodiversity-friendly land management on private land (the cost of partial loss of benefits of land ownership). We illustrate how these costs can be estimated reasonably quickly and cheaply in areas with well functioning land markets. Several authors have highlighted the substantial costs of effective biodiversity conservation, and the wide global and regional variation in management costs. The different conservation cost components include management, land purchase and opportunity costs. To date, few studies of the conservation costs have included land purchase/acquisition costs, and fewer still have considered opportunity costs of conservation on private land. Two main approaches guide studies that estimate the opportunity costs of biodiversity conservation. The first involves the use of income values, such as potential net returns (per area.yr- 1) from the most profitable alternative land use. The second approach involves estimating the land acquisition (purchase) costs or, the difference in the price of land under uses that are more or less favourable to conservation. Here, it is assumed that the sale value of a parcel of land is equal to the discounted flow of net revenue that the parcel is expected to generate into the future i.e. its Net Present Value. In our study, we investigated variation in prices of farmland- a proxy for acquisition costs- across Western Cape Province, South Africa. We then used these to explore variation in opportunity costs of partial loss of benefits to landowners arising from a switch in land use management in potentially arable land across vegetation types of varying conservation priority. The Western Cape is an area of global importance for biodiversity: it contains most of one of 34 global hotspots - the Cape Floristic Region (CFR) - and much of a second – the Succulent Karoo. For the CFR, management and transaction costs are known; the management costs of a representative system of conservation areas for the entire CFR is estimated at $US 45.5 million.yr-1, discounted over a 20-year horizon, 6 | Estimating Land Prices and Opportunity Costs of Conservation in a Megadiversity Country
plus an additional annual maintenance cost of $US 29.6 million. These figures compare favourably
to the US $1,100 million.yr-1 estimated benefits from the CFR's terrestrial ecosystem goods and
services.

Here we focus entirely on agricultural land, and exclude other forms of land use. We seek to answer
the following questions:
1. How much do land prices vary across a representative sample of farms in the Western Cape?
2. Which factors predict this variation in land price, and how?
3. To what extent can these factors be used to predict land prices, hence estimate acquisition
     costs across the Western Cape?
4. How do predicted land prices (acquisition costs) and opportunity costs (partial loss of benefits
     of landownership) vary across vegetation types, which differ in conservation priority?

                             Estimating Land Prices and Opportunity Costs of Conservation in a Megadiversity Country | 7
2. Materials & Methods
Study area
The study area comprises the Western Cape Province, an area of 129,370 km2, which includes
most of the Cape Floristic Region (Fig. 1a). The CFR has attracted global attention due to its high
floristic endemism, and high levels of threats to its biodiversity from expansion of intensive
agriculture, urbanisation, and invasive alien vegetations .
Gathering data on land price
We built our dataset from a variety of sources (Table 1), and included all properties for which we
knew:
1. Identity of the property (name or unique identification number);
2. Size of the property (the total area of the land parcel);
3. The value of the property estimated from the sale price (amount paid for an agricultural property
in a completed transaction) or listed price (the price requested for a property on the market). All
sales were assumed to have been undertaken in the open market;
4. Year of sale. Pre-1995 sales were excluded because of the reforms in land policies instituted by
the post-apartheid government in 1994;
5. Percentage of land transformation as estimated from a GIS layer .
We excluded properties if: (1) they could not be accurately located; (2) they were donations for
conservation; (3) they were not bona fide market transactions (e.g. family exchanges ); (4) they less
than 10 ha (farming is considered to be un-economical below 10 ha [M. Botha, ReMax Properties,
pers.comm.], or; (5) In the Estate Agents dataset (Table 1), there was considerable discrepancy
between the property area as reported by the estate agents and the area in the GIS database (>500
ha or >100% of reported area). The final dataset comprised 174 farms. All the properties were
spatially geo-referenced on a digitised 1:50,000 map (Directorate of Surveys & Mapping, SA) using
names and/or unique property (ERF) numbers.
All datasets gave information on sale price with the exception of the estate agents', which, for 27
properties gave information only on listed price. We predicted the equivalent sale price for these
properties based on the relationship between listed and sale price of 25 properties as recorded in
the Cape Property Services dataset:
Sale price = 0.9784 x Listed price (R2 = 0.99, n=25)
8 | Estimating Land Prices and Opportunity Costs of Conservation in a Megadiversity CountryAll analyses were based on sale price and the data processed using Arcview GIS 3.2 software
(ESRI, Redlands, California).
Standardising land price
We used the 1995 - 2002 and the 2003 - 2004 South African GDP deflator to standardize all land
purchase prices to year 2000. We chose year 2000 as the base year because it had the highest
number of property sales in our final dataset, and because it is the base year for national accounts
estimates at constant prices. We expressed land prices in South African Rand per hectare of
farmland (R.ha-1) and in US $.ha-1, using the exchange rate of 1st July 2000 (US$ 1=ZAR 6.79).
Spatial predictors
We conducted a literature review, expert consultations, and interviews with commercial estate
agents and identified 20 potential predictors which we thought might influence agricultural property
prices: mean annual precipitation (Fig. 1b); altitude; topographic diversity (surface area divided by
the planimetric area); proximity to coastline, major and all roads, rivers, and urban centres; mean
agricultural land capability; mean crop production potential for different crops (lupens, lucern,
wheat, oat, barley and wine); property area; percentage of untransformed land (i.e. natural
vegetation: Fig. 1b); human population density in the surrounding area (based on 1996 census);
vegetation groups; and geological groups. We could not generate sufficient data on improvements
to farms (buildings and other infrastructure) for the study area.
We obtained all the spatial layers from the South African National Biodiversity Institute , with the
exception of agricultural land capability and crop production potential that were provided by the
Agricultural Research Council (ARC, Stellenbosch), and population density provided by Statistics
South Africa (StatsSA). The land capability layer classifies land based on its overall suitability for
ecologically sustainable use for crops, grazing, woodland and wildlife. For the last two predictors,
we reclassified the original 120 vegetation types into 20 groups based on a set of biogeographic
features, and also reclassified the original geology layer from 54 geological types to 15 geological
groups based on soil types and fertility.
Statistical analysis
We carried out a preliminary statistical analysis to quantify univariate correlations among potential
predictors and excluded mean crop production potential of oat and barley because they were 99%
correlated to mean crop production potential for wheat. We then used a stepwise Generalized
Linear Model (GLM) in S-PLUS (S-Plus 2000 version, Mathsoft Inc.) to predict land price using 18 of
the predictors listed above (Table 2). Land prices were log10-transformed to fit a normal distribution.
The model was calibrated using 121 randomly selected properties and validated on 53 properties.
From the calibration data set, an initial model was produced by selecting variables on the basis of
R2 values and Akaike's Information Criteria (AIC). The use of stepwise regression reduces
collinearity amongst the variables. We then excluded one predictor at a time (the last predictor
entered in the initial model) and tested model performance on the validation data set. Due to
possible over-fitting in the initial model, models with fewer variables could lead to a higher R2 in the
validation data set. We retained the model with the highest R2 in the validation data set (Table 3), and
then used this final model to predict land price for 30,150 cadastres across the Western Cape
Province.
Estimating Land Prices and Opportunity Costs of Conservation in a Megadiversity Country | 9Estimating opportunity cost for landowners partial loss of benefits of
landownership
In our study area, livestock and crop production are the two main land uses that could conflict with
conservation. Estimating the foregone profit from limiting livestock production involves quantifying
potential losses that could be incurred from stock reduction. Our land price model was not suitable
for that purpose, so we restricted our analysis to crop-suitable areas.
We considered potentially arable land as defined by the agricultural land capability surface. We
selected all 12,278 cadastres – with some remaining natural vegetation – and with a land capability
index between 1 (land suitable for irrigated crops) and 6 (land marginally suitable for crops). We
assumed that conservation of the remaining natural vegetation on private land could be undertaken
voluntarily by landowners, or through legal restrictions. We therefore estimated the cost of partial
loss of benefits of landownership to landowners of retaining remaining natural areas within each
cadastre. We did this by calculating the difference between the predicted current land price (i.e.
with natural vegetation retained) and the predicted land price if all remaining natural habitat were to
be fully converted to agriculture, minus the estimated costs of conversion (Sinden, 2004):
Opportunity Cost = [ [
NPV _
Area
Conversion Cost
Where;
NPV = (LVF - LVP)
Area refers to the farmland portion consisting of natural vegetation; LVF refers to the estimated price
of the farm if it is 100% transformed, and LVP refers to the estimated price of farm at the present level
of transformation. We used a discount rate of 8% to annualise the opportunity cost figures.
Conversion cost comprises of on-farm costs of vegetation clearing, soil ripping and labour. We
estimated the maximum and minimum took the mean cost of conversion as $US 74.ha-1 of
remaining natural vegetation.
This method can generate negative opportunity cost values (where our model estimates that
unconverted land cost more to convert than it would yield following conversion); this situation arose
for one cadastre. Note that because non – converted land is in reality likely to be less productive
than already converted land (but by unknown amount), our approach probably overestimates the
opportunity costs of non – conversion. No data was available at a spatial scale fine enough to
capture within-farm variations in crop suitability.
The cost of complete (acquisition costs) and partial loss of benefits of land
ownership in relation to biodiversity conservation priorities
To explore the relationship between opportunity cost and conservation priority, we assigned our
farms to one of four conservation priority classes based on their predominant vegetation type
(Table 4). These classes; Critically Endangered (CE), Endangered (EN), Vulnerable (VU) and Least
Threatened (LT) reflect national biodiversity targets for each vegetation type, and the extent to
which they have been transformed .
10 | Estimating Land Prices and Opportunity Costs of Conservation in a Megadiversity CountryWe divided the sum of the predicted land prices for all 30,102 cadastres assigned to a given
vegetation type by their total area to calculate mean land price per hectare of farmland for that
vegetation type, and then calculated the area-weighted mean price per hectare of farmland for all
the vegetation types in a given priority class. Similar calculations were done for estimating the mean
cost of partial loss of benefits of landownership (opportunity cost)/ha of remaining natural
vegetation.
Estimating Land Prices and Opportunity Costs of Conservation in a Megadiversity Country | 113. Results Variation in land price Our dataset revealed very substantial variation in land prices across Western Cape, spanning more than four orders of magnitude (from $US 15.ha-1 to 178 000.ha-1 of farmland) (Fig. 1a). This striking variation was not the result of bias in our sample: the frequency distribution of property sales in our final dataset was remarkably similar to that for all agricultural properties listed in a reference dataset, the Farmer's Weekly (n=529 farms). The modal band for land prices was between $US 101 and 1000.ha-1 of farmland (Fig. 2). Land price model The best model for predicting land price included four predictors: mean annual precipitation; percentage of untransformed land; property area; and topographic diversity (R2 = 0.66 and 0.67 for the calibration and validation data sets respectively; Table 3). We checked that land prices did not vary systematically across our nine data sources (by entering source as a further term in the GLM), but found no effect. We then explored the partial effects of the model predictors by plotting residual land prices against each predictor. Residual land prices were positively associated with mean annual precipitation (Fig. 3a), and negatively related to the percentage of untransformed land (Fig. 3b). After accounting for the association with both mean annual precipitation and percentage of untransformed land, lower prices were paid per hectare of farmland for larger land parcels (Fig. 3c). Finally, we observed a negative association between residual land prices and topographic diversity of farms; rugged land was relatively cheap (Fig. 3d). Estimating the opportunity cost of outright land purchase (acquisition cost) To estimate the land purchase (acquisition) cost, we extrapolated the predicted land price for each cadastre to generate a land price map for the province (Fig. 4a). Areas of high conservation priority have high acquisition costs. The mean predicted land price was $US 1,160.ha-1 of farmland for Critically Endangered (CE) vegetation types, $US 970.ha-1 for Endangered (EN) vegetation types, $US 490.ha-1 for Vulnerable (VU) vegetation types, and $US 220.ha-1 for Least Threatened (LT) vegetation types. Surprisingly, even within each priority class, there was considerable variation; Land prices ranged from $US 590 to 5,600.ha-1 of farmland 12 | Estimating Land Prices and Opportunity Costs of Conservation in a Megadiversity Country
within CE vegetation types, from $US 260 to 9,000.ha-1 of farmland within EN vegetation types, from
$US 126 to 2,300.ha-1 of farmland within VU vegetation types, and from $US 37 to 9,130.ha-1 of
farmland within the LT vegetation types.

Estimating opportunity cost of retaining natural vegetation on private land
The mean estimated opportunity cost per hectare of retaining the remaining natural vegetation was
$US 56.ha-1.yr-1. However, this masked very substantial variation across the province, with costs
per unit area for individual cadastres ranging from negative cost to $US 8,300.ha-1.yr-1. More than
90% of the cadastres had a predicted mean opportunity cost of less than $US 500.ha-1.yr-1 (Fig.
4b).

The highest opportunity costs are incurred in CE vegetation types (mean of $US 90.ha-1 of
remaining natural vegetation/yr). EN vegetation types incur a mean opportunity cost equivalent to
$US 70.ha-1.yr-1, VU vegetation types, $US 60.ha-1.yr-1, and LT vegetation types, $US 40.ha-1 of
remaining natural vegetation/yr (Fig. 5). Considerable variation was found among vegetation types
of the same class; for example opportunity cost for CE vegetation types ranged from $US 52 to
554.ha-1.yr-1, (Fig. 5).

                            Estimating Land Prices and Opportunity Costs of Conservation in a Megadiversity Country | 13
4. Discussion Variation in land prices and opportunity costs of vegetation retention on private land Our analyses have yielded two main results. Firstly, we found enormous variation – of more than four orders of magnitude – in observed land prices (from $US 15 to 178 000.ha-1 of farm land: Fig 1a) and predicted land prices (acquisition costs: Fig.4a) across the Western Cape. Similar variation applied to our estimated opportunity cost of retaining natural vegetation of private land (from negative cost to 8 300.ha-1 of remaining natural vegetation/yr: Fig 4b). Secondly, both acquisition and opportunity cost of vegetation retention on private land co-varied positively with conservation priority; both were highest within Critically Endangered, and lowest within Least Threatened vegetation types. Three important sets of caveats should be considered. Firstly, while our model of land price was based on intuitively sensible predictors and had reasonable predictive power (similar to that reported by, its application for conservation planning effectively assumes that the current price of land captures the expected NPV of future benefits from that land. While this is true in well functioning land markets, rigidities in the South African land market may make this assumption untenable; compulsory land acquisition may inflate land prices beyond our current estimates. Secondly, our model does not take into account the dynamics in the land markets, and other factors such as the expansion of markets e.g. for wine, creating pressure to convert land to viticulture; and the enactment of new land use legislations e.g. National Environmental Management: Biodiversity Act, that could impact on conservation outcomes. Third, our method assumes that non-converted land has the potential upon conversion to be as profitable as converted land (under similar environmental conditions). This assumption may be wrong; hence our estimates of absolute cost should be treated with caution. Nevertheless, we believe the extent and pattern of variation we found still hold. Given the wide variations in management costs, our findings are not entirely surprising, but they are nevertheless striking; opportunity costs (like other costs) are highest in areas of high conservation priority because these areas are characterised by multiple socio-economic pressures. This variation has crucial implications for conservation planning and practice. 14 | Estimating Land Prices and Opportunity Costs of Conservation in a Megadiversity Country
Application to conservation planning and policy
In most conservation planning exercises, decisions on the allocation of resources are made purely
on biological criteria, ignoring socio-economic constraints. However, variability in economic
factors can be just as important as ecological variability for conserving biodiversity efficiently and
effectively. That is certainly true in the Western Cape, where we found that the variations in
opportunity costs are enormous (Fig. 4), where costs co-vary positively with conservation priority
identified on the basis of biological criteria (Fig. 5). Most surprisingly, even within high conservation
priority areas (such as CE vegetation types), within-class variations in opportunity costs are
considerable. These findings suggest that explicitly incorporating (rather than ignoring) such cost
variation could contribute substantially to refining of conservation priorities as a first step towards
efficiency. The second step involves investigating the extent to which addressing costs changes
priorities i.e. determining the efficiency gains on no-cost and cost accounted scenarios, for which
studies are now underway in the CFR.

Lastly, moving from planning to implementation, our results can be useful in two ways. First, the
land acquisition costs surface (Fig 4a) is useful in identifying opportunities for strategic expansion
of reserves between and within-conservation priority classes given a limited budget. Second, our
estimation of opportunity cost for landowners of retaining natural vegetation on private land (Fig.
4b) can inform the development of proposed off-reserve conservation mechanisms, including
conservation easements and payments for biodiversity services. Our results can be used to
determine land owners payment level that is at par with the opportunity costs of compliance in a
payment for biodiversity scheme, with the variations in costs, which we uncovered, reflected on
variable levels of payments. These mechanisms have already been initiated to encourage
landowners to protect Critically Endangered vegetation types (M. Botha, Botanical Society of
South Africa. Pers. comm.). Our study forms an initial first step towards the integration of economic
costs into conservation planning in the study area, with a potential for replication in other African
countries to help increase cost-effectiveness of conservation interventions.

                              Estimating Land Prices and Opportunity Costs of Conservation in a Megadiversity Country | 15
References ARMSWORTH, P. R., DAILY, G. C., KAREIVA, P. & SANCHIRICO, J. N. (2006) Land market feedbacks can undermine biodiversity conservation. Proc. of the Nat. Acad. of Sciences, 103, 5403-5408. BALMFORD, A., GASTON, K. J., BLYTH, S., JAMES, A. & KAPOS, V. (2003) Global variation in terrestrial conservation costs, conservation benefits, and unmet conservation needs. Proc. of the Nat. Acad. of Sciences, 100, 1046-1050. BLOM, A. (2004) An estimate of the costs of an effective system of protected areas in the Niger Delta – Congo Basin Forest Region. Biod. and Conserv. 13, 2661-2678. BRUNER, A. G., HANKS, J. & HANNAH, L. (2003) How Much Will Effective Protected Areas Systems Cost? . Vth World Parks Congress, 8-17 September, 2003. Durban, South Africa. CHOMITZ, K. M., ALGER, K., THOMAS, T. S., ORLANDO, H. & NOVA, P. V. (2005) Opportunity costs of conservation in a biodiversity hotspot: the case of southern Bahia. Envir. and Dev. Econ. 10, 293- 312. COWLING, R. M., PRESSEY, R. L., ROUGET, M. & LOMBARD, A. T. (2003) A conservation plan for a global biodiversity hotspot--the Cape Floristic Region, South Africa. Biol. Conserv. 112, 191-216. DEPARTMENT OF AGRICULTURE AND ENVIRONMENTAL AFFAIRS (2004) Guide to Machinery Costs. Pretoria, Directorate of Agricultural Economics. DIDIZA, T. T. (2006) Land and Agrarian Reform in South Africa 1994-2006: Presentation by Minister for Agriculture and Land Affairs, Republic of South Africa. International Conference on Agrarian Reform and Rural Development, March 2006, Brazil. Brazil, Ministry of Agriculture and Land Affairs, South Africa. DRIVER, A., MAZE, K., ROUGET, M., LOMBARD, A. T., NEL, J., TURPIE, J. K., COWLING, R. M., DESMET, P., GOODMAN, P., HARRIS, J., JONAS, Z., REYERS, B., SINK, K. & STRAUSS, T. (2005) National Spatial Biodiversity Assessment 2004: priorities for biodiversity conservation in South Africa. Pretoria, South African National Biodiversity Institute. EMERTON, L. (1999) Balancing Opportunity Costs of Wildlife Conservation for Communities Around Lake Mburo National Park, Uganda. Evaluating Eden Series. London, International Institute for Environment and Development. FAIRBANKS, D. H. K., HUGHES, C. J. & TURPIE, J. K. (2004) Potential impact of viticulture expansion on habitat types in the Cape Floristic Region, South Africa. Biod. and Conserv. 13, 1075- 1100. 16 | Estimating Land Prices and Opportunity Costs of Conservation in a Megadiversity Country
FAIRBANKS, D. H. K., THOMPSON, M. W., VINK, D. E., NEWBY, T. S., VAN DEN BERG, H. M. &
EVERARD, D. A. (2000) The South African Land-cover Characteristics Database: a synopsis of the
landscape. S. Afri. J. of Sci. 96, 69-82.

FERRARO, P. J. (2002) The local costs of establishing protected areas in low-income nations:
Ranomafana National Park, Madagascar. Ecol. Econ. 43, 261-275.

FERRARO, P. J. (2003) Assigning priority to environmental policy interventions in a heterogeneous
world. Journ. of Pol. Anal and Manage. 22, 27.

FRAZEE, S. R., COWLING, R. M., PRESSEY, R. L., TURPIE, J. K. & LINDENBERG, N. (2003)
Estimating the costs of conserving a biodiversity hotspot: a case-study of the Cape Floristic Region,
South Africa. Biol. Conserv. 112, 275-290.

INTERNATIONAL MONETARY FUND (2004) Staff Report for 2004-Article IV Consultation with South
Africa. Pretoria, IMF.

JAMES, A., GASTON, K. J. & BALMFORD, A. (2001) Can We Afford to Conserve Biodiversity?
Bioscience, 51, 43-52.

JOHNSON, J. B. & OMLAND, K. S. (2004) Model selection in ecology and evolution. Trends in Ecol.
& Evol. 19, 101-108.

MOORE, J., BALMFORD, A., ALLNUTT, T. & BURGESS, N. (2004) Integrating costs into
conservation planning across Africa. Biol. Conserv. 117, 343-350.

MYERS, N., MITTERMEIER, R. A., MITTERMEIER, C. G., DA FONSECA, G. A. B. & KENT, J. (2000)
Biodiversity hotspots for conservation priorities. Nature, 403, 853-858.

NAIDOO, R. & ADAMOWICZ, W. L. (2006) Modeling Opportunity Costs of Conservation in
Transitional Landscapes. Conserv. Biol. 20, 490-500.

NAIDOO, R., BALMFORD, A., FERRARO, P. J., POLASKY, S., RICKETTS, T. H. & ROUGET, M. (2006)
Integrating economic costs into conservation planning. Trends in Ecol. & Evol. 21, 681-687.

NAIDOO, R. & RICKETTS, T. H. (2006) Mapping the Economic Costs and Benefits of Conservation.
PLoS Biology, 4, e360.

NORTON-GRIFFITHS, M. & SOUTHEY, C. (1995) The opportunity costs of biodiversity conservation
in Kenya. Ecol. Econ. 12, 125-139.

PAGIOLA, S., AGOSTINI, P., GOBBI, J., DE HAAN, C., IBRAHIM, M., MURGUEITIO, E., RAMIREZ, E.,
ROSALES, M. & RUIZ, J. P. (2004) Paying for Biodiversity Conservation Services in Agricultural
Landscapes. Environmental Economics Series Paper. Washington D.C., Environment Department,
World Bank.

                             Estimating Land Prices and Opportunity Costs of Conservation in a Megadiversity Country | 17
REPUBLIC OF SOUTH AFRICA (2004) National Environmental Management: Biodiversity Act, 2004. South Africa. ROUGET, M., RICHARDSON, D. M., COWLING, R. M., LLOYD, J. W. & LOMBARD, A. T. (2003) Current patterns of habitat transformation and future threats to biodiversity in terrestrial ecosystems of the Cape Floristic Region, South Africa. Biol. Conserv. 112, 63-85. SINDEN, J. A. (2004) Estimating the opportunity costs of biodiversity protection in the Brigalow Belt, New South Wales. Journ. of Environ. Manage. 70, 351-362. STATISTICS SOUTH AFRICA (2003) Statistical Release P0441: Gross Domestic Product, Third Quarter 2003. Pretoria, Statistics South Africa. STATISTICS SOUTH AFRICA (2004) Statistical Release P0441: Gross Domestic Product, Third Quarter 2004. Pretoria, Statistics South Africa. TURPIE, J. K., HEYDENRYCH, B. J. & LAMBERTH, S. J. (2003) Economic value of terrestrial and marine biodiversity in the Cape Floristic Region: implications for defining effective and socially optimal conservation strategies. Biol. Conserv. 112, 233-251. WEERSINK, A., CLARK, S., TURVEY, C. G. & SARKER, R. (1999) The Effect of Agricultural Policy on Farmland Values. Land Econ. 75, 425-439. 18 | Estimating Land Prices and Opportunity Costs of Conservation in a Megadiversity Country
Tables
Table 1. List of datasets on land purchases.

    Source                                      Spatial Locality              Period          Original Size No Used

    National Dataset
    1. Farmer’s Weekly Journal                  Farm Name                     2003-2004       529               61
    2. SANParks a                               Farm Name & ERF No            1998-2003       34                17
    3. WWF-SA                                   Farm Name & ERF No            1968-2002       94                19

    Provincial Dataset
    1. Estate Agents                            Farm Name                     2004            50                35
    2. Western Cape Department of Agriculture   Farm Name & ERF No            2001-2004       68                18
    3. Cape Property Services b                 Farm Name & ERF No            1995-2004       408               1

    Local Dataset
    1. FFI c                                    Farm Name                     1997-2002       16                10
    2. Parker, R MSc Project                    Farm Name                                     40                9
    3. Landowners                               Farm Name & ERF No                            4                 4
    Total sample size (n)                                                                                       174

a
 South Africa National Parks Authority
b
  Most of the CPS data were excluded because of the reasons explained in page 7. The dataset also contained                       -
information on non-agricultural properties (commercial, residential and other property types).
c
  Fauna and Flora International.

                                  Estimating Land Prices and Opportunity Costs of Conservation in a Megadiversity Countryr | 19
Table 2. Variables used in the model to predict land prices in Western Cape
Province, South Africa.
a
Variable Units Group Entire Study Area (n=30150)
Mean Std Dev Min Max
MAP mm/yr climate 349.08 196.83 33.90 2036.8
ALT meters topography 351.13 309.91 1.10 2096.60
ROUGHNESS topography 106.04 8.75 100.00 244.88
DCOAST meters spatial 512.34 451.14 0.00 2652.0
DROAD1 meters spatial 98.69 120.39 0.00 1126.0
DROAD12 meters spatial 10.82 18.78 0.00 204.00
DRIVERS meters spatial 11.93 19.76 0.00 213.00
DURBAN meters spatial 101.77 98.71 0.00 716.00
LANDCAP score (1-9) production 5.72 1.49 3.00 8.00
LUPENS tons/ha production 0.95 0.84 0.00 3.7
LUCERN tons/ha production 13.47 5.64 0.00 22.80
WHEAT tons/ha production 2.27 1.56 0.00 6.00
WINE tons/ha production 3.93 3.29 0.00 15.90
AREA ha farm size 421.51 921.77 10 40072.50
NATVEG percentage land use 54 41 0.00 100
POPDEN log (people/QDS) 3.72 0.85 1.40 6.10
VEGGROUP 20 categories vegetation
GEOL.FERT 15 categories geology
a MAP = mean annual precipitation; ALT = altitude above sea level; ROUGHNESS = topographic diversity; DCOAST = minimum distance
from the coastline; DROAD1 = distance to the nearest major road; DROAD12 = distance to the nearest minor or major road; DRIVERS =
distance to the nearest river; DURBAN = distance to the nearest urban center; LANDCAP = land potential based on geo-physical and
climatic variables; LUPENS = mean potential lupens production; LUCERN = mean potential lucern production; WHEAT = mean potential
wheat production; WINE = mean potential dry wine production; AREA = total area of farm; POPDEN = mean population density;
VEGGROUP = dominant vegetation group; GEOGROUP = dominant geological group.
Table 3. Stepwise Generalised Linear Model showing the steps, co-efficient
values to reflect the statistical effects for the predictors, residual deviance
and Akaike's Information Criteria (AIC)
a b
Model + Step DF Resid.Dev Co-efficient Values AIC
105.45 -19.26
1 MAP 1 65.93 0.001923 -75.97
2 + NATVEG 1 50.33 -0.546204 -107.70
3 + AREA 1 43.98 -0.348359 -122.57
4 + ROUGHNESS 1 41.12 -0.019553 -128.99
a variables were mean annual precipitation (MAP); percentage of untransformed land (NATVEG); area of property (AREA);
and topographic diversity (ROUGHNESS)
bAkaike’s Information Criteria
20 | Estimating Land Prices and Opportunity Costs of Conservation in a Megadiversity CountryPriority Class for Vegetation Conservation No. Of Vegetation Types
Critically Endangered (CE) 13
Endangered (EN) 23
Vulnerable (VU) 8
Least Threatened (LT) 12
Total 56
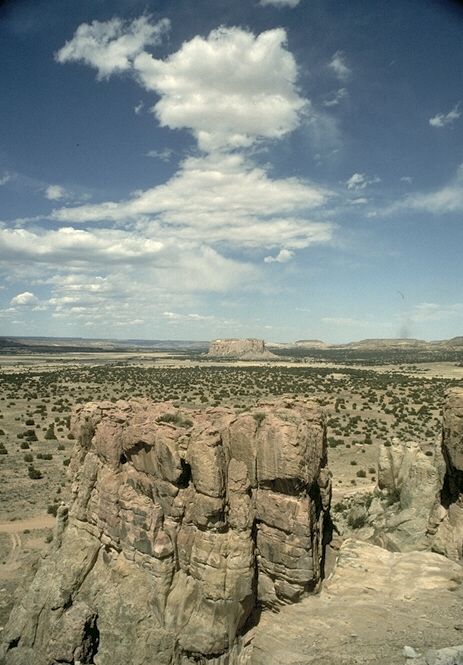
Estimating Land Prices and Opportunity Costs of Conservation in a Megadiversity Country | 21Figures Figure 1: Study area showing a) district boundaries and spatial variation in observed land prices ($US.ha-1); and b) land transformation and mean annual precipitation. 22 | Estimating Land Prices and Opportunity Costs of Conservation in a Megadiversity Country
Figure 2. Frequency distribution of property sale price ($US.ha-1) for study
dataset and Farmer's Weekly dataset (used as a Reference dataset).

Figure 3a. Residual land prices ($US.ha-1) in relation to mean annual
precipitation.

                       Estimating Land Prices and Opportunity Costs of Conservation in a Megadiversity Country | 23
Figure 3b. Residual land prices ($US.ha-1) in relation to the percentage of untransformed land Figure 3c. Residual land prices ($US.ha-1) in relation to property area 24 | Estimating Land Prices and Opportunity Costs of Conservation in a Megadiversity Country
Figure 3d. Residual land prices ($US.ha-1) in relation to topographic diversity

                       Estimating Land Prices and Opportunity Costs of Conservation in a Megadiversity Country | 25
Figure 4. Predicted surface of a) land prices in ($US.ha-1) as a proxy for acquisition costs (total loss of benefits of landownership), and b) opportunity costs of retaining natural vegetation on private land in ($US.ha-1.yr-1) (partial loss of benefits of land ownership) 26 | Estimating Land Prices and Opportunity Costs of Conservation in a Megadiversity Country
Figure 5. Opportunity cost ($US.ha-1 of remaining natural vegetation per year)
showing upper 90 percentile, lower 10 percentile and mean per priority class
of the four vegetation types (CE-Critically Endangered; EN-Endangered; VU-
Vulnerable; and LT-Least Threatened) in Western Cape Province.

                      Estimating Land Prices and Opportunity Costs of Conservation in a Megadiversity Country | 27
The African Technology Policy Studies Network (ATPS) is a multi- African Technology
disciplinary network of researchers, private sector actors and Policy Studies Network
policy makers promoting the generation, dissemination, use and Contact the Executive Director at
mastery of science, technology and innovation (ST&I) for African The Chancery, 3rd Floor, Valley Rd.
development, environmental sustainability and global inclusion. P O Box 10081, 00100-Nairobi, Kenya
Tel: (254 020) 2714092, 2714168,
ATPS intends to achieve its mandate through research, capacity
2714498, 2723800
building and training, science communication/dissemination and Fax: (254 020) 2714028
sensitization, participatory multi-stakeholder dialogue,
knowledge brokerage, and policy advocacy. http://www.atpsnet.org
Science, Technology and Innovation
for African Development
ISBN: 978-9966-030-10-8You can also read