GREATER CHRISTCHURCH LABOUR MARKET MAPPING REPORT - EMPLOYER FORUMS - Enterprise North ...
←
→
Page content transcription
If your browser does not render page correctly, please read the page content below
GREATER CHRISTCHURCH
LABOUR MARKET MAPPING REPORT

      EMPLOYER FORUMS

                               1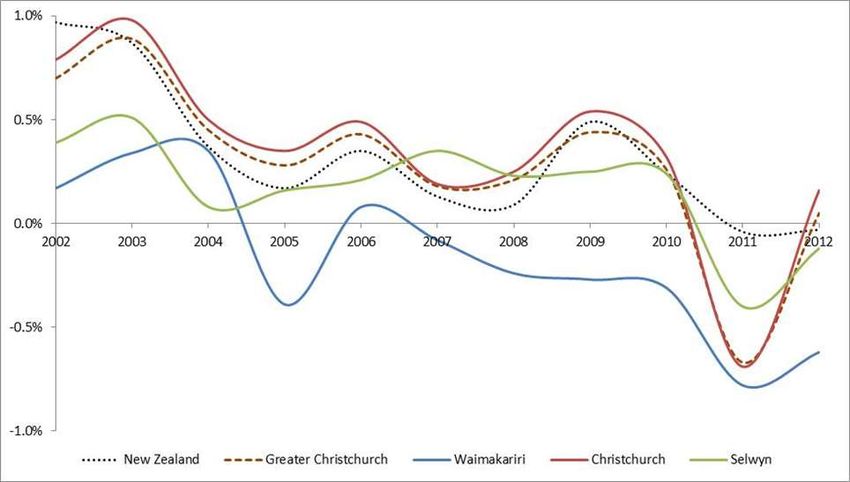
Contents

About this report................................................................................................................... 4
Executive Summary ............................................................................................................... 5
Greater Christchurch Profile .................................................................................................. 6
Status of the Labour Market .................................................................................................. 9
Demand for Labour ............................................................................................................. 16
Supply of Labour ................................................................................................................. 19
Opportunities ...................................................................................................................... 25

                                                                                                                                     2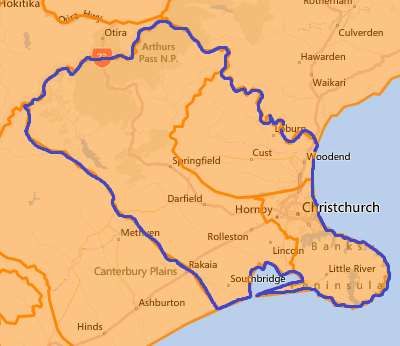
As a result of the Memorandum of Understanding with the government and the Mayors
Taskforce for Jobs and the resulting partnership with the Ministry of Business, Innovation
and Employment (MBIE) I am pleased to present this report. The Taskforce and MBIE
gathered this information through a series of meetings with Mayors and local Economic
Development Agencies and the statistics available to the Ministry.

The Mayors' unique position in communities has enabled them to bring together key
stakeholders to discuss the information and provide local, on the ground, in time, advice and
recommendations to government about the support required to ensure regional economic
growth and development and provide local jobs for local people.

Developing skills for local economies is key to the sustainability and vitality of communities
and to improving outcomes for everyone but in particular our young people. It is clear in
the report that we need to address this issue as a priority and see the relatively youthful
population in the region as an extremely valuable resource, which must be nurtured,
encouraged and enabled to participate fully. The information contained in the report will
assist our regions to make clear and confident decisions about the local labour market.

I am very pleased to see that the government wants to hear from our communities and I am
confident the information gathered at our regional meetings will be invaluable to their
decision-making with regards to allocation of resources to our regions.

Yours sincerely

Mayor Dale Williams [Otorohanga]
Chair, Mayors Taskforce for Jobs

We welcome this report and an opportunity to discuss our region together.The health
of our regions and small centres is vital to us all. As Mayors we have close contact
with our communities and a very real interest in the partnerships we can develop
between the government sector and our local businesses and communities.

             Kelvin Coe, Mayor
                                                             David Ayes, Mayor

                                                                                            3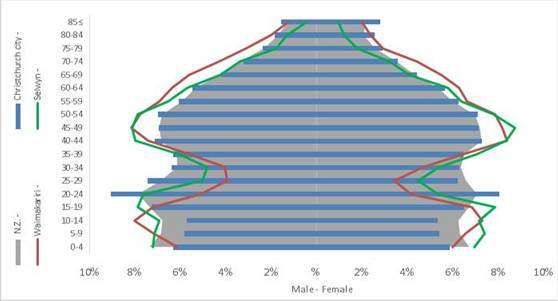
About this report
This report provides a summary of the greater Christchurch labour market to provide a
context for discussions about economic development.

It was prepared as a result of the partnership between the Ministry of Business, Innovation
and Employment (MBIE) and the Mayor’s Taskforce for Jobs (MTFJ). This partnership aims to
maximise opportunities for local and regional economic development, skills, employment
and innovation by gathering better intelligence on regional economies and improving the
quality of regional information.

The report is, in part, designed to improve decision making capability, particularly around
the investment and priority of effort of Government agencies and local councils. It is also
intended to better inform employers, education providers, Iwi Māori and other regional
stakeholders on the current and future shape of their labour market and the challenges and
opportunities these present.

Stakeholder Forums

Stakeholder Forums are for employers, business owners, tertiary education providers and
iwi to talk about their business needs, challenges and opportunities, labour and skills
shortages, planning and investment and smarter ways of doing business. More importantly
Stakeholder Forums will discuss how local and central government can help to boost local
labour markets and regional economies into the future.

From the information and feedback generated by the forums, local specific target projects
will be explored and designed. Such projects may include identifying how employers can be
more confident in taking on new workers, as well as how local and central Government can
support businesses to be successful.

                                                                                         4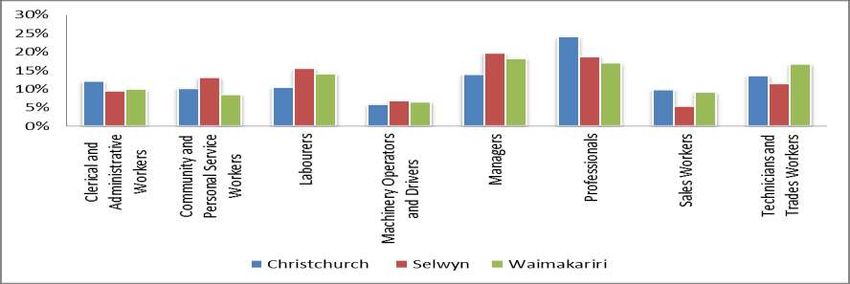
Executive Summary
Greater Christchurch comprises the territorial authorities of Christchurch City, Selwyn and
Waimakariri Districts and is part of the larger Environment Canterbury Regional Council.
Greater Christchurch has a population of around 455,000 people. Christchurch accounts for
80 percent, while Selwyn and Waimakariri account for nine and 11 percent respectively.

Greater Christchurch has a less multicultural population than New Zealand as a whole,
although Māori remain important in the region due in part to the economic strength of Ngāi
Tahu following its Tiriti settlement in 1997. Ngāi Tahu has capital, property, seafood and
tourism initiatives.

As in many other New Zealand regions, greater Christchurch’s population is ageing, with
forecasts suggesting some redistribution of the population and/or migration to Selwyn and
Waimakariri. The region’s youth have huge educational potential with action needed to lift
the educational achievement of young Māori.

The sectoral composition of the greater Christchurch economy resembles the national
economy, and the region does not particularly rely on any one sector. Manufacturing, the
biggest employing industry, is distributed across the region. Christchurch provides services
(e.g. health care, education) to the rest of the region, and agriculture, focused on dairy,
sheep, beef and grain farming, is concentrated in the rest of Canterbury.

Different industries were affected by the earthquakes at varying degrees. Agriculture did not
appear to be affected, whereas manufacturing businesses were. However, the
manufacturing industry seems to have bounced back relatively quickly, with manufacturing
activity now higher than national levels. Service activities, such as tourism and international
education, which were generally more tied to the city centre were more severely affected,
and will take longer to recover.
Following the earthquakes, the greater Christchurch region, has been facing big labour
market challenges. While the decline in the greater Christchurch’s working-age population
that followed the earthquakes has started to reverse, with a net inflow of migrants to the
region, demand for labour continues to be strong. Demand in the construction and
engineering sector is particularly strong.
The rebuild over the next few years will mean large inflows of skilled and less skilled labour,
which present opportunities for efforts to ensure those migrants are retained in greater
Christchurch. The rebuild is also a great opportunity for the education sector to make sure it
is closely aligned with the needs of businesses. There is also a challenge that rapid increases
in the construction sector will create skill shortages in other industries such as the
manufacturing and engineering sectors.
Economic development opportunities for greater Christchurch region rest not only on a
successful rebuild, but also on further developing its key assets and leveraging its current
strengths to develop higher value-added businesses. The region will also want to capitalise
on the inflows of people, skills and resources arriving for the rebuild. Providing an
environment that attracts and grows businesses and building the education and skills of its
young people will be key to realising the full economic potential of the region.

                                                                                             5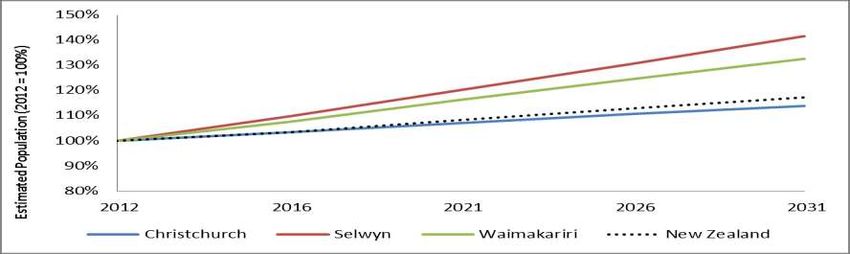
Greater Christchurch Profile
Key Points
Selwyn and Waimakariri’s populations are growing faster than the New Zealand
population overall
Christchurch’s population declined following the earthquake, but the trend is
reversing and growth is predicted at slightly slower rates than the rate for New
Zealand
The region has a high concentration of 15-29 year olds and an ageing working age
population
Forecasts suggest a redistribution of the population within the region
The region’s population is ageing, like most regions in the country.
Population and population change
Christchurch, Selwyn and Waimakariri have a combined population of around 455,000
people. With a population of 363,000 Christchurch accounts for 80 percent of these, while
Selwyn and Waimakariri account for nine and 11 percent, with populations of 42,000 and
49,000 respectively. Christchurch’s population has remained fairly stagnant since 1996,
although a drop did occur following the earthquake. Selwyn and Waimakariri’s populations
have increased by 21 and almost 12 percent respectively since 1996.
Like the population of New Zealand as a whole, the populations of Christchurch, Selwyn and
Waimakariri are all forecast to increase to 2031 1 (figure 1), with the populations of Selwyn
and Waimakariri forecast to increase faster than both Christchurch and New Zealand as a
whole.
Even with the impetus and concentrated activity of the rebuild, the population growth of
Christchurch is forecast to not quite keep pace with that of New Zealand as a whole.
Figure 1. Population projections for Christchurch, Selwyn, Waimakariri and New Zealand
Source: Statistics New Zealand. The figure shows the medium projection by Statistics New Zealand.
1
Projections are as at October 2012, so account for the effects of the earthquakes.
6The current population of Christchurch, Selwyn and Waimakariri is currently heavily
concentrated in the 15 to 29 age group and also the 40 to 54 age group (figure 2).
Christchurch has a lower proportion of under-15s than there are nationwide or in Selwyn or
Waimakariri, but a spike of 20-24 year olds, presumably reflecting its status as a university
city and a centre for tertiary education in the South Island. However, the relatively high
proportions of people in these student age groups (compared to other greater Christchurch
age groups) are similar to national averages.
Figure 2. Population pyramid showing the population by age, gender and district, 2012.
Source: Statistics New Zealand.
Table 1 shows projected population growth to 2031 by age groups in the three areas, as well
as greater Christchurch and New Zealand. In general, greater Christchurch is forecast to have
population increases in all age groups that are similar to New Zealand as a whole, but
growth will be more concentrated in the youngest and oldest age groups. Christchurch is
projected to have slower growth for all age groups than for New Zealand as a whole, while
Selwyn and Waimakariri are projected to have population increases much higher than
national averages across all age groups, with growth being especially strong in the 65+ age
group.
Table 1. Projected population growth rate by age groups, 2012 to 2031
Age Group Christchurch Selwyn Waimakariri Greater New Zealand
Christchurch
0-14 years 2% 30% 11% 6% 5%
15-39 years 4% 40% 29% 10% 12%
40-64 years 1% 10% 7% 3% 4%
65+ years 78% 169% 119% 89% 81%
All Age Groups 14% 42% 33% 18% 17%
Source: Statistics New Zealand.
7The predominance in greater Christchurch of those aged 15 to 29 is an important current
strength that the region needs to capitalise on by making it easy and attractive for those
young people to stay in the region. Boosting the proportions of younger age groups in the
region will help counteract population ageing.
Comparing the three districts, Selwyn and Waimakariri are forecast to become more
important in the region in terms of population concentration, especially in the younger and
older age groups (less so in the 40-64 age group). This suggests inflows into those areas from
Christchurch and/or further afield.
To enhance economic activity and future economic growth, Christchurch would benefit from
boosting its population of young working age adults with or without children, and
developing strategies to retain them. This would be a competitive undertaking, as most of
the rest of the country is in a similar situation.
Ethnicity
The population of greater Christchurch is less multicultural than that of New Zealand as a
whole, with Christchurch having the greatest ethnic diversity in the region.
Figure 3. Ethnic make-up of Christchurch City, Selwyn, Waimakariri and New Zealand
Source: Census (2006).
Note: MELAA refers to Middle Eastern, Latin American or African.
Māori are important in greater Christchurch. Ngāi Tahu is the largest iwi in Christchurch and
in Canterbury. It was able to settle its historical Tiriti grievances with the Crown in 1997,
receiving $170 million in financial redress, which enabled Ngāi Tahu to become a significant
economic player in the South Island and indeed nationally. Its assets are managed by Te
Runanga o Ngāi Tahu, which has four subsidiary companies focusing on property, capital,
seafood and tourism respectively. Ngāi Tahu Property is particularly significant in
Christchurch with big box retail, public buildings, private housing and office developments.2
2
Canterbury Development Corporation. Background Paper to the Christchurch Economic
Development Strategy February 2013. www.cdc.org.nz
8Status of the Labour Market
Key Points
Labour market indicators for Christchurch are similar to those for New Zealand
The participation and employment rate in Selwyn is much higher than the rate for
New Zealand overall, and the unemployment rate very low
Waimakariri has the lowest participation and employment rate
NEET numbers in Canterbury tend to be below the national average
The largest employing industries in greater Christchurch are manufacturing, health
care, retail trade, construction and education
Canterbury has a predominance of small businesses.
Table 2 shows the labour market indicators for greater Christchurch. Greater Christchurch’s
labour force tends to be concentrated in Christchurch in terms of numbers, although of the
three areas, Selwyn has the highest labour force participation and employment rates and
the lowest unemployment rate.3 Christchurch has the second highest employment rate, and
Waimakariri has the lowest at 60.1 percent, which is well below that for New Zealand of
63.4 percent.
Table 2. Labour market indicators, 2013 March year
Not in Labour Force
Total Labour Employment Unemployment
Labour Participation
Force Rate Rate
Force Rate
Christchurch 241,800 105,300 65.4% 6.1% 69.7%
Selwyn 33,100 9,300 76% - 78%
Waimakariri 7,600 4,700 60.1% - 61.9%
Greater Christchurch 282,500 119,300 66.4% 5.6% 70.3%
New Zealand 2,379,100 1,120,600 63.4% 6.8% 68%
Source: Statistics New Zealand, MBIE.
Travel data shows that significant numbers of people commute between the three areas for
work, indicating significant interdependencies in the labour force in the area (Statistics New
Zealand, 2009; Canterbury Regional Transport Committee, 2010).
Figure 4 shows the numbers of people receiving the main benefits in the greater
Christchurch area. It is noticeable that the number of benefit recipients in the greater
Christchurch area is much less than for New Zealand overall. This is due to a large number of
3
The labour force participation rate includes those who are employed (also measured by the
employment rate) and those who are unemployed (the unemployment rate).
9beneficiaries being placed into work in the rebuild where possible. Christchurch has the
highest proportion of people receiving a benefit, followed by Waimakariri and lastly Selwyn.
Consistent with the picture nationwide, the domestic purposes benefit is the most
commonly received benefit in all three areas.
As a result of recent welfare reforms, invalids benefit and sickness benefit recipients will be
more likely to be work-tested from 1 July 2013, which may mean that the population of job
seekers becomes more diverse in terms of its needs for, for example, adjusted or limited
hours.
Figure 4. Benefit recipients (% of working age population), September 2012
14%
12%
10%
8%
6%
4%
2%
0%
Selwyn Waimakariri Christchurch New Zealand
Unemployment benefit Domestic purposes benefit
Invalids benefit Other
Sickness benefit
Source: Ministry of Social Development.
Youth Not in Education, Employment or Training (NEET)
Youth Not in Education, Employment or Training are considered to be disengaged from both
work and education. Youth who are inactive for prolonged periods of time have heightened
risk of poor longer term outcomes, including lower earnings, greater reliance on social
assistance and higher rates of unemployment. This is concerning not only for the individuals
involved, but is also of concern to regional decision-makers, since youth not engaged with
work or education may not only become a longer term liability for the region, but are also a
wasted resource for the region’s growth.
The NEET rate is not available for the districts of greater Christchurch, but the rate for
Canterbury as a whole tends to be lower than the average for New Zealand (figure 5). There
was a relatively large jump from 2008 to 2010, but following the earthquake in 2011 the rate
has fallen. The earthquake resulted in the creation of low skilled employment options, which
absorbed some of previously unemployed youth. Reductions in the NEET rate typically
results from youth staying in school longer, leaving the region, or entering education,
training or employment, all of which explains the drop seen in the Canterbury region.
10The overall NEET rate and trend likely mask significant differences among ethnic groups. At
the nationwide level Māori NEET rates are more than double those of European/Pakeha.
Figure 5. NEET rates (%) for youth aged 18-24 years, Canterbury and New Zealand
20%
18%
16%
14%
12%
10%
8%
6%
4%
2%
0%
2005 2006 2007 2008 2009 2010 2011 2012
Canterbury New Zealand
Source: Statistics New Zealand.
Employment by industry
Table 3 shows employment by industry in the greater Christchurch region. The largest
employing industries as a whole are manufacturing, health care, retail trade, construction
and education.
The sectoral composition of the Canterbury, and indeed greater Christchurch economy,
resembles the national economy, and the region does not particularly rely on any one
sector. Manufacturing, the biggest employing industry, is distributed across the region in line
with each area’s employment share. Christchurch provides services (e.g. health care,
education) to the rest of the region, and agriculture4, focused on dairy, sheep, beef and
grain farming, is concentrated in the rest of Canterbury.
4
The Canterbury region has a real strength in agriculture, and Canterbury now has the highest
average dairy herd size in New Zealand, and correspondingly high productivity levels. So while
agriculture many not be a leading industry in terms of employment numbers, it is a very important
sector to the region.
11Table 3. Employment by industry, 2012
Source: Statistics New Zealand.
In Christchurch, the leading employing industries mirror those for the greater Christchurch
region - manufacturing, health care, retail trade, education and construction. The three
leading sectors –manufacturing, healthcare and retail trade are similar in size at between 10
and 12 percent, and the remaining two are not far behind at roughly 8 percent. The fastest
growing sector over the past 10 years has been the construction sector, with an annual
growth of just over 6 percent. Christchurch has a comparative advantage in manufacturing
with particular strengths in transport, machinery, and food and beverage manufacturing.
Many of Christchurch’s manufacturing businesses are medium to high-tech businesses. Yet,
manufacturing has declined by about 2 percent annually over the past 10 years, which is
slightly more than the decline for New Zealand as a whole (Statistics New Zealand, 2012).
In Selwyn the leading employing industry is agriculture accounting for 19 percent of
employment, followed by public administration, education, manufacturing and construction,
which together account for another 46 percent. Selwyn’s fastest growing industry over the
past 10 years has been construction with annual growth of almost 10 percent. Contrary to
the national trend, and the trend for Christchurch, manufacturing has grown at about 7
percent annually over the past 10 years. This may in part be explained by businesses moving
their manufacturing from Christchurch to Selwyn (Statistics New Zealand, 2012).
12In Waimakariri the leading employing industry is retail trade accouting for 15 percent of
employment, followed by construction (13 percent), manufacturing (12 percent), education
(10 percent) and agriculture (9 percent). Like for both Christchurch and Selwyn, the fastest
growing industry over the past 10 years in Waimakariri has been construction with an
annual growth of just over 10 percent. Retail trade, which accounts for the largest share of
employment, has grown at almost 4 percent annually over the past 10 years. Waimakariri
has also bucked the national trend with manufacturing growing at about 2 percent annually
over the past 10 years (Statistics New Zealand, 2012).
Common to all three districts is the growth of the contruction sector, which has far outpaced
growth in any other of the leading sectors. This is clearly a result of the earthquakes.
Different industries were affected by the earthquakes at varying degrees. Agriculture did not
appear to be affected, whereas manufacturing businesses were. However, the
manufacturing industry seems to have bounced back relatively quickly, with manufacturing
activity now higher than national levels. Service activities, such as tourism and international
education, which were generally more tied to the city centre were more severely affected,
and will take longer to recover (Regional Economic Activity Report, 2013).
Changes in industry
Figure 6 shows the number of filled jobs in the leading industries in the Canterbury area.
Overall, manufacturing has experienced the biggest drop, but much of this drop has
occurred in Christchurch and outside of the greater Christchurch region altogether. Retail
trade has similarly suffered a drop since 2009. As expected, construction has experienced an
overall upward trend, and particularly since the earthquake. The remaining two industries –
health care and education are trending upwards. The rebuild efforts are expected to
translate into high growth in the construction sector, although the volume of construction
work underway is still relatively low (Reserve Bank of New Zealand, March 2013).
13Figure 6. Filled jobs in leading industries in Canterbury, 2002 to 2012
Source: Statistics New Zealand.
Figure 7 shows the patterns of change in the number of employees in the three districts of
greater Christchurch and for New Zealand as a whole, as an index starting from 2002.
Waimakariri and Selwyn have seen the most growth in numbers of employees, with
Christchurch having lower (but still positive) rates of growth, closely aligned to growth rates
for the country as a whole.
Figure 7. Index of number of employees by district, 2002 to 2012
Source: Statistics New Zealand.
Figure 8 shows businesses in Canterbury with at least one employee, of which there were
about 23,000 at 30 October 2012. The predominance of small businesses (with between one
and five staff) is an obvious feature of the business landscape in the region. The industries
with the highest numbers of employers who employ staff are the primary industries
14(agriculture, forestry and fishing), construction, retail trade, professional, scientific and
technical services and manufacturing.
Figure 8. Number of businesses in Canterbury by size (excludes sole traders), October 2012
3,500
3,000
2,500
2,000
1,500 100 and Over
50 to 99
1,000
20 to 49
10 to 19
500
6 to 9
0 1 to 5
Source: Statistics New Zealand.
15Demand for Labour
Key Points
Demand for labour strong across the region, particularly in the construction and
engineering industry
Occupations dominant in greater Christchurch are in short supply nationally
The mix of skills in greater Christchurch is likely to change significantly in the short
and medium terms, but return to a more normal pattern in the longer term.
Following the earthquakes, the greater Christchurch region, has been facing big labour
market challenges. While the decline in greater Christchurch’s working-age population that
followed after the earthquakes now seems reversing, with a net inflow of migrants to the
region (Regional Economic Activity Report, 2013), demand for labour continues to be strong.
Advertised skilled vacancies (figure 9) since the earthquakes have been significantly higher
than for New Zealand overall, with the increase being due to a combination of factors
including new jobs being created and some due to turnover as a result of people leaving the
region. The skilled vacancies index declined in March 2013, more so in Canterbury than
nationally. The reasons for this are not clear, but the decline may reflect a temporary dip in
demand.
Figure 9. Skilled vacancies index for Canterbury and New Zealand (seasonally adjusted)
Source: MBIE.
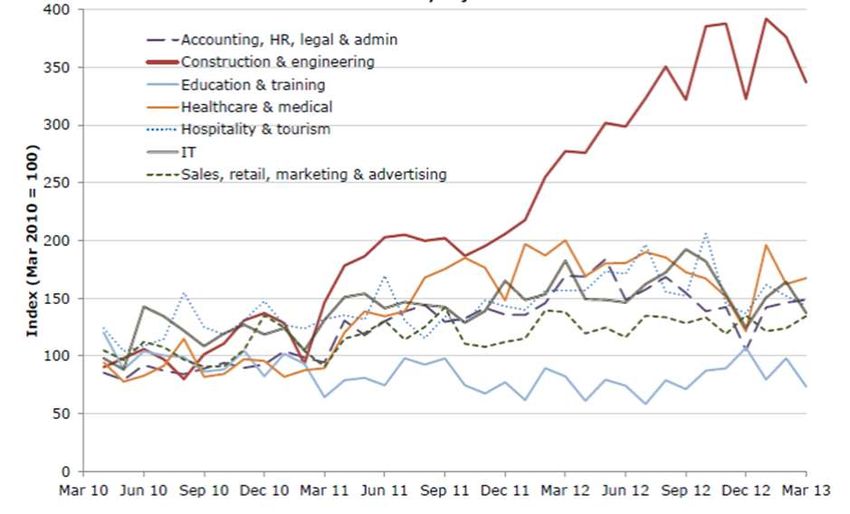
The skilled vacancy index by industry (figure 10) shows that vacancies in the construction
and engineering industry have grown strongly, although somewhat volatile. There is also a
challenge that rapid increases in the construction sector will create skill shortages in other
industries such as the manufacturing and engineering sectors.
16Figure 10. Canterbury skilled vacancies index by industry group (seasonally adjusted)
Source: MBIE.
Breaking down the skilled vacancies index by occupation group (figure 11), shows a
significant increase in technicians and trade, managers and professional vacancies since the
earthquake, especially for technicians and trade vacancies. There has been a large decrease
in the technicians and trade vacancies in March 2013.
Figure 11. Canterbury skilled vacancies index by occupation groups (seasonally adjusted)
Source: MBIE.
17Prior to the earthquakes, workplace skills did not appear to be a major constraint on greater
Christchurch businesses. However, it is likely that businesses did experience at least some of
the labour market challenges that businesses face in other parts of urban New Zealand, and
the decline in the working-age population following the earthquakes is likely to have
exacerbated any already existing labour and skills shortages.
The occupational mix in greater Christchurch is dominated by the occupations in which
employers nationwide are reporting the most difficulty in finding appropriately skilled
workers (i.e. trade persons, managers and professionals) (Statistics New Zealand, 2012). In
Christchurch (and for New Zealand as a whole) the most prevalent occupational groups are
professionals, managers and technicians and trades workers. In Selwyn and Waimakariri the
picture is similar with the addition of labourers (figure 12).
Figure 12. . Employment by Occupation, 2012
Source: Statistics New Zealand.
This occupational mix is likely to change significantly as a result of the rebuild, with
Christchurch seeing increases in numbers of technicians and trade workers, labourers,
clerical and administrative workers and possibly other groups. The occupational mix of
Selwyn and Waimakariri may also change. However, in the longer term, the picture will
return to what it was prior to the earthquakes.
18Supply of Labour
Key Points
High proportions of people with no or low levels of formal qualifications
Educational attainment levels similar to national levels – levels are highest in
Christchurch and Selwyn, and lowest in Waimakariri
Disparities between Māori and Europeans in educational attainment
The region is seeing the arrival of high number of migrants to support the rebuild
Highest Level of Qualification
Basic vocational qualifications and no qualifications dominate in greater Christchurch as they
do nationally (figure 11).
The population of Christchurch tends to be relatively more highly qualified than the
populations of Selwyn or Waimakariri, and the population of New Zealand as a whole.
Figure 13. Highest qualification for those aged 15 years and over
Source: Statistics New Zealand, Census 2006.
Selwyn has a relatively high proportion of people - 35 percent - with basic vocational
qualifications, which is also higher than the national average of 30 percent. In fact across all
levels of vocational training they have more people with these types of qualifications than in
New Zealand as a whole.
19While Waimakariri has a relatively high proportion of people with no qualifications – 27
percent – against 22 percent nationally and has the least degree qualified people (compared
to the other two areas and nationally), they do have more people with vocational
qualifications at all levels than is the case nationally. Compared to the national figures,
Christchurch and Selwyn both have 21 percent of people with no qualifications.
Qualifications are a blunt measure of skills that do not capture the effects of experience and
other less formal training (e.g. on the job training), and while the population of the greater
Christchurch area hold similar levels of qualifications to the rest of New Zealand, and in fact
larger number of individuals with higher qualifications in some areas, it also seems that
there may be an under-utilisation of the human capital in some parts of the region,
especially Waimakariri and Selwyn where no or basic qualifications are particularly dominant
and higher than national averages. Relatively high numbers of people with no or lower
qualifications in those areas could potentially act as constraints on their local economies by
limiting their ability to attract and diversify businesses in higher-value added activities that
are likely to require higher skills levels.
Educational Attainment
Educational attainment levels in the region as a whole are similar to national levels, although
it does vary across the greater Christchurch region (figure 14). Attainment levels are highest
in Christchurch and Selwyn, and Waimakariri has the lowest levels.
Figure 14. Educational attainment of all school leavers, 2009 to 2011 (percentage of all students)
Source: Statistics New Zealand.
The Government has a target that by 2017 85 percent of 18 year olds will have achieved
NCEA level 2 or equivalent. Currently 75 percent of school leavers in greater Christchurch
have achieved NCEA level 2 or higher, compared with 69 percent for New Zealand as a
whole.
20Māori educational attainment (figure 15) is higher in all three areas than for Māori nationally
on all three attainment levels, except on University Entrance in Waimakariri which is slightly
below the national level for Māori.
Figure 15. Educational attainment of Māori school leavers, 2009 to 2011 (percentage of all Māori school
leavers)
Source: Statistics New Zealand.
Europeans/Pakeha (figure 16) are achieving at higher levels than Māori, and at similar levels
to nationally for European/Pakeha. Waimakariri is an exception with the level of University
Entrance attainment being noticably lower than nationally. The same is the case in Selwyn,
but to a lesser extent.
Figure 16. Educational achievement of European/Pakeha school leavers, 2009 to 2011 (percentage of all
European/Pakeha students)
Source: Statistics New Zealand.
21It is interesting to note, that in Waimakariri which has the lowest levels of educational
achievement, Māori are performing better than nationally on both NCEA level 1 and 2, and
only slightly below the national level on University Entrance for Māori. The picture is largely
reversed for European/Pakeha’s achievement levels, which are lower than their national
averages on both NCEA level 2 and below on University Entrance attainment compared to
their national average to a much higher degree than Māori in the district.
The lower levels of educational attainment in Waimakariri are likely to represent challenges
to this particular region, and possibly act as a constraint on Waimakariri’s abilty to attract
and retain businesses. Likewise, there is likely to be fewer start-ups of innovative businesses
due to a more limited number of entrepreneurs. People with lower skill levels also tend to
be less mobile, and so are less likely to move away in pursuit of better opportunities if job
opportunities decline, instead becoming unemployed.
Apprenticeships
In 2010, 1,337 people were enrolled in a Modern Apprenticeship, with 85 percent being
Pakeha, seven percent Māori and four percent Pasifika. These percentages are very close to
those ethnicities’ proportions of the greater Christchurch population, meaning that none are
underrepresented.
From 1 January 2014, the Modern Apprenticeships Scheme will be replaced by New Zealand
Apprenticeships, which will provide the same levels of support but have a higher educational
content and be available to all age groups (unlike Modern Apprenticeships which are
available only to those aged under 25).
An initiative seeking to better connect trainees, their communities with employers and
sustainable employment is He Toki ki te Rika (He Toki). He Toki is an iwi-led Māori workforce
development initiative seeking to grow Māori capability across the board in the construction
and infrastructure sectors in Canterbury through a collaborative partnership leveraging the
strengths, knowledge, capabilities and networks of Government, training providers, industry
and iwi to enhance Māori employment and economic development outcomes.
The He Toki partnership is led by Te Rūnanga o Ngāi Tahu in partnership with Te Tapuae o
Rēhua Limited, the Christchurch Polytechnic Institute of Technology, Hawkins Construction
South Island Limited and He Oranga Pounamu, in addition to Te Puni Kōkiri, the Tertiary
Education Commission and the Ministry of Social Development. Currently there are 300
places funded for delivery in 2012 and 2013. He Toki is one model that has led to further
expansion of Māori and Pasifika trades training.
Inwards Migration
Figure 17 shows net inwards migration as a percent of the local population for the three
areas of greater Christchurch. The effect of the earthquakes can be clearly seen, but also a
gradual reduction in inwards migration over the preceding years, for New Zealand as a
22whole as well as for greater Christchurch. The graph suggests that prior to the earthquakes
inflows of migrants followed a similar pattern in greater Christchurch as they do nationally.
Inflows into Christchurch recovered in 2012, likely influenced by the labour needs of the
recovery and rebuild.
Figure 17. Net international immigration 2002-2012 (as a percentage of the local population)
Source: Statistics New Zealand.
Essential Skills workers in the Canterbury region
In 2012, 3,984 migrants were approved a work visa under Essential Skills for a job in the
Canterbury region, an increase of 50 percent from a low (due to the earthquakes) of 2,655 in
2011.
In 2012, the top occupation5 group for Essential Skills workers in the Canterbury region was
technicians and trades Workers, followed by managers and community and personal service
workers.
Table 3: Top three occupation groups for Essential Skills workers in the Canterbury region, 2010 - 2012
Occupation group 2010 2011 2012
Technicians and Trades Workers 20% 22% 31%
Managers 19% 19% 16%
Community and Personal Service
24% 22% 15%
Workers
Total number of workers 2,855 2,655 3,984
Source: Ministry of Business, Innovation and Employment
5
Occupation is classified using the Australian and New Zealand Standard Classification of Occupations
(ANZSCO)
23Within the technicians and trades workers occupation group, 46 percent were construction
trades workers and 20 percent were food trades workers.
Within the managers occupation group, 64 percent were farmers and farm managers and 22
percent were hospitality, retail and service managers.
Within the community and personal service workers occupation group, 74 percent were
carers and aides.
Educational Providers
The tertiary education system is a vital aspect of a region’s knowledge infrastructure. The
greater Christchurch area has the main campus of two universities - the University of
Canterbury and Lincoln University. It also has one Polytechnic (Christchurch Polytechnic
Institute of Technology (CPIT)). In addition to these providers there are also campuses of the
University of Otago Christchurch Campus Medical School, the Southern Institute of
Technology and some delivery from Timaru-based Aoraki Polytechnic Campus.
The University of Canterbury has a particularly strong engineering school. At 30 September
2011 the University had 18,000 students. Lincoln University has an agricultural base, and had
3,447 students in 2010. CPIT is a comprehensive Polytechnic with a broad range of
foundation, vocation and degree qualifications including a strength in trades training.
International education is important to the local economy, bringing valuable revenue from
fees and expenditure from visits by students’ families. The international education sector
also creates valuable links to overseas networks and many students choose to stay in
Christchurch after completing their studies, diversifying the labour market.
At the time of the earthquakes about 6,000 international students were studying in
Christchurch, of which about 1,500 left as a result of the earthquakes, some moving to other
New Zealand cities and others leaving the country. International enrolments in 2011 were 31
percent lower than in 2010, with language school enrolments down by 35 percent.
Research has found that the average annual living costs for an international student were
$17,253, contributing a total economic impact for the sector of $269 million (including
multipliers, value-added and taxes). Strengthening the international student market,
including in English Language delivery, is an opportunity for the recovering education sector.
The Economic Recovery Programme for greater Christchurch recognises international
education as a severely damaged sector. Greater Christchurch will experience more than $1
billion of rebuilding in the education sector.
24Opportunities
Population patterns
Forecasts suggest that Selwyn and Waimakariri are projected to have population increases
much higher than national averages in the 1-14 and 15-39 and 65+age groups, while
Christchurch is forecast to grow slightly less than the national average. This suggests some
redistribution of the population within the region.
With an ageing population nationwide, all regions will want to attract young people.
Christchurch is seeing, and will continue to see for the next few years, an influx of skilled
migrants to help with the rebuild. Decision-makers may wish to consider how they can
retain these skilled migrants in greater Christchurch, particularly young migrants with or
without children. This would be a competitive undertaking, as the rest of the country may
wish to attract migrants away from Christchurch or greater Christchurch.
The predominance in greater Christchurch of those aged 15 to 29 is an important current
strength that the region needs to capitalise on by making it easy and attractive for those
young people to stay in the region once they have finished their studies.
Upskilling the workforce
Greater Christchurch compares well with New Zealand as a whole in terms of the
qualification levels of the working age population, although effort will be needed to lift
school leaver achievement to meet the Government’s target for 85% of 18 year olds to
achieve NCEA level 2 by 2017. Lifting the skills of the Māori population is particularly
important given their current lower educational attainment.
The Government is providing extra training places, immigration and skills-matching services
to help fill vacancies. The “He Toki” Māori Trades Training programme and the Pacific
Trades Training scholarships are well underway in Canterbury and are providing significant
opportunities for both Māori and Pacific to upskill, gain trade qualifications and move into
well paid jobs in the construction sector.
In all scenarios for the rebuild, demand is greatest for skilled workers. General labourers will
also be in high demand, and this may provide opportunities, after training, for some
beneficiaries or those who have not previously worked in the construction industry.
Unless higher rates of participation can be achieved within the local labour market, once the
Christchurch rebuild gains momentum employers will need to look to migrants from other
parts of New Zealand and overseas to provide much of the labour. This will put pressure on
Canterbury’s infrastructure, and businesses across the region may face competition for
labour.
25Coordinated effort
Taking advantage of the opportunities in the greater Christchurch region involves will
require the coordinated and wholehearted effort of all affected parties (i.e. central, regional
and local government, Iwi, employers and education and training providers). Much has been
done already, and it is important both to celebrate and build on achievements to date as
well as to continue to innovate in ways that will help greater Christchurch, but also New
Zealand as a whole.
Central government strategies and actions
The Economic Recovery Programme for greater Christchurch was developed in partnership
with local business and sector leaders.6 It provides the foundation for economic recovery
and growth to 2016, and aims “to revitalise greater Christchurch as the heart of a
prosperous region for business, work and education, and increase investment in new
activities”. It focuses on three areas – leadership, people and the business environment, and
identifies the need for concerted effort to ensure that the labour market plays its part in
supporting the rebuild and wider recovery. That involves the development of six sector
workforce plans that are industry-led (construction, manufacturing, agriculture, ICT, health
and professional services). The construction workforce plan is well advanced, and the others
are at various stages of development.
The Government’s Business Growth Agenda is a programme of work that will support New
Zealand Businesses to grow. It is focused on six elements needed for business growth:
natural resources, skilled and safe workplaces, infrastructure, capital, innovation and access
to export markets. Each of these has its own programme of work.
Specific BGA and recovery actions relevant to greater Christchurch are:
Māori Trades Training
Lifting school leaver achievement, particularly for Māori
Increasing Youth Guarantee places
Refocusing polytechnic sector on skills for regions
Development of New Zealand apprenticeships and apprenticeship reboot
The Canterbury Skills and Employment Hub
Leveraging the cultural and asset base of Māori economy for growth.
Regional/local strategies and actions
The Canterbury Employment and Skills Board has been working closely with MBIE, CERA and
other government agencies to address employment and skills issues for Canterbury in the
short and longer-term. It has had a strong focus on the effects of the earthquakes on the
labour market and skills.
6
Partnership for economic prosperity and recovery (PEPR).
26The two EDAs (Canterbury Development Corporation and Enterprise North Canterbury) and
Selwyn District Council have all refreshed their economic development strategies following
the earthquakes.
The Canterbury Development Corporation long-term economic development strategy has a
focus to 2031, with a vision for the economy of Christchurch to be the best place for
business, work, study and living in Australasia. The strategy identifies workforce
development as a key to Christchurch’s remaining competitiveness and a range of actions
are identified to deliver the strategy.
Selwyn District’s Economic Development Strategy to 2019 has six key action points, including
connecting enterprise, skills and education to ensure Selwyn is able to access the skilled
workers it needs to prosper, and ensuring a smooth skills pathways for young people.
Waimakariri Council and its EDA Enterprise North Canterbury has also refreshed their
economic development strategy with a focus on land, business and visitors.
27You can also read