ABUNDANCE ESTIMATION OF THE MEKONG IRRAWADDY DOLPHIN ORCAELLA BREVIROSTRIS BASED ON MARK AND RECAPTURE ANALYSIS OF PHOTO-IDENTIFIED INDIVIDUALS ...
←
→
Page content transcription
If your browser does not render page correctly, please read the page content below
ABUNDANCE ESTIMATION OF THE MEKONG
IRRAWADDY DOLPHIN ORCAELLA BREVIROSTRIS
BASED ON MARK AND RECAPTURE ANALYSIS OF
      PHOTO-IDENTIFIED INDIVIDUALS

             April – May 2007

                           © Fernando Trujillo / WWF Cambodia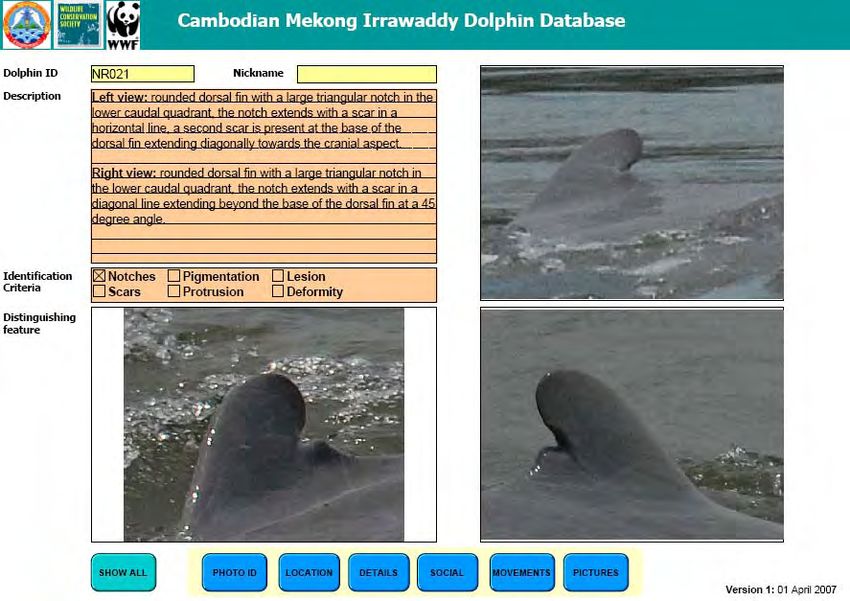
Authors and Contributors

Scientific consultant and author:   Dr. Fernando Trujillo
Principal author:                   Dr Verné Dove
Database:                           David Dove
Editor:                             Richard Zanre

Research team:
Dr Fernando Trujillo, Dr Verné Dove, David Dove, Kim Sokha, Lor Kim San, Vinn Bunna,
Tan Someth Bunvath and Loeu Theo.

This report should be cited as:
Dove, V., Dove, D., Trujillo, F. and Zanre, R. 2008. Abundance estimation of the Mekong
Irrawaddy dolphin Orcaella Brevirostris based on mark and recapture analysis of photo-
identified individuals. WWF Cambodia Technical Report.

                                                                                     2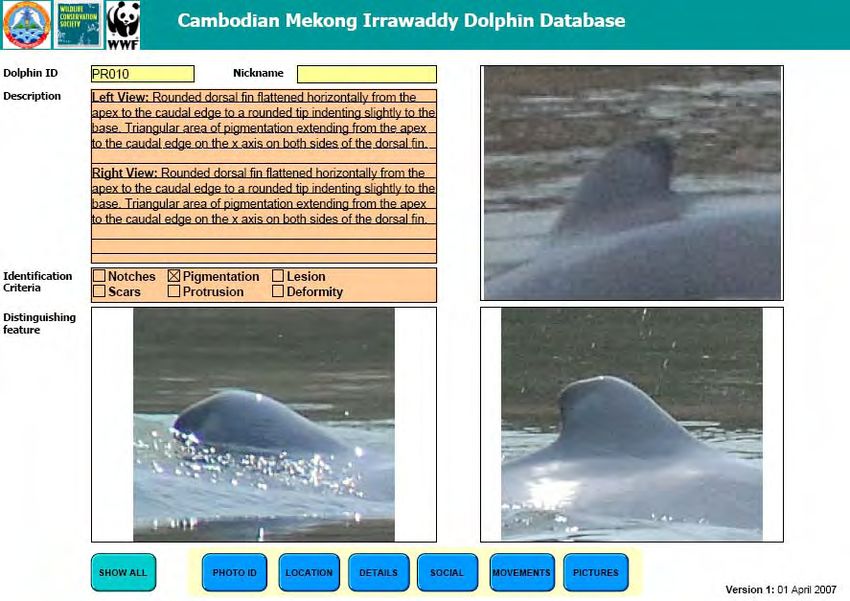
Table of Contents

ABSTRACT ...........................................................................................................................................5
INTRODUCTION.................................................................................................................................5
METHODOLOGY................................................................................................................................6
   ABUNDANCE FIELD SURVEY ................................................................................................................6
   PRELIMINARY PHOTOGRAPH AND DATA ANALYSIS - ID DATABASE ...................................................9
   STATISTICAL ANALYSIS .....................................................................................................................11
   DISTRIBUTION AND MORTALITY MONITORING..................................................................................13
RESULTS ............................................................................................................................................13
   DIRECT COUNTS.................................................................................................................................13
   DOLPHIN IDENTIFICATION .................................................................................................................15
   MOVEMENT BETWEEN POOLS ............................................................................................................18
   ABUNDANCE ESTIMATION USING CLOSED POPULATION MODEL .......................................................18
     April survey ...................................................................................................................................18
     May survey ....................................................................................................................................19
   APRIL AND MAY SURVEYS COMBINED ..............................................................................................19
DISCUSSION ......................................................................................................................................20
CONCLUSION....................................................................................................................................22
REFERENCES....................................................................................................................................23
ACKNOWLEDGEMENTS................................................................................................................23
APPENDICES .....................................................................................................................................24

                                                                                                                                                     3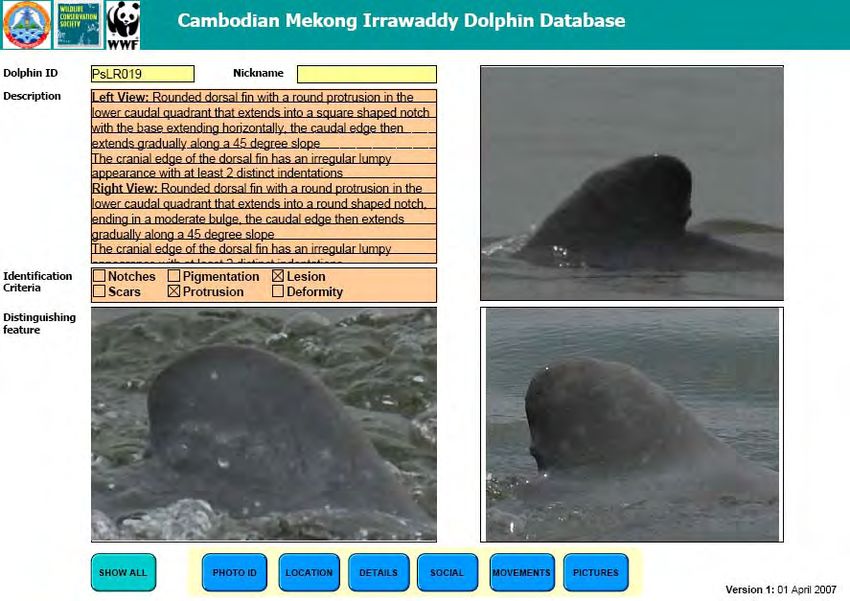
List of Tables
TABLE 1: SAMPLED DEEP POOL AREAS OF THE MEKONG RIVER.............................................................8
TABLE 2: MAIN CRITERIA USED TO IDENTIFY DORSAL FINS ....................................................................9
TABLE 3: RESULTS FROM DIRECT COUNTS DURING APRIL CAPTURE AND RECAPTURE SURVEYS.........14
TABLE 4: RESULTS FROM DIRECT COUNTS DURING MAY CAPTURE AND RECAPTURE SURVEYS ..........14
TABLE 5: COMPARISON OF APRIL DIRECT COUNTS AND PHOTO-IDENTIFIED DOLPHINS .......................16
TABLE 6: COMPARISON OF MAY DIRECT COUNTS AND PHOTO-IDENTIFIED DOLPHINS .........................16
TABLE 7: DOLPHINS IDENTIFIED USING PHOTO-ID, ON CAPTURE AND RECAPTURE EFFORTS ...............17
TABLE 8: ESTIMATES OF DOLPHIN ABUNDANCE IN THE MEKONG BASED ON DIRECT COUNTS SINCE
    2002...............................................................................................................................................20

List of Figures
FIGURE 1: EXAMPLES OF CRITERIA AND UNIQUE CODE ALLOCATION...................................................10
FIGURE 2: NUMBER OF DOLPHINS IDENTIFIED IN EACH POOL DURING THE APRIL CAPTURE AND
    RECAPTURE SURVEY EFFORTS .......................................................................................................15
FIGURE 3: NUMBER OF DOLPHINS IDENTIFIED IN EACH POOL DURING THE MAY CAPTURE AND
    RECAPTURE SURVEY EFFORTS .......................................................................................................15

List of Appendices
APPENDIX 1: EVENT AND ENVIRONMENTAL CONDITIONS DATA SHEET ................................................24
APPENDIX 2: EVENT AND ENVIRONMENTAL CONDITIONS CODING .......................................................25
APPENDIX 3: PHOTO-ID SIGHTING RECORD SHEET ...............................................................................26
APPENDIX 4: PHOTO-ID EFFICACY AND ID CRITERIA DATA SHEET ......................................................27
APPENDIX 5: PHOTO-ID DATABASE ......................................................................................................28

                                                                                                                                                       4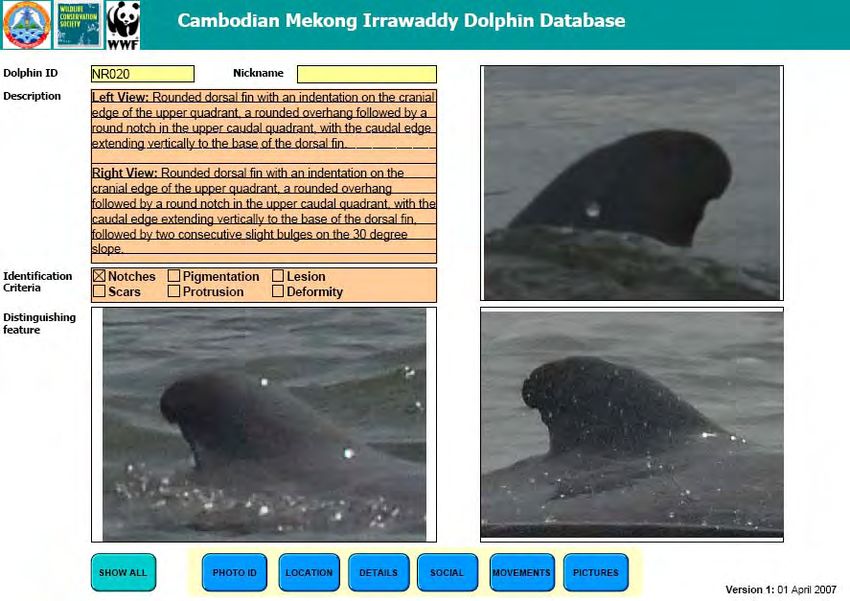
ABSTRACT
Cambodia’s only freshwater dolphin is the facultative Irrawaddy river dolphin Orcaella
brevirostris found in the Mekong River. To clarify the abundance status of this critically
endangered subpopulation, mark and recapture photo-identification surveys were conducted
in the low water months of April and May 2007, from the 17th to the 25th of April and the
21st to the 29th of May. These surveys were conducted by boat on the Mekong River, along
the 190km stretch of river extending from Kratie to the Southern boarder of Laos. A total
search effort of 139 hours and 32 minutes was conducted. Dolphins were observed and
photographed for a total of 41 hrs and 01 minutes. A total of 61 dolphins were identified. The
MARK statistical programme, using a closed population model, produced a total abundance
estimate of 71 (95% CI = 66-86) dolphins as at end May 2007.

___________________________________________________________________________

INTRODUCTION
River dolphins occurring in Asia and South America are amongst the world’s most
threatened mammal species (Kreb & Budiono 2005), largely due to increasing human
intervention into freshwater ecosystems. The freshwater dolphins inhabit some of the largest
river systems in both Asia and Latin America. In Asia the freshwater Irrawaddy dolphins
(Orcaella brevirostris) are found in three river systems: the Mekong of Cambodia and
Southern Laos, the Mahakam of Indonesia and the Ayeyarwady of Myanmar. In 2004, the
Mekong Irrawaddy dolphins obtained the same conservation status as the Irrawaddy dolphins
of the Mahakam River, and were listed as Critically Endangered by the IUCN Red List. This
was based on direct counts of the dolphin population with an estimate population size of 80-
100 individuals (MAFF, 2005).

The distribution of river dolphins in Asia overlaps areas of intensive use by human activities,
all of which have the potential to threaten the survival of these endangered species. With
rapid human population growth these anthropogenic threats are contributing towards the
overall population declines of river dolphins in South East Asia. Some of the identified
threats to river dolphins and their freshwater habitat include: direct and indirect fishery
interaction (accidental mortality in gill net entanglements, electric, dynamite and cyanide
fishing), overfishing, disease (introduction and new emerging diseases), pollution (herbicide
and pesticide runoff from agriculture, trace metals and chemicals from industrial effluent, and
human waste), anthropogenic sound, habitat transformation (dams, barrages and dredging),
and uncontrolled ecotourism.

Within the past five years reported Irrawaddy dolphin mortalities within the Mekong River
have remained high with a total of 78 mortalities, 2006 saw the highest number (19) on
record, with 13 mortalities recorded in 2007. Of these 78 mortalities, 68% were calves and
32% adults. There has been a significant increase in the number of neonatal calf mortalities,

                                                                                             5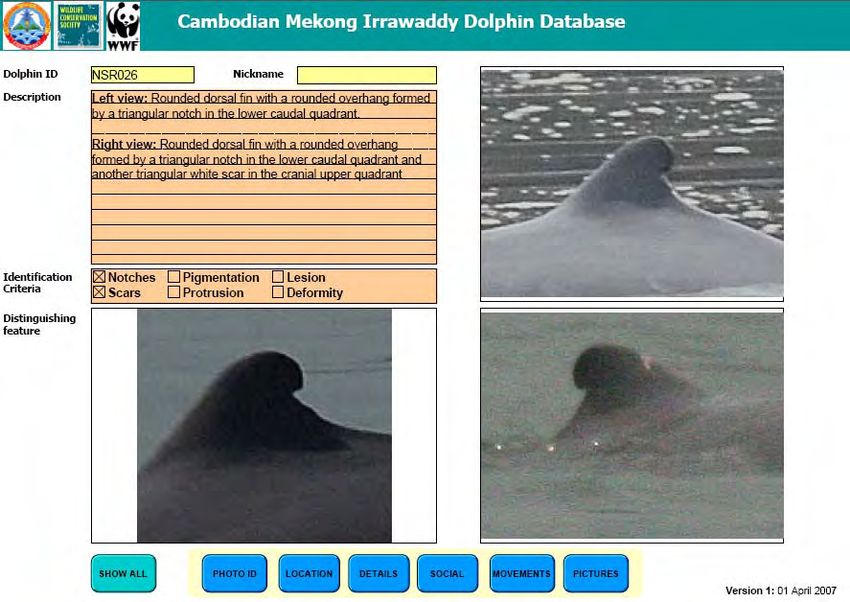
often with calves less than two weeks of age. In 2003 the calf mortalities were 6 (37.5 % of
total mortalities, n=16), compared to 16 (84.2%, n=19) in 2006, and 11 (84%, n=13) in 2007.
In order to fully understand the ecology and population biology of this species, a good
estimate of the population size and trends within the Mekong River is required. In addition,
understanding the status of the Mekong Irrawaddy dolphin population with certainty is a
necessary step to determining the problems that they face and developing remedial
intervention strategies.

The Cambodian Mekong Conservation Project (CMDCP) has been implementing research
programmes to assist the conservation of the Mekong dolphin, as a collaborative effort
between FiA, WWF and WCS, since 2005. Until 2007 CMDCP had been using the relatively
simplistic direct count method to estimate dolphin population. A more scientifically robust
and accurate method to estimate population was deemed necessary to meet research and
conservation objectives. To this end one of the world's leading researchers in river dolphin
population monitoring, Dr Fernando Trujillo, was recruited as a consultant to provide training
in best and most appropriate methodology for local conditions, lead the first survey, and
supervise statistical analysis of all research data.

The mark-recapture methodology is a widely used technique in wildlife population studies
for a range of species. Since freshwater dolphin populations often live in a closed system
with no exchange from coastal populations Kreb (2005) suggested that it is feasible to use
photo-identification (photo-ID) and mark-recapture analysis to determine total population
size. Photo-ID technique involves collecting and cataloguing photographs of the dorsal fins,
flukes and bodies of cetaceans with distinctive marks that allow for identification of
individuals (Kreb 2005). Mark-recapture using photo-ID has been shown to be practical for
studying population abundance of Irrawaddy river dolphins in the Mahakam River in
Indonesia (Kreb 2005) and in the Mekong (Trujillo 2007). It was the chosen method for the
2007 Mekong dolphin population surveys.

METHODOLOGY

Abundance field survey
Between the 17th and 25th of April and 21st and 29th of May two continuous visual surveys for
dolphins were conducted in the Mekong within the 190 km stretch of river between Kratie
and the Laos border, using a local motorized vessel. The trip North up the river to Laos was
termed the capture, and the trip South down the river to Kratie was termed the recapture.
Five days were dedicated to the capture and four days for the recapture. The team was

                                                                                            6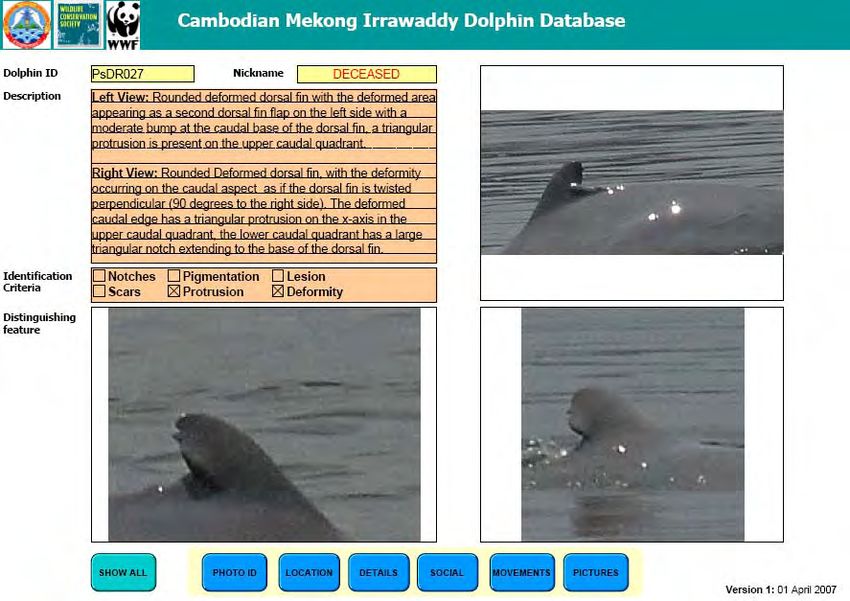
composed of six researchers from CMDCP, with the addition of consultant researcher Dr
Fernando Trujillo during the April survey. GPS track lines were recorded of the journeys, and
kilometers traveled recorded on two GPS devices.

Equipment necessary for a photo-ID mark-recapture study include: a sturdy motorized vessel
with vantage point at front and rear and capacity for six researchers; GPS; powerful
binoculars (Bushmaster 10-30 x 50mm) and powerful digital camera (Canon EOS350) with
zoom lens of up to 500mm, with and without the aid of a polarized lens depending on
lighting conditions. The surveys were carried out during April and May when the Mekong
river levels were at their lowest and the Irrawaddy dolphins were concentrated in and around
up to nine deep pools, making them easier to sight, as well as reducing error bias from double
counting due to dolphin movement between pools during a survey.

The researchers were situated in six positions on the vessel, two observers on the bow of the
boat, two observers at the rear, one starboard and one port, both situated centrally on the
vessel. This allowed for a 360º field of view maximizing sighting possibilities. The
researchers were constantly watching for dolphins in both the nine deep dolphin habitats
(pools) (see Table 1) sampled as well as the stretches of river between them. The boat's
course followed the Mekong River through the nine deep dolphin pools, often zigzagging
(using a 35-45 degree angle) from one side of the river to the other, to cover wide regions of
the river and pools, this aided dolphin detection in these wider areas. In pools where dolphins
were not detected local fisherman were asked if they had seen any dolphins in the area, in
order to confirm our observations of no dolphins. In order to standardize data collected a
photographic effort of between two and four hours was spent in each pool, with a minimum
of 30 minutes and a maximum of 90 minutes allocated to each set of dolphins encountered.
This time varied according to the number of dolphins present in each set group, with less
time required for small groups, and longer required for larger groups.

Searching for dolphins whilst on the water was carried out on a continuous basis by all six
researchers and two additional crew members by naked eye, or with the aid of binoculars.
Once dolphins were detected the boat slowly approached the group in a circular manner,
avoiding a head-on approach, in order to maintain group cohesion and avoid the possibility of
separating mothers and calves. When the boat was in close proximity to the dolphins the
engine was turned off and the boat allowed too drift with the current towards the animals.
Turning off the engine maximized photo opportunities of the dolphins, as when the engine
was on, the dolphins were more elusive, and this behaviour made them difficult to

                                                                                             7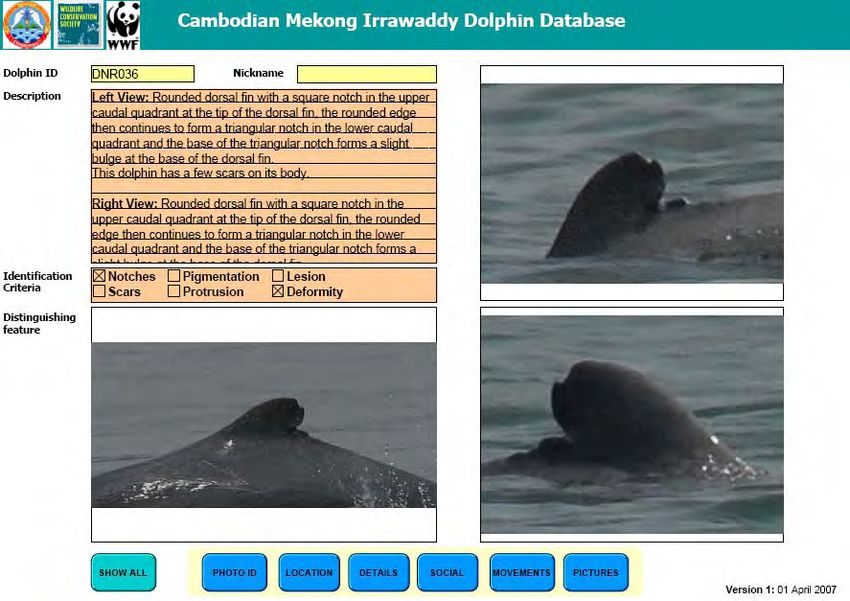
photograph. The dolphins when encountered, frequently circle the boat in large concentric
circles, facilitating photography of the dorsal fins from both the left and the right side. This
behaviour also helped in predicting where the dolphins would surface, in order to maximize
photographic effort. In circumstances where the dolphins moved away from the boat, the
engine was turned on and the dolphins re-approached and the sequence above repeated.

Table 1: Sampled deep pool areas of the Mekong River

                    Sampled area                      Pool number       Area (ha)
         Kampi and Chhroy Banteay                          1                768
         Koh Ro Ngeave- Sambo                              2                969
         Koh P’Dao                                         3                773
         Ksach Makak                                       4                526
         Koh Dam Bong                                      5                301
         Tbong Klar                                        6                628
         Koh Kon Sat                                       7                889
         Koh San Tuk                                      8                 728
         Cheteal                                          9                 50

Global position was recorded every 30 minutes using a GPS. In addition, our position was
recorded with each dolphin sighting. Environmental conditions (glare, water condition,
visibility), dolphin estimates (best) and behaviour activity was also recorded each time a GPS
position was recorded (data sheets in Appendix 1 & 2). Sighting conditions were considered
to be poor when rain and/or wind significantly affected our ability to see dolphins. For all
photo-ID dolphin-sighting efforts, a best, high and low estimate of group size was made
based on the consensus of the observers, as well as information recorded on group
composition: numbers of adults, juveniles and calves (data sheet in Appendix 3). The camera
number was recorded at the beginning of each set group, and recorded at the end of the
session when the photographer was satisfied that all dolphins in that set had been
photographed (data sheet in Appendix 3). To mark the start of each set, a photograph of an
information sign containing the date, stratum (pool number, river section), set number and
note of capture or recapture effort was taken. When dolphins were sighted the observer would
call out the position based on an hour/clock system with the bow of the vessel being 12
o’clock and the rear of the vessel being 6 o’clock.

                                                                                              8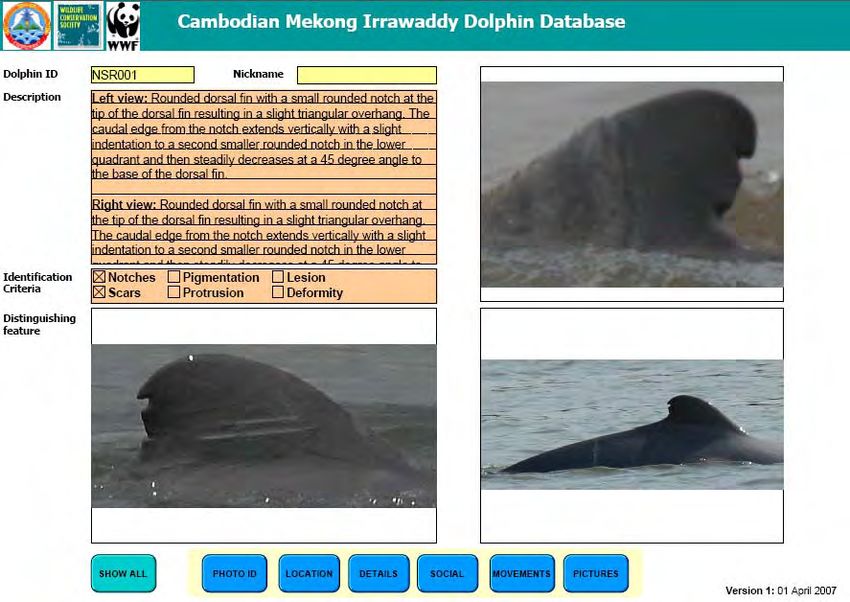
Calves were identified according to their small size (approximately 1m in length) and their
close proximity to an adult. Juveniles were identified based on being up to two-thirds the
length of an adult, and able to be seen independent of the mother. A similar photographic
effort was made for calves and juveniles as was for adults. However calves often surface very
suddenly or were protected by their mothers from the boat, thus preventing suitable
photographs of their dorsal fins to be taken.
Preliminary photograph and data analysis - ID database
The photographs were initially downloaded and sorted by date (capture and recapture), pool
number and set groups. The photographs were then inspected on a computer, in order to
select suitable pictures for dolphin identification, based on quality, angle and focus. The out
of focus photographs were deleted, and photographs of behaviours and displays without
dorsal fins, were placed in a separate folder. The best quality photographs were then used in
the analysis using Adobe Photoshop V.8.5 software. A team of four researchers worked
together in order to correctly identify individuals, and add the data to the Filemaker Pro V8
Dolphin ID database (Appendix 5).
New dolphins were assigned a unique code as devised by Trujillo (2007) (see Figure 1
below). The code was assigned based on the main criteria of identification (see Table 2). This
could either be a single criteria or a combination of criteria, followed by the shape of the
dorsal fin (triangular or rounded) and then by a unique number.
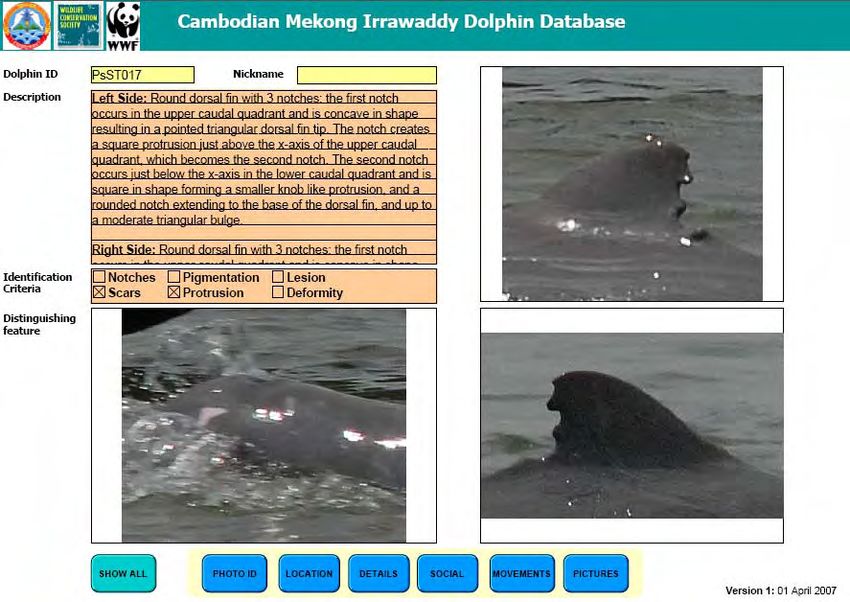
Table 2: Main criteria used to identify dorsal fins
Main criteria Abbreviation
Notches N
Scars S
Protrusion Ps
Lesion L
Deformity D
Pigmentation P
9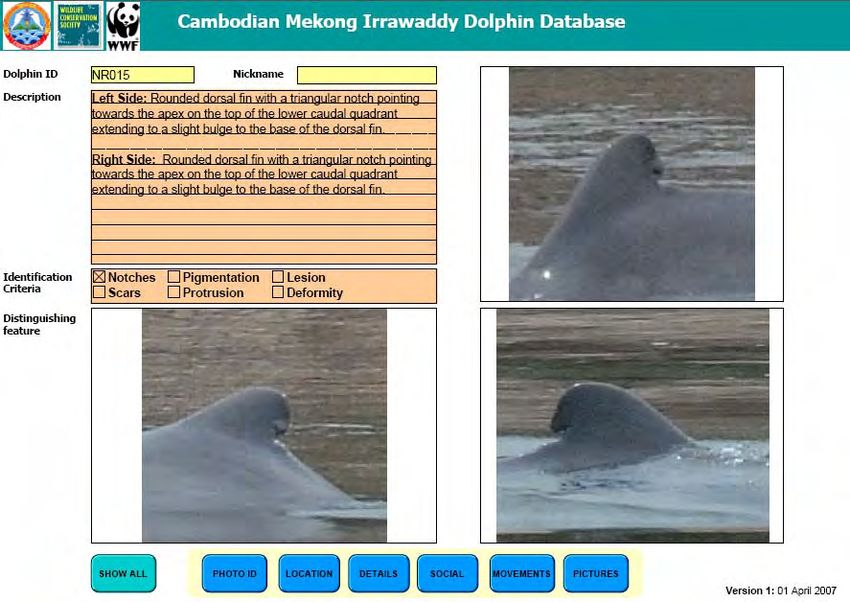
Notch

             Deformity                                                    Triangular

             Pigmentation

                                                 Ps             R              001
             Protrusion
                                             Main Criteria   Shape Of         Numeric
                                             .               dorsal fin       sequence

             Lesion

                                                                          Rounded
             Scar

Figure 1: Examples of criteria and unique code allocation (adapted from Trujillo 2007)

Using this coding system in Figure 1, each dolphin is given a unique number, which never
changes; only the criteria part of the code can change over time.

The design and implementation of the database for identified Irrawaddy dolphins was made
by David Dove at WWF’s office in Kratie. The database allows the use of five different
pages for each identified dolphin:
    •   The first page corresponds to the ID code of the dolphin and includes a short
        description and the main photographs to identify the individual (left side, right side
        and additional one of good quality).
    •   The second page provides sighting location history for the dolphin, including
        summary information of sighting area (deep pool areas, segments of the river), GPS
        location and date.
    •   The third page describes specific details of the dolphin, including gender, age
        category and number of good quality pictures available for that dolphin.
    •   The fourth page is for the inclusion of summary maps showing the location and
        movements of dolphins both during the dry and wet season. Each year the maps
        would be updated.
    •   The last page is for eight additional good quality pictures.

                                                                                           10
Previously identified dolphins that were already on the database from the first survey, had
their files updated with the date and location that they were re-encountered after the second
survey. In addition, if there were new photographs that were of better quality than previous
photographs used in the database, the new ones replaced the old ones. Similarly if there were
additional good quality photographs useful in identifying an individual the photographs were
placed on the additional photograph page within the individuals file and the number of
photographs recorded for each individual. New individuals identified in the second May
survey were given a code, and a new file was created on the database for that individual, and
the best photographs of the dorsal fins were placed on the file. The updated location (GPS co-
ordinates) of individuals sighted was recorded together with the date sighted. Maps for each
individual dolphin with their location in the dry season from the two surveys were produced
and imported into the database. Lesions on specific dolphins were noted and photos added of
all lesions.
The number of photographs taken out in the field was recorded, as well as the number of
useful photographs, together with how many dolphins were identified according to each ID
criteria within each set taken (data sheet in Appendix 4). The number of identified dolphins
was then compared to the best estimate for each set, to monitor the level of efficacy of the
photo-ID technique. If new scars, lesions, notches or protrusions were seen, these were added
to the ID description, and the dolphin code altered accordingly.
Statistical analysis
Based on the assumption that the population is closed the Petersen-Lincoln Model was used
to evaluate the abundance of the Irrawaddy dolphin along the 190 km of the surveyed river
for each of the April and May surveys.
N = n1 (n2+1) / [(m2+1) (1-p)]
Where N = abundance estimation
n1 = number of dolphins identified during the capture
n2 = number of dolphins identified during the recapture
m2 = number of dolphins n1 found in n2
p = proportion of unidentifiable dolphins (calves, juveniles and adults without marks)
11To estimate the Standard Error (SE)
SE = [(n1+1) (n2+1) (n1-m2) (n2-m2)]/ [(m2+1) 2(m2+2)]
The 95% confidence interval is obtained using the following formula: N ± (t)(SE)
Where t = 1.96
The Petersen-Lincoln Model is based on the following key assumptions:
1. The population is closed
2. All animals have the same probability of being caught
3. Marking does not affect the catch-ability of an animal
4. The second sample is a simple random sample
5. Animals do not lose their marks between capture and recapture
6. All marks are reported on recovery
Maximum biases that may affect population size estimates for the Peterson-Lincoln method
need to be calculated. A maximum bias that assumes no losses is calculated by adding the
number of dead dolphins (1) in-between the two sampling periods, to the number of
recaptured animals during the second sampling period.
m2bias = m2 + 1
This number is also added to the total number caught on the recapture.
n2bias = n2 + 1
When addressing this bias it is assumed that these dolphins would have been marked during
the first session, and also assumes that they would have been recaptured if they had not died.
In order to calculate a final abundance estimate for the combined April and May surveys a
computer statistics programme called the MARK Program1 using a closed population model
was used to analyse the grouped data. A closed population model was used as it was assumed
that immigration and emigration in the population between the months of April and May did
not occur, or was not significant.
1
MARK is the most sophisticated and powerful software application available for the
analysis of marked individuals. For complete explanation of MARK Program see Cooch, E.
& White, G. (Eds) 2007. Program MARK “a gentle introduction”, 6th Ed.
12Distribution and mortality monitoring
Once the dolphin ID database is established it can be used to monitor distribution and
movement patterns to provide understanding of Mekong Irrawaddy dolphin ecology, which
assists conservation planning; as well as providing a tool for monitoring mortalities.
As explained above, the database records sighting location information for each individual
dolphin each time the dolphin is captured. These GPS points are then used in a GIS
programme to map the locations that individually identified dolphins were sighted / captured
on each survey. If a number of surveys are carried out through the year then movement
patterns can be mapped for dolphins, which will improve our understanding of dolphin
behaviour and ecology, particularly with seasonal changes in river levels. Understanding
dolphin distribution and movement will assist conservation planning, for example location
and size of possible dolphin conservation zones.
By identifying the Mekong dolphin population in a database it will also be possible to
identify any recovered mortalities, this is important for understanding changes in population
dynamics. In addition, if a dolphin has been identified and then not encountered on future
surveys, this could point us towards determining whether an unrecorded mortality has
potentially occurred.
RESULTS
The April and May mark and recapture photo-ID surveys encompassed a total search effort of
139 hours and 32 minutes. Dolphins were observed and photographed for a total of 41 hrs
and 01 minutes. A total of 4,383 photos were taken over the two surveys (2,036 on the April
survey and 2,347 on the May survey). Of the 4,383 photos taken 2782 photos (63.5%) were
selected for photo-ID based on good image quality. The number of photographs taken varied
according to the number of dolphins in each pool; in addition, the elusive nature of dolphins
in certain pools also dictated the number of photographs taken. All dolphin search effort and
photo-ID collection was conducted during good sighting conditions, with breaks taken during
poor visibility and rain conditions.
Direct counts
For the April survey direct counts produced a total estimate of 58 (best), 63 (high), 45 (low)
dolphins for the capture and a total estimate of 54 (best), 59 (high), 40 (low) dolphins for the
recapture. For the May survey direct counts produced a total estimate of 55 (best), 68 (high),
48 (low) dolphins for the capture and a total estimate of 56 (best), 61 (high), 49 (low)
dolphins for the recapture.
13Table 3: Results from direct counts during April capture and recapture surveys
CAPTURE RECAPTURE
Pool No Low Best High Low Best High
1 16 18 21 17 22 24
2 0 0 0 0 0 0
3 8 12 13 8 13 14
4 0 0 0 7 9 10
D (River)* 7 9 9 0 0 0
5 0 0 0 0 0 0
6 0 0 0 1 1 2
7 8 13 12 0 0 0
8 0 0 0 0 0 0
9 6 6 8 7 9 9
Total 45 58 63 40 54 59
* Between Ksach Makak and Koh Dambong pools
On the April survey no dolphins were recorded at four pools on the capture and recapture
effort. Pools 2, 5 and 8 had no dolphins on either the capture or recapture efforts. Whereas
dolphins were sighted in pool 7 and river section D on the capture but not on the recapture;
and in pool 4 on the recapture but not the capture.
Table 4: Results from direct counts during May capture and recapture surveys
CAPTURE RECAPTURE
Pool No Low Best High Low Best High
1 14 16 20 23 27 29
2 4 4 5 7 7 8
3 3 3 4 3 3 3
4 5 6 10 0 0 0
5 3 4 4 0 0 0
6 4 5 6 10 12 13
River (G)* 2 2 2 0 0 0
7 4 5 6 0 0 0
8 0 0 0 0 0 0
9 9 10 11 6 7 8
Total 48 55 68 49 56 61
* Between Tbong Klah and Koh Kon Sat pools
On the May capture survey dolphins were sighted in all pools except for pool 8. Two
dolphins were seen between Tbong Klah and Koh Kon Sat, however the lighting conditions
were unfavourable for photography as the sun had already set. On the recapture survey
dolphins were only seen in five of the nine deep pools.
14Dolphin identification
A total of 61 dolphins were identified over the course of the April and May surveys. During the April
survey 51 dolphins were identified, 38 during the capture and 43 in the recapture effort. During the
May survey 54 dolphins were identified, 39 on the capture and 47 on the recapture effort.
Number of identified dolphins in each deep area (pools) in April
25
20
Number of identified dolphins
Capture April 07
15 Recapture April 07
10
5
0
1 2 3 4 5 6 7 8 9
Pool Number
Figure 2: Number of dolphins identified in each pool during the April capture and
recapture survey efforts
Number of identified dolphins in each deep area (pools)
25
20
Number of Identified dolphins
Capture May 07
Recapture May 07
15
10
5
0
1 2 3 4 5 6 7 8 9
Pool Number
Figure 3: Number of dolphins identified in each pool during the May capture and
recapture survey efforts
15Tables 5 & 6 below compares the number of photo-identified dolphins to the best direct
count estimate for each pool. As can be seen from the tables, particularly Table 6, the photo-
ID technique appears to be remarkably effective, with many of the dolphins that were
counted being identified by photo-ID. In the April survey 66% (38/58) of the direct counted
dolphins were identified on the capture and 80% (43/54) on the recapture. In the May survey
96% (53/55) of the direct counted dolphins were identified on the capture and 100% (56/56)
on the recapture.
Table 5: Comparison of April direct counts and photo-identified dolphins
POOL No CAPTURE RECAPTURE
Direct count ID’d dolphins Direct count ID’d dolphins
1 18 18 22 21
2 0 0 0 0
3 12 7 13 11
4 0 0 9 5
D (River)* 9 5 0 0
5 0 0 0 0
6 0 0 1 0
7 13 3 0 1
8 0 0 0 0
9 6 5 9 5
Total 58 38 54 43
* Between Ksach Makak and Koh Dambong pools
Table 6: Comparison of May direct counts and photo-identified dolphins
POOL No CAPTURE RECAPTURE
Direct count ID’d dolphins Direct count ID’d dolphins
1 16 16 27 27
2 4 4 7 7
3 3 3 3 3
4 6 6 0 0
5 4 4 0 0
6 5 5 12 12
G (River)* 2 0 0 0
7 5 5 0 0
8 0 0 0 0
9 10 10 7 7
Total 55 53 56 56
* Between Tbong Klah and Koh Kon Sat pools
16Dolphins were allocated either a 1 (identified) or 0 (not identified) on the capture and
recapture (Table 7). This information is then used in an open population model to estimate
population abundance over the research period.
Table 7: Dolphins identified using photo-ID, on capture and recapture efforts
Dolphin Dolphin Capture Recapture Capture Recapture
Number Unique ID April April May May
1 NSR001 1 1 1 0
2 NPR002 1 1 1 1
3 R003 1 1 0 1
4 PsT004 1 0 1 1
5 NR005 1 1 1 0
6 NT006 1 1 1 1
7 NLR007 1 1 0 1
8 NST008 1 1 1 1
9 NR009 0 1 0 1
10 PR010 1 1 0 0
11 PsR011 1 1 1 1
12 NSR012 1 0 0 0
13 NT013 1 1 1 1
14 NR014 1 0 1 1
15 NR015 1 1 0 0
16 DR016 0 1 0 1
17 PsST017 1 1 1 1
18 NSR018 1 1 1 1
19 PsLR019 1 1 0 1
20 NR020 1 1 1 1
21 NR021 1 1 1 1
22* PsT022 1 1 1 1
23 LR023 1 1 1 1
24 NR024 1 0 0 1
25 PsST025 1 1 1 1
26 NSR026 1 1 1 1
27* PsDR027 1 1 0 0
28 DNR028 1 0 1 0
29 NR029 1 0 1 1
30 PsT030 1 1 0 1
31 NR031 1 1 1 1
32 NR032 1 0 1 1
33 NR033 1 0 0 0
34 DNR034 1 1 1 1
35 NR035 1 1 1 1
36 DNR036 1 1 1 1
37 ND037 1 0 1 1
38 NR038 1 1 1 1
39 NT039 1 1 0 1
40 NLR040 0 0 1 1
41 DNS041 0 1 1 0
42 DNT042 0 1 1 1
43 NR043 0 1 0 0
44 T044 0 1 0 0
45 DLT045 0 1 0 1
46 NST046 0 1 1 1
47 NT047 0 1 1 1
1748 NST048 0 1 1 1
49 NR049 0 1 0 1
50 NT050 0 1 1 0
51 NR051 1 1 1 0
52 ST052 0 1 1 1
53 NR053 0 1 1 1
54 R054 0 0 1 1
55 NSR055 0 0 0 1
56 NR056 0 0 1 1
57 PsR057 0 0 0 1
58 R058 0 0 0 1
59 NT059 0 0 1 0
60 NT060 0 0 0 1
61 NT061 0 0 0 1
TOTAL 61 38 43 39 47
* Dolphins that have since died: dolphin no 27 died shortly after the April survey, dolphin no 22 died shortly
after the May survey.
Movement between pools
Based on photo-ID of individuals, it was noted that there was extensive movement between
the deep pools south of Stung Treng town, the main movements occurred between Kampi
(pool 1) and Koh P´Dao (pool 3), and Kampi and Ksach Makak (pool 4). For example,
during the May survey a total of 21 identified dolphins moved between pools, four identified
dolphins moved during the capture effort, seven dolphins moved during the recapture effort,
and 18 moved between the capture and the recapture effort. As dolphins were sighted in
pools 4, 5 and 7 on the capture and not on the recapture, it is likely that these dolphins moved
to other pools.
Abundance estimation using closed population model
An abundance estimation based on the Petersen-Lincoln closed population model can be
done for each of the surveys conducted in April and May. The results below show
consistency in the results of the two surveys.
April survey
The number of identified dolphins during the capture was 38 (n1) and 43 (n2) during the
recapture. The number of dolphins from the capture (n1) found in the recapture (n2) was 29
(m2). The proportion of unidentifiable dolphins (calves, juveniles and adults without marks)
was 20% (p = 0.2)
N = n1 (n2+1) / [(m2+1) (1-p)]
N = 38 (43+1) / [(29+1)(1-0,2)]
N = 70
SE = [(n1+1) (n2+1) (n1-m2) (n2-m2)]/ [(m2+1) 2 (m2+2)]
SE = [(38+1)(43+1)(38-29)(43-29)] / [(29+1)2 (29+2)]
SE = 2.78
1895% confidence interval N ± (t)(SE)
Where t = 1.96
N ± 1.96 (SE)
N = 70 ± (1.96)(2.78)
N = 70 ± 6
N = 70 (64 - 76)
Therefore the April survey produced an estimated population abundance of 70 dolphins, with
a range of 64 to 76 dolphins at the 95% confidence interval (CI).
May survey
The number of identified dolphins during the capture was 39 (n1), and 47 (n2) during the
recapture. The number of dolphins from the capture (n1) found in the recapture (n2) was 32
(m2). The proportion of unidentifiable dolphins (calves, juveniles and adults without marks)
was 22% (p = 0.2)
N = n1 (n2+1) / [(m2+1) (1-p)]
N = 39 (47+1)/[(32+1)(1-0.2)]
N = 71
SE = [(n1+1) (n2+1) (n1-m2) (n2-m2)]/ [(m2+1) 2(m2+2)]
SE = [(39+1)(47+1)(39-32)(47-32)]/[(32+1)2 (32+2)]
SE = 2.33
95% confidence interval N ± (t)(SE)
Where t = 1.96
N ± 1.96 (SE)
N = 71 ± 1.96 (2.33)
N = 71 ± 5
N = 71 (66 - 76)
Therefore the May survey produced an estimated population abundance of 71 dolphins, with
a range of 66 to 76 dolphins at the 95% CI
April and May surveys combined
The MARK computer programme, utilising a closed population model, was used to calculate
the total estimated Mekong dolphin abundance based on the grouped data from all surveys
conducted during April and May.
This analysis produced a total abundance estimate, as at the end of May 2007, of 71 dolphins
with a range of between 66 to 86 dolphins at the 95% CI. This result from the MARK
Program was extremely similar to the Petersen-Lincoln model results for each month’s
survey, though with a higher range. This is because the MARK Program utilises the profile
likelihood approach to calculate 95% CI, this approach makes more explicit use of the shape
of the likelihood curve and is the preferred approach to deriving 95% CI.
19DISCUSSION
Estimates of population abundance using mark-recapture analyses based on photo-ID
produced extremely similar numbers between the Petersen-Lincoln closed population
calculations for each of the April (n=70) and May (n=71) surveys, and the more robust
MARK programme closed population model calculation (n=71) for the entire April to May
research period.
Table 8 compares direct count dolphin abundance estimates for the Mekong since 2002.
When compared to direct counts by Beasley et al (2007) conducted between 2002 and 2005
the estimates obtained in 2007 were within the previous ranges, with the average from 2002
till 2005 producing a best (low-high) estimate of 57 (47-72).
Table 8: Estimates of dolphin abundance in the Mekong based on direct counts since
2002
Survey Date Best (low-high) estimates Reference
April-May 2002 47 (36-63) Beasley et al 2007
April-May 2003 66 (54-83) Beasley et al 2007
April-May 2004 66 (56-83) Beasley et al 2007
April 2005 48 (41-60) Beasley et al 2007
April 2007 56 (43-61) Trujillo 2007
May 2007 56 (49-65) This report
The mark and recapture abundance estimate produces a more accurate assessment of the
population as the direct count method has a tendency to potentially underestimate true
population as it relies on the ability of the observers to sight all dolphins present in the survey
area. Given the large size of dolphin habitat, the elusiveness of the Irrawaddy dolphin and the
prolonged dive intervals, this can be extremely difficult.
Taking the total abundance estimate of 71 dolphins (based on 61 identified dolphins), range
66 to 86 dolphins at the 95% CI, for this project's 2007 surveys, it is notable that this number
differs substantially to previous mark-recapture research on the Mekong Irrawaddy. Beasley
et al (2007) reported a population abundance estimate of 127 dolphins as at April 2005, range
108 to 146 dolphins at the 95% CI, based on 90 identified dolphins. As the survey
methodology and type of statistical analysis used by Beasley et al is not yet available the
authors are unable to comment on this difference in results, though it can be assumed that
mortalities since 2005 will partly account for the difference.
20The total number of dolphins identified on the database from the two photo-identification
surveys conducted in April and May 2007 is 61 individuals. However two known adult
dolphins have since died one in May (dolphin 22) and one in June (dolphin 27), thus a total
of 59 dolphins are currently identified on the database.
An interesting finding from the dry season surveys is that there appears to be a considerable
amount of movement between pools 1-7 despite the low river levels. It had previously been
assumed that during the lowest river level months of April and May that dolphins are largely
restricted to the deep pools they are resident in. Photo-ID enables us to track individual
movement between capture and recapture surveys. In the May survey several dolphins were
found to move between pools 1 and 7. On the capture dolphins were observed in all pools,
except pool 8, however on the recapture, dolphins had moved out of pools 4, 5, and 7, with
larger groups of dolphins detected in pools 1, 2 and 6 on the recapture. As Figure 3 shows it
is feasible to assume that the dolphin groups from the capture effort had moved to the latter
pools to form the larger groups, seen in the recapture effort. Analysis of data from the photo-
ID database confirms this, with 8 of the 11 identified dolphins from pools 4, 5, and 7, being
recaptured in pools 1, 2 and 6. Further mark-recapture work at various times of the year will
enable us to track individual movements and improve our understanding of Mekong
Irrawaddy behavioural ecology. Understanding dolphin movement patterns will be very
important in determining whether establishing dolphin protection zones would be an effective
conservation strategy, as well as the extent and location of such zones.
Although every effort was made to zigzag across pools from the top to the bottom, it is
possible that some dolphins were not detected due to the large width of some of the pools and
river sections. There is the additional difficulty in being able to detect dolphins with the
naked eye over 1km away. However the majority of survey efforts were conducted in good
visibility conditions, maximizing dolphin detection. The two rear observers reduced the
possibility of missing dolphins that were submerged within our field off view, and also
allowed for a 360º field of view to minimize missing dolphins when they surfaced. In
addition, each time dolphins were sighted the engine was stopped upriver and we floated with
the current to maximize the chance of sighting the dolphins, as the dolphins become more
elusive when the engine is on. Thus every attempt was made to ensure that we sighted
dolphins, and when sighted that we did not lose a sighted group until the photographer had
captured all the dorsal fins.
21CONCLUSION
Based on analysis of data collected during mark-recapture surveys in April and May 2007 the
estimated population abundance of the Irrawaddy dolphin in the Mekong River between
Kratie and the Khone Falls on the Laos border was calculated at 71 individuals with a range
of between 66 and 86 using a 95% Confidence Interval. This figure is substantially less than
the estimate (N=127, 95% CI=108-146) made by Beasley et al (2007) from surveys
conducted in 2005. In addition, it appears that direct counts relatively accurately reflect the
number of dolphins actually observed on a survey, but that the number of dolphins observed
may be fewer than the actual population size. In April this discrepancy was 20% and in May
21%. The number of dolphins observed in the Mekong River between Kratie and the Laos
border suggest that there are still sufficient dolphins for conservation efforts to be effective.
The sighting of 6-7 juveniles in May is promising, and suggests that there may be some
calves that are surviving, however further research is required to confirm this, as it is possible
that the same juvenile was seen in several pools, due to the high incidence of movement in
the May survey. It is likely that the dolphins in Cheuteal pool (Pool 9) are not moving
downstream during at least the dry season, and thus may be an isolated small population,
again further research is required to prove or disprove this.
It is strongly recommended that the mark-recapture photo-ID surveys are continued as part of
an ongoing population monitoring programme, with analysis of abundance estimations
between years using open population models, which account for changes in the size of the
population due to births and/or deaths. Open population models incorporate more data from a
number of surveys producing a more robust population abundance estimate.
Surveys should be conducted periodically throughout the year encompassing the dry and wet
seasons, the authors suggest three surveys a year - two in the dry season and one in the wet.
In addition, there is a need to increase the identification effort on mothers, calves and
juveniles. If these recommendations are followed it will not only provide a more robust
model for population abundance estimation, but also, through the development of the dolphin
database, enable assessment of survival rates for the identified animals (important
considering the high mortality values reported during the last five years), as well as provide
information on dolphin movements and Mekong Irrawaddy ecology. The combination of this
information will enable managers to improve the effectiveness of dolphin conservation
planning and management.
22REFERENCES
Beasley, I., Somany, P., Gilbert, M., Phothitay, C., Saksang, Y., Lor Kim, S. and Kim, S.
2007. Review of the Status and Conservation of Irrawaddy Dolphins Orcaella
brevirostris in the Mekong River of Cambodia, Laos PDR and Vietnam. In Status and
Conservation of Freshwater Populations of Irrawaddy Dolphins Eds Smith, B.D.,
Shore, R.G. and Lopez A. WCS Working paper No. 31, May 2007, ISSN 1530-4426.
Dove, V. Dove. D. Trujillo, F. 2007. Abundance Estimation of the Mekong Irrawaddy
Dolphin Orcaella brevirostris Based on Mark and Recapture Analysis of Photo-
identified Individuals. WWF technical report. p24.
Hammond, P.S. 1986. Estimating the size of naturally marked whale populations using
capture-recapture techniques. Rep. Int. Whal. Commn (special issue) 8: 253-82
Kreb, D. 2005. Abundance of freshwater Irrawaddy dolphins in the Mahakam River in East
Kalimantan, Indonesia, based on mark-recapture analysis of photo-identified
individuals. Journal of Cetacean Research and Management 6(3): 269-277.
Kreb, D. & Budiono. 2005. Conservation management of small core areas: key to survival of
a Critically Endangered population of Irrawaddy river dolphins Orcaella brevirostris
in Indonesia. Orynx 39(2) 1-11
MAFF (Ministry of Agriculture Forestry and Fisheries). 2005. Cambodian Mekong Dolphin
Conservation Strategy.
Reeves, R.R., Smith, B.D., Crespo, E.A. and Notarbartolo di Sciara, G. (compilers). (2003).
Dolphins, Whales and Porpoises: 2002-2010 Conservation Action Plan for the
World’s Cetaceans. IUCN/SSC Cetacean Specialist Group. IUCN, Gland,
Switzerland and Cambridge, UK. Xi+139pp
Smith, B.D., Jefferson, T.A., 2002. Status and conservation of facultative freshwater
cetaceans in Asia. The Raffles Bulletin of Zoology, Supplement 10:173-187.
Trujillo, F. 2007. Abundance estimation of the Mekong Irrawaddy dolphin using mark-
recapture technique. Technical Report for WWF Cambodia.
ACKNOWLEDGEMENTS
We would like to thank the research team that took part in the survey and data analysis
particularly Lor Kim San, Kim Sokha, Vinn Bunna and Tan Someth Bunvath. In addition, we
would like to extend our gratitude to the Fisheries Administration and Commission for
Dolphin Conservation and Ecotourism Development for their ongoing support for this
project.
23APPENDICES
Appendix 1: Event and environmental conditions data sheet
Stratum River Glare Sight- Dolphin no. Dolphin Dolphin
Day Month Year Time Event Stratum no. Latitude Longitude Speed state strength ability (best) activity location
24Appendix 2: Event and environmental conditions coding
EVENTS STRATUM CODE
S Start effort 1 Main River
E End effort 2 Pool
D 30 minutes of regular survey 3 Tributary
O Observation 4 Narrow channel
5 Island
STATE OF THE RIVER
STRATUM No.
1 Calm
2 Moderate / Ripples Pools
3 Wavy 1 Kampi & Chroy Banteay
2 South of Koh Rongeav
SIGHTABILITY 3 Koh Pdao
4 Khsach Makak & Sampan
1 Excellent / very good 5 Koh Dambong
2 Good 6 Tbong Klah
3 Fair 7 Koh Konsat
4 Poor 8 Koh Santuk
5 Very bad 9 Cheuteal
River
GLARE A South of Kampi
B Kampi > S. of Koh Rongeav
0 No glare C S. of Koh Rongeav > Koh Pdao
1 Some glare D Koh Pdao > Ksach Makak
2 Moderate E Ksach Makak > Koh Dambong
3 Severe glare F Koh Dambong > Tbong Klah
G Tbong Klah > Koh Konsat
DOLPHIN ACTIVITY H Koh Konsat > Koh Santuk
I Koh Santuk > Cheuteal
1 Feeding J Cheuteal > Kong Falls
2 Travelling
3 Mating / sexual
4 Playing / social
5 Spitting
6 Milling
7 Not defined
DOLPHIN LOCATION
1 close to shore
2 middle of river
3 near boat
ENGINE SPEED
0 OFF
1 < 5 km/h
2 > 5 km/h
25Appendix 3: Photo-ID sighting record sheet
Set Stratum Composition Camera WWF
Date Start time End Time group Code Latitude Longitude Low High Best A J C From To
26Appendix 4: Photo-ID efficacy and ID criteria data sheet
ID Criteria
Set Total Suitable
Date Stratum No. Total
group pictures pictures Notches Protrusion Deformity Lesions Scars Combination
27Appendix 5: Photo-ID database
2829
30
31
32
33
34
35
36
37
38
39
40
41
42
43
44
45
46
47
48
49
50
51
52
53
54
55
56
57
58
59
60
61
62
63
64
65
66
67
68
69
70
71
72
73
74
75
76
77
78
79
80
81
82
83
84
85
86
87
88
You can also read