RESEARCH PAPER Regional fellowship program - RESEARCH ...
←
→
Page content transcription
If your browser does not render page correctly, please read the page content below
RESEARCH PAPER
                 Regional fellowship program

      Climate Change Impacts on Rice Farming in
          Chao Phraya River Basin of Thailand
                  from 1975 - 2015

                      Researcher:             Ms. Sangduen Pongput,
                                              Fellow from Thailand

                      Direct Supervisor:      Dr. Sryneath Chhuor, Senior
February 2018                                 Instructor
                      Associate Supervisor:   Mr. Nheip Seila, Geographer
                      Editor:                 Mr. John Christopher, PRCD
                                              Director and
                                              Ms. Margaret Bywater,
                                              Librarian Specialist
Notice of Disclaimer The Parliamentary Institute of Cambodia (PIC) is an independent parliamentary support institution for the Cambodian Parliament which, upon request of the parliamentarians and the parliamentary commissions, offers a wide range of research publications on current and emerging key issues, legislation and major public policy topics. This research paper provides information on subject that is likely to be relevant to parliamentary and constituency work but does not purport to represent or reflect the views of the Parliamentary Institute of Cambodia, the Parliament of Cambodia, or of any of its members, and Parliament of Myanmar, or of any of its members, the Parliament of Lao PDR, or of any of its members, the Parliament of Thailand, or of any of its members. The contents of this research paper, current at the date of publication, are for reference and information purposes only. These publications are not designed to provide legal or policy advice, and do not necessarily deal with every important topic or aspect of the issues it considers. The contents of this paper are covered by applicable Cambodian laws and international copyright agreements. Permission to reproduce in whole or in part or otherwise use the content on this website may be sought from the appropriate source. © 2018 Parliamentary Institute of Cambodia (PIC)
Table of Contents

1. Introduction ........................................................................................................................................... 1
   1.1 Background of the Study ................................................................................................................ 1
   1.2 Research Objectives ........................................................................................................................ 1
   1.3 Research Questions ........................................................................................................................ 1
   1.4 Method ............................................................................................................................................ 1
2. Overview of Climate Change, Natural Disasters and Rice Farming in Chao Phraya River Basin
    of Thailand - Past and Current Issues .................................................................................................. 2
   2.1 General Information about the Chao Phraya River Basin ............................................................. 2
   2.2 Rice Farming in Chao Phraya River Basin ....................................................................................... 4
   2.3 Cooperation between Farmers and the Government in Rice Farming ........................................ 4
3. Impacts of Climate Change and Floods on Rice Farming in the Chao Phraya River Basin of
    Thailand. ................................................................................................................................................ 6
   3.1 Overview of Climate Change and Vulnerability in Thailand.......................................................... 6
   3.2 Impacts of Climate Change and Floods on Rice Farming .............................................................. 9
   3.2.1 Impacts on Production................................................................................................................. 9
   3.2.2 Impacts on Agricultural Land..................................................................................................... 10
   3.2.3 Impact on Export Quantities and Values .................................................................................. 11
4. Government Policies of Rice Farming and Remaining Challenges ................................................... 11
4.1 Government Policies ......................................................................................................................... 11
   4.1.1 Long Term Policies for Rice Farming ......................................................................................... 11
   4.1.2 Zoning for Monkey Cheeks ........................................................................................................ 13
   4.2 Remaining Challenges ................................................................................................................... 13
5. Conclusion ........................................................................................................................................... 14

                                                               List of Figures
Figure 1: Chao Phraya River Basin Overview ........................................................................................... 2
Figure 2: Evolution of the Thai Rice Policy and Committee .................................................................... 5
Figure 3: Evolution of the Thai Water Resource and Flood Management Institutions ......................... 6
Figure 4: Average temperatures in Thailand for 10 year periods compared with the normal level
(Celsius) [18, 20] ........................................................................................................................................ 7
Figure 5: Rainfall volumes in Thailand for 10 year periods compared with normal volumes [18, 21] . 8
Figure 6: Major and second rice harvested area and production, 1994-2011 .................................... 10
Figure 7 : Export quantities and values .................................................................................................. 11

                                                                     List of Tables
Table 1: Flood events and effects on land and human lives in the Chao Phraya River Basin, 1998-
2013 ........................................................................................................................................................... 8
Table 2: Agricultural area destroyed by floods ...................................................................................... 10
Table 3: The Long-Term Climate Risk Index (CRI): the 10 countries mostly affected, 2017 [25] ....... 13
1. Introduction
1.1 Background of the Study
Climate change refers not only to global changes in temperature, but also changes in wind,
precipitation, and seasons, the strength and frequency of extreme weather events– droughts and
floods. Climate change is expected to continue for Thailand. This could affect major agriculture
production, particularly rice farming, throughout the country. [1]
In Thailand, rice is farmed in both the basin and mountain areas and each faces different problems.
Rice farming in Chao Phraya River Basin has been facing uncertainties in production and damage
caused by natural disasters from the severe floods in 1982, 1991, 2011, 2016, and changes to water
management policies and weather during 1975 -2015. Supakorn Chinwanno, the Climate Change
Specialist, stated that farmers experienced unpredictable rice production, and losing investment
and profits from their products during this time. [2]
1.2 Research Objectives
To further examine the challenges of rice farming in the face of climate change, this study focuses
on the impacts of flooding, one of the major natural disasters affecting the Chao Phraya River Basin.
Floods in this context refer to extreme situations when water from the Chao Phraya River Basin
overflows its banks, usually after heavy rainfall, affecting rice crops in that area. The specific
objectives of this study are:
(1) To describe the current rice farming situation in the Chao Phraya River Basin of
Thailand.
(2) To review the impacts of climate change and floods on rice farming.
(3) To review adaptation policies and to identify challenges due to climate change
1.3 Research Questions
To achieve these objectives, the study focuses on the following research questions:
1. What is the current situation and the impact of climate change on rice farming in
Chao Phraya River Basin of Thailand?
2. What is the current status of climate change adaptation plans for rice farming of
Thailand?
3. What are the challenges for rice farming in Chao Phraya River Basin of Thailand?
1.4 Method
The methodology used in this research is based on a literature review of Thailand’s official policies
and official statistics from the Ministry of Agriculture and Cooperatives, the Ministry of Science and
Technology, and the Ministry of Natural Resources and Environment. The paper is also based on a
review of existing studies by Kasetsart University, The Thailand Research Fund (TRF), and Thailand
Development Research Institute (TDRI).
12. Overview of Climate Change, Natural Disasters and Rice Farming in Chao Phraya River Basin of
Thailand - Past and Current Issues
2.1 General Information about the Chao Phraya River Basin
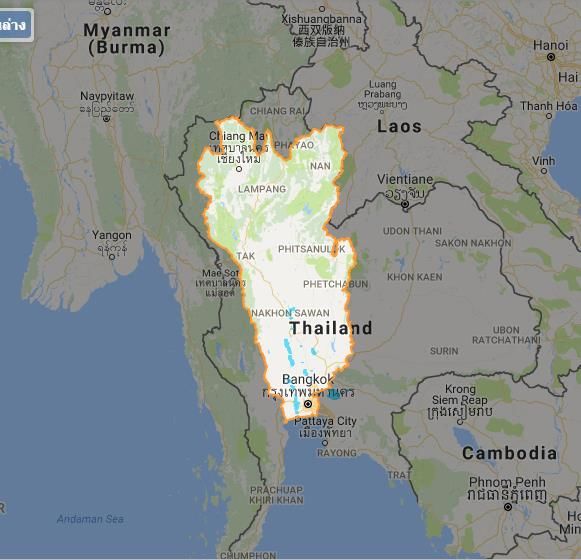
The Chao Phraya River Basin (CPRB) of Thailand is located in the central part of the country, as
shown in Figure 1. The largest river basin in Thailand, CPRB covers approximately 35 percent of the
country’s total area.[3, p. 137] The CPRB is composed of four rivers originating in the northern
mountains of Thailand: Ping River, Wang River, Yom River, and Nan River, all of which meet in
Nakhorn Sawan Province and flow through densely populated areas southward into the Gulf of
Thailand.[4, p. 367] Figure 2 shows that the basin is divided into 8 sub-basins: The Ping, Wang, Yom,
Nan, Chao Phraya, Sakae Krang, Pasak, and Tha Chin Rivers. The northern region of the country,
known as the upper CPRB, consists of The Ping, Wang, Yom, and Nan River, while the central region,
the lower CPRB, consists of the Chao Phraya, Sakae Krang, Pasak, and Tha Chin River.[3, p. 137]
Due to the geography of the CPRB, it stores water that flows from the north. In some years CPRB is
covered by floods as a result of natural disasters. The history of floods from 1900 – 2016, shows
that 71 severe flood events were documented,[5, 6] some of which lasted for a month or more.[5]
Crops were destroyed and the quality of the rice was reduced when the farmers could not harvest
their rice in time. As an economic issue, the price of rice products decreased in some years due to
lower quality. [2]
Figure 1: Chao Phraya
Figure River
1: Chao BasinRiver
Phraya Overview
Basin Overview
Source: Royal Irrigation Department. 2018. [7]
2Drainage
Ping Wang Yom Nan
River River River River
Chao Phraya River
Pasak River
Sakae Kreng River
Tha Jean River
Noi River Lopburi River
Thai Gulf
Source: Hydro and Agro Informatics Institute (HAII). 2018. [8]
32.2 Rice Farming in Chao Phraya River Basin
The major regions of the Chao Phraya River Basin include agricultural, residential and industrial
areas. The main agricultural activity is rice farming which covers approximately 960,000Ha (6
million rai) of land, in which 640,000 Ha (4 million rai) are in irrigable areas. The rice growing period
in Thailand lasts four months in one farming season. Farmers can grow rice three times per year or
five times every two years.[2] This means that farmers need a high volume of water to grow rice
every year.
The growing season starts in May and ends in September. Rice crops can also be divided into two
types according to the cultivation period: (1) in-season rice, known as the “Major Rice” (May to
October); and (2) off-season rice, known as the “Second Rice or Dry Rice” (November to April).
There are three types of rice cropping systems as following:
1) single-cropped rice, lasting for 160-180 days (long-term rice varieties) often planted
under predominantly rain-fed conditions in the lower Mekong Basin (Northeast of Thailand)
2) double-cropped rice, and
3) triple-cropped rice.
Double and triple-cropped rice use short-term varieties (90-100 days) and are mainly
concentrated in the lower CPRB because the area is irrigated throughout the year [3, p. 137].
Table 1 shows the rice farming cycle for the year 2013-2015. However, the rice cycle in each
season is dependent on the weather and the amount of water each year. For example, planting of
“major rice” starts around June in the rainy season. In cases of severe flooding, planting may start in
October. In many cases, delays prevent farmers from harvesting on time or reduce product quality,
a reduction of over 15 % from the standard level.i [9]
Table 1. Rice farming cycle, 2013-2015
period 2013 period 2014 period 2015
Month 1 2 3 4 5 6 7 8 9 10 11 12 1 2 3 4 5 6 7 8 9 10 11 12 1 2 3 4 5 6 7 8 9 10 11 12
Major rice Planting Harvest Planting Harvest Planting Harvest
Dry rice Planting Harvest Planting Harvest
Source: Office of Agricultural Economics. 2018.
2.3 Cooperation between Farmers and the Government in Rice Farming
Even though during 1975- 2015 Thailand was on average the largest rice exporting country in the
world, it did not have a specific rice farming policy until the mid-2000s. As shown in Figure 3, the
first rice farming policy (covering both the long and short term) began in 2005, when a committee
was established to provide advice on any subject related to rice production and products. [10]
i
Quality factors – specific moisture content 15% m/m max Lower moisture limits should be
required for certain destinations in relation to the climate, duration of transport and storage.
Governments accepting the Standard are requested to indicate and justify the requirements in
force in their country.
4Figure 2: Evolution of the Thai Rice Policy and Committee
Rice Policy Committee National Rice Policy Committee Rice Policy and Management
Committee
2005 2007 2014
- Rice Policy short & long term - Rice Policy & strategy- short & - Define policy planning, project &
- Approved planning, project long term principles related to rice
& principles related farming, - Approval planning, project & production
rice pledging scheme, price principles related farming, rice - Approved planning, project &
controls, and export marketing principles related to farming &
commodity release - Supporting research related marketing
- Thai Rice Policy 2007-2011 farming and marketing -Support research & develop to
- Define Principle & support to increase quality, reduce cost &
help farmer, farmer institution, support to farm rice which market
rice mill, trader & exporter needs
- Approved Principles & support to
help farmers, farmers’ institutions,
rice mills, traders & exporters.
Source: Department of Internal Trade. 2018.
Water management in Thailand was embedded in over 50 laws involving more than 30 government
authorities across 7 different ministries. There were overlapping authorities and none of the laws
gave the authority to divert water for usage and none had concerns specifically with flood
management. In response, the Thai government established the National Water Resource
Management committee in 1989 for overarching water management and changed the policy and
committee be responsible to cabinet. [11]
Currently, the government has established policies dealing with water management. These include
support for rice farming both long term, and year-by-year policies, as responsible policies after
natural disasters. The current rice farming policy No. 3 2015-2019 (Buddhist era: BE 2558 -2562)
aims to encourage farmers to: 1) grow other types of crops (e.g., drought resistant) in case of
drought, 2) reduce the number of times rice crops are planted per year, and 3) cooperate with one
another to form larger rice farm holdings.[12]
In addition, Thailand is implementing a 12-year-Strategic Plan for Water Resources Management for
2015 – 2026 (Buddhist era: BE 2558 – 2569), which includes short, medium and long-term planning.
The plan includes a strategic management plan covering flood and drought events. [12, 13]
Every year, the government is responsible for announcing the rice farming policies to farmers
before the rice growing season begins. The purpose of the policy is to announce the targeted
5amount of farming area which is in line with water availability and management and pricing
controls. However, in some years there are timing problems between the official announcement of
targets and the rice crop calendar. As a result, the government’s yearly target on the size of
farming area and production is not always achieved because farmers have started their farming
cycle before the announcement by the government. The government’s yearly target is the
approximate amount of paddy rice produced in the country. This target aims to regulate over
supply and market prices of paddy, and to estimate the amount of government support needed for
farming in the case of disasters.
Figure 3: Evolution of the Thai Water Resource and Flood Management Institutions
PMO’s Reg: PMO’s Reg PMO’s Reg PMO’s Reg: PMO’s Reg: National
1 2
governing on NWRM on NWRM governing governing Water
National strategic National Resource
Water plan for Water & Committee
Resource water Flood
Manage- management Manage-
ment. . ment.
(NWRM)
1989 2002 2006 2011 2012 2015
4
National NWRC + NWRC + 25 - National Water National Water
Water Water-shed Watershed & Flood Policy Resource
Resources councils Councils with committee Committee
Committee representative - National Water - 5 sub
(NWRC) from various & Flood Committees
chaired and stakeholders Management
member - Head: PM
committee
appointed by
3
PM.
Note:1: PMO’s Reg: Prime Minister’s Office Regulation
2. NWRM: National Water Resource Management
3. PM: Prime Minister
4. NWRC: National Water Resources Committee
Source: Deunden Nikomborirak and Kittipong Ruenthip. 2013. [13]
3. Impacts of Climate Change and Floods on Rice Farming in the Chao Phraya River Basin of Thailand.
3.1 Overview of Climate Change and Vulnerability in Thailand
Climate Change has been defined in the United Nations Framework Convention on Climate Change
(UNFCCC) [14] as follows:
6“Climate Change means a change of climate which is attributed directly or indirectly to human
activity that alters the composition of the global atmosphere and which is in addition to natural
climate variability observed over comparable time periods.”
Similarly, the Intergovernmental Panel on Climate change (IPCC) gives a more detailed definition of
climate change as: “Climate change refers to a statistically significant variation in either the mean
state of the climate or in its variability, persisting for an extended period (typically decades or
longer). Climate change may be due to natural internal processes (operates from within the climate
system, for example the change in the global energy balance due to changes in the composition of
the atmosphere and greenhouse gas) or external forces (operates from outside the Earth's climate
system, and includes changes in the global energy balance due to variations in the Earth's orbit
around the Sun, and changes in the amount of energy coming from the Sun or Solar Variability)
[15], or to persistent anthropogenic changes (resulting from or produced by human beings) in the
composition of the atmosphere or in land use.” [16] Greenhouse effects from Human Activities are
the main reasons contributing to climate change [17, 18] which has an effect on temperature,
rainfall, drought, cyclones and monsoons.
Climate Trends in Thailand: Temperature and Rainfall
Recorded temperatures and rainfall in Thailand reveal that both have increased during the last two
decades as shown in Figures 4 and 5.[17, 8]
Preyachaya Klaytoun [19] found that when rice farming encounters extreme floods and high
amounts of water in paddy fields of over more than 10 centimeters per week, there will be a loss of
about 60% of the rice products in each flooded field.
Figure 4: Average temperatures in Thailand for 10 year periods compared
with the normal level (Celsius) [18, 20]
1981-1990
1991-2000
2001-2007
1961-1970
1971-1980
1951-1960
7Source: Department of Meteorological. 2018
Figure 5: Rainfall volumes in Thailand for 10 year periods compared with
normal volumes [18, 21]
2001-2 017
1971-1980
1981-1990
1951-1960
1961-1970
1991-2000
Source: Department of Meteorological. 2018
History, Main Causes and Effects of Floods in Chao Phraya River Basin
Between 1975 and 2015, Thailand was impacted by water related natural disasters, particularly
floods and droughts. The central part of Thailand faced many flood events during this period. Table
2[20] shows the flood events and their effects on land and people’s livelihoods from 1998 to 2013.
Table 1: Flood events and effects on land and human lives in the Chao Phraya River Basin, 1998- 2013
Area Magni- Damage
Duration
Year Begin Ended affected Dead Displaced Main cause tude (Thousand
(days)
(km2) ** USD)
1988 18-Sep-88 5-Oct-88 18 243171 19 16000 Torrential rain 6.9 700
1994 3-Sep-94 18-Dec-94 107 65261 407 2000000 Heavy rain 7.1 153
1995 1-Aug-95 9-Nov-95 101 444498 260 4220000 Heavy rain 8.0 395,267
1999 25-Oct-99 9-Nov-99 16 232555 632 1114000 Tropical cyclone 6.9 265,000
2002 18-Aug-02 26-Nov-02 101 371596 65 400000 Monsoonal rain 7.9 32,000
2002 17-Sep-02 2-Dec-02 77 139683 1 3000 Monsoonal rain 7.0
2003 12-Sep-03 12-Oct-03 31 314895 7 10000 Monsoonal rain 7.0 3,690
2004 6-Aug-04 3-Oct-04 59 378045 11 60000 Monsoonal rain 7.3
2005 13-Aug-05 26-Sep-05 45 134287 11 119270 Monsoonal rain 7.1
2005 23-Nov-05 12-Jan-06 51 70520 69 700000 Monsoonal rain 6.9
82006 10-Oct-06 4-Nov-06 26 174277 0 0 Monsoonal rain 6.8
2006 20-Aug-06 13-Dec-06 116 213081 195 2000000 Monsoonal rain 7.6 8,100
2007 5-Sep-07 10-Nov-07 67 299972 10 17000 Monsoonal rain 7.3
Tropical Storm
2008 11-Aug-08 20-Aug-08 10 219466 130 4000 Kammuri; Heavy 6.3
rain
2008 11-Sep-08 4-Oct-08 24 165834 0 0 Monsoonal Rain 6.9 8,000
2011 5-Aug-11 9-Jan-12 158 96785 790 10000 Tropical Storms, 7.2 465,000
Monsoonal Rain
2013 30-Sep-13 14-Oct-13 15 312091 42 982799 Monsoonal Rain 7.0
**Flood Magnitude = LOG*(Duration x Severity x Affected Area)
*LOG = Logarithm
Source: G.R.BRAKENRIDGE. 2018. [20]
Table 2 shows that monsoonal rain is one of the main causes of floods across the country, effecting
a total area of to 444,498.3 km2 in 1995, the largest impact as compared with other years. The
highest economic effect is the 2011 event which impacted the agricultural, industrial and housing
sectors.
3.2 Impacts of Climate Change and Floods on Rice Farming
Most of rice fields in the CPRB are located on alluvial and flood plains which absorb water flow from
the northern part of the country. However, the monsoon occurs in Thailand almost every year
which can result in heavy rainfall.
3.2.1 Impacts on Production
Each year, paddy farming area and production quantity have been affected by floods. Figure 7
shows that from 1994 to 2011, both the size of the harvested area and production increase and the
rice yield per hectare grew at a rate of around 2 percent on average annually. However, since 2012,
the production of rice has been decreasing. The decrease in yield can be caused by many factors
such as; 1) less frequent or delays in the rice farming cycle during the years of severe flooding 2)
less developed equipment and technology in farming activities.
9Figure 6: Major and second rice harvested area and production, 1994-2011
Source: FAOSTAT.2018.
3.2.2 Impacts on Agricultural Land
Table 3 shows the amount of agricultural land destroyed by floods in the Chao Phraya River Basin.
The flood in 1994 destroyed the largest amount of agricultural land. In 1995 however, the Chao
Phraya experienced one of the biggest flood events in history, affecting the largest area as
compared to floods in other years; yet, the destruction of agricultural land was less than that of
1994. In 2011 while the agricultural sector experienced the largest destruction in terms of
economic value, the area of destroyed agricultural land was lower than in 1999.
Table 2: Agricultural area destroyed by floods
Duration Area affected Destroyed agriculture area
Year Begin Ended 2
(days) (km ) (Million Rai)
1988 18-Sep-88 5-Oct-88 18 243171 NA
1994 3-Sep-94 18-Dec-94 107 65261 14,000,259
1995 1-Aug-95 9-Nov-95 101 444498 3,792,364
1999 25-Oct-99 9-Nov-99 16 232555 3,038,167
2002 18-Aug-02 26-Nov-02 101 371596 10,435,115
2002 17-Sep-02 2-Dec-02 77 139683 NA
2003 12-Sep-03 12-Oct-03 31 314895 1,595,557
2004 6-Aug-04 3-Oct-04 59 378045 3,298,733
2005 13-Aug-05 26-Sep-05 45 134287 1,701,450
2005 23-Nov-05 12-Jan-06 51 70520 NA
2006 10-Oct-06 4-Nov-06 26 174277 6,560,541
10Duration Area affected Destroyed agriculture area
Year Begin Ended 2
(days) (km ) (Million Rai)
2006 20-Aug-06 13-Dec-06 116 213081 NA
2007 5-Sep-07 10-Nov-07 67 299972 1,617,284
2008 11-Aug-08 20-Aug-08 10 219466 6,590,655
2008 11-Sep-08 4-Oct-08 24 165834 NA
2011 5-Aug-11 9-Jan-12 158 96785 11,798,241
2013 30-Sep-13 14-Oct-13 15 312091 6,099,777
Note: NA: Data is not available
Source: Department of Disaster Prevention and Mitigation. 2018
3.2.3 Impact on Export Quantities and Values
Figure 8 shows that the export quantities as well as export values deceased sharply in 2012 and
2013. This can be explained by the effects of large flood event in 2011 resulting in the loss of rice
production and damage to arable land, which further reduced the rice quantity available in the
market in the following years.
Figure 7 : Export quantities and values
Total Quantity and Export Values of Rice
Export Quantity: Kilogram (Left) Export Value : Baht (Right)
12,000 250,000.00
Millions
Millions
10,000 200,000.00
8,000
150,000.00
6,000
100,000.00
4,000
2,000 50,000.00
0 0.00
1998
1999
2000
2001
2002
2003
2004
2005
2006
2007
2008
2009
2010
2011
2012
2013
2014
2015
Source: Office of Agriculture Economics. [21]
4. Government Policies of Rice Farming and Remaining Challenges
4.1 Government Policies
4.1.1 Long Term Policies for Rice Farming
After the floods in 2011, Thailand has been more active in integrated rice farming and water
management policies into long-term planning. In its yearly planning, the Government announces
which areas should be used for the farming of the major rice and second rice depending on the
weather forecasts.
11Water management policy will focus on how to preserve water for agriculture and daily use,
manage the amount of natural and irrigable water and how to manage in case of flood or droughts.
Mostly, water policies focus on droughts rather than floods. In the case of floods, the government
has a plan to limit water being held in dams, to control the flow of water into the gulf of Thailand
and to preserve the rice farming area for monkey cheek zoningii [22] to reduce the economic
effects in certain areas. In some years, the implementation is not in line with the plan because the
amount of water does not match the forecast. [23]
In addition, Thai government had a National Adaptation Plan for Agriculture (NAP-Ag) for 2013-
2016 and is now drafting the 2nd plan for 2017-2021 (B.E. 2560-2564) and developing the NAP work
plan. The plan is under the responsibility of Department of Agricultural Economics, Ministry of
Agriculture and Cooperatives.[17]
The NAP-Ag plan is under the climate change master plan for 2015-2050 and 12th National
Economic and Social Development Plan (2017-2021). The vision of the NAP-Ag plan states that
Thailand’s agriculture should be climate resistant and contribute to mitigating climate change
problems under Sufficiency Economy Philosophy and the sustainable development pathways.
Strategic goals in the 2017 -2021 plan include:
1) Adaptation for enhancing climate resilience
2) Sustainable development
3) Building networks and collaborations between farmer, government and stakeholder in
local level, national level and international level
4) Enhancing competitiveness in the world market
5) Developing technology transforms that are environmental-friendly and have low carbon
production
The plan for 2017 -2021 has three priorities for climate change adaptation:
1) Water management
2) Sustainable soil management
3) Strengthening farmers’ climate resilience
Thai NAP-Ag included both mitigation and adaptation plans for agriculture by defining them
as a strategic plan. Some of these plans are:
Adaptation plans
- Strategy no. 1 – collect and develop database, knowledge, technology and innovation for
awareness in climate change adaptation
- Strategy no. 2 – increase capacity in climate change adaptation for agriculturists,
agricultural institutions, and related businesses
ii
The term ‘monkey cheek’ was introduced by King Bhumibol Adulyadei of Thailand as a metaphor
to promote local water retention systems and is part of the ‘New Theory’ in Agriculture. It refers to
monkeys filling up their cheeks with excess food. The food is stored and chewed and eaten later.
The monkey cheek programme was initially started to solve the flood problems of Bangkok, but has
subsequently been replicated all over the country, especially in the north-east
12- Strategy no. 4 – increase capacity management for climate change in agriculture
Mitigation plans
- Strategy no. 3 – The Agricultural Sector shall participate to reduce the greenhouse effect
and develop global environmental-friendly practices.
From NAP-Ag, 12th National Economic and Social Development Plan (2017-2021) and
Government policy, Thailand has expanded the plans and strategies which aim to reduce the causes
and effects of climate change.
“Big area rice farming policy” aims to encourage farmers to cooperate with each other to
farm in a large area and share water and other resources.
“Smart farmer policy” calls for not only for the use of technology to forecast weather and
market prices, but also, the use biotechnology for developing seeds and preserving crops to meet
quality standards.
“Added value rice farming policy” aims at having farmers growing added value rice that
meets the customer’s needs for example organic rice and high grain and healthy rice.
4.1.2 Zoning for Monkey Cheeks
The water management plan of the Ministry of Agriculture and other related agencies aims to
reduce the effects of floods on economic zones in cases of natural disasters. This is accomplished by
using rice farms as a flood way or as detention basins to move water to other river basins, or by
waiting until the volume of water has reduced. The affected areas are usually greater than
estimated because the volume of water is higher than expected which results in flash floods. Due to
such events, harvesting is not possible even though the paddy is ready to be harvested and, thus,
the products are destroyed.
4.2 Remaining Challenges
Despite government policies on climate change adaptation, according to Global Climate Risk Index
2018, Thailand is one of the top ten countries most affected by climate change and extreme
weather from 1997 to 2016 (annual averages).Moreover, in the 2017 Index, Thailand is ranked 10th
out of the top 10 countries, as shown in Table 4. This ranking shows that Thailand has not made
much progress in terms of dealing with climate risk. [24, 25]
The Meteorological Department has forecasted that Thailand will have higher temperatures, and
floods may affect all parts of the country.
Table 3: The Long-Term Climate Risk Index (CRI): the 10 countries mostly affected, 2017 [25]
CRI 1996- Number of
Total losses Losses
2015 CRI Deaths per 100 events
Country Death toll in Million per unit
(1995- score 000 inhabitants (total 1996-
US$ (PPP) GDP in %
2014) 2015)
1 (1) Honduras 11.33 301.90 4.36 568.04 2.100 61
2 (2) Myanmar 14.17 7145.85 14.71 1300.74 0.737 41
3 (3) Haiti 18.17 253.25 2.71 221.92 1.486 63
4 (4) Nicaragua 19.17 162.90 2.94 234.79 1.197 44
135 (4) Philippines 21.33 861.55 1.00 2761.53 0.628 283
6 (6) Bangladesh 25.00 679.05 0.48 2283.38 0.732 185
7 (8) Pakistan 30.50 504.75 0.32 3823.17 0.647 133
8 (7) Vietnam 31.33 339.75 0.41 2119.37 0.621 206
9 (10) Guatemala 33.83 97.25 0.75 401.54 0.467 75
10 (9) Thailand 34.83 140.00 0.22 7574.62 1.004 136
Source: The Long-Term Climate Risk Index (CRI). 2018.[24]
Climate change and extreme natural disasters such as floods are to impact further farmers’
livelihood. Since farmers usually have to use their traditional or previous year experience to prepare
for next years’ farming cycle, production outcomes are mostly unpredictable and unsatisfactory.
Climate change will continue; these problems need to be addressed and adapted to improve
farmers’ working conditions within limited resources. Further support and appropriate options for
adaptation of infrastructure, knowledge and information sharing, research and technology are
important in this regard. Research studies on farming of flood and drought resistant crops are also
needed as models for farmers.
5. Conclusion
This paper reviewed the current situation regarding rice farming in the Chao Phraya River Basin of
Thailand, the impact of climate change and flood events on rice farming, and the climate change
adaptation plan for rice farming in place for this area.
The study revealed that between 1975 and 2015, CPRB encountered many unexpected and
extreme flood events. Recorded mega flood events occurred in 1975, 1978, 1983, 1988, 1993,
1995, 1996, 2001, 2002, 2006, 2010, and 2011. Mostly, the floods were caused by extreme weather
and heavy rain. The flood in 1995 was ranked the highest, causing a submerged area of 444,000
km2, while the 2011 event was the longest (158 days) and led to the largest economic losses of
about USD 46,500,000. The 2011 flood in CPRB damaged not only housing, but also, more than 1.92
million hectares of land, consisting of 1.35 million hectares of rice fields which represented 12.5
percent of all cropland.[23]
The forecasted statistical analysis of maximum and minimum temperature and rainfall in Thailand
after 2070 suggests that maximum temperatures will be around 40-43 Celsius and minimums will
be at 13-17 Celsius. There will be increased unpredicted rainfall and monsoons which will affect
farming, harvesting cycles and cause production losses.
Climate change and floods are one of the key factors that will affect farmers’ lives and ways of
working. Usually, farmers use their former years’ experience to adapt to the change in weather and
prepare for the next years’ farming cycle. To be better prepared, farmers could integrate mitigation
and adaptation plans including plans to identify new challenges using research and technology
which would enable them to get more support from the government.
In addition, the government is engaging in developing water management strategies, rice farming
policies and climate change plans. However, these initiatives require broader dissemination to
ensure the public is aware of them. For the policies to be more effectively acknowledged and
implemented, action can be taken to circulate the information widely to the public. All main sectors
14particularly agriculture need to be incorporated into the mitigation and adaptation plans. The 2nd
draft National Adaptation Plan for Agriculture, 2017-2021, calls for agriculture to become climate
resilient and contribute to mitigating climate change problems under the Sufficiency Economy
Philosophy and Sustainable Development pathways: emphasizes a balanced use of material
resources, social capital, environmental reserves, and cultural wealth. Supporting new technology
and research for development is also another choice for improving climate change adaptation
plans.
15References
1. Thailand Development Research Institute (TDRI). (2015). เหลียวหลัง แลหน ้า ผลกระทบของ
สภาพภูมอ ิ ากาศรุนแรงต่อภาคเกษตรไทย [Online]. Available: https://tdri.or.th/2015/09/the-
impact-of-weather-extremes-on-agricultural/ [Accessed 18 December 2017].
2. ศุภกร ชน ิ วรรโณ. อนาคตของการปลูกข ้าวในลุม ่ แม่น้ าเจ ้าพระยา [Online]. Available:
http://climatechange.jgsee.org/v2/detail.php?ID=628&typeid=10&back=index.phpApril
[Accessed October 31 2017].
3. Nara, P., Mao, G.-G. & Yen, T.-B. (2014). Climate Change Impacts on Agricultural Products in
Thailand: A Case Study of Thai Rice at the Chao Phraya River Basin. APCBEE Procedia, 8, 136-
140.
4. Promchote, P., Wang, S.-Y. S. & Johnson, P. G. (2016). The 2011 Great Flood in Thailand:
Climate Diagnostics and Implications from Climate Change. Journal of Climate, 29, 367-379.
5. Singkran, N. (2017). Flood risk management in Thailand: Shifting from a passive to a
progressive paradigm. International Journal of Disaster Risk Reduction, 25, 92-100.
6. Son, N. T., Chen, C. F., Chen, C. R. & Chang, L. Y. (2013). Satellite-based investigation of
flood-affected rice cultivation areas in Chao Phraya River Delta, Thailand. ISPRS Journal of
Photogrammetry and Remote Sensing, 86, 77-88.
7. Royal Irrigation Department. (2018). Chao Praya River Basin
8. Hydro and Agro Informatics Institute (HAII) (2018). Chaophraya River Basin Data Drainage
Hydro and Agro Informatics Institute.
9. FAO (1995). Standard for Rice. CODEX STAN 198-1995. The Food and Agriculture
Organization.
10. สานักนายกรัฐมนตรี คาสงั่ สานักนายกรัฐมนตรี ที่ 122/2548 เรือ ่ ง แต่งตัง้ คณะกรรมการนโยบาย
ข ้าว.
11. John, A. (2013). Food Policy, 42, 48.
12. The Policy Committee for Water Resources Management (2015). The Strategic Plan on
Thailand’s Water Resources Management 2015-2026. In: DEPARTMENT OF WATER
RESOURCES (ed.). Bangkok.
13. Ruenthip, D. N. a. K. (2013). Policy Brief History of Water Resource and Flood Management
in Thailand.
14. The Intergovernmental Panel on Climate Change (IPCC). (1995). Climate Change : a glossary
by the Intergovernmental Panel on Climate Change [Online]. Available:
http://www.ipcc.ch/pdf/glossary/ipcc-glossary.pdf [Accessed 15 December 2017].
15. Department for Environment Food & Rural Affairs. Causes of Climate Change [Online].
Available:
http://www.lordgrey.org.uk/~f014/usefulresources/aric/Resources/Fact_Sheets/Key_Stage_
4/Climate_Change/02.html [Accessed 2 Febuary 2018].
16. United Nations. (1992). United Nations Framework Convention on Climate Change [Online].
Available:
http://unfccc.int/files/essential_background/background_publications_htmlpdf/application/
pdf/conveng.pdf [Accessed 15 December 2017].
17. คณะอนุกรรมการขับเคลือ ่ นยุทธศาสตร์การเปลีย ่ นแปลงภูมอ ิ ากาศด ้านการเกษตรภายใต ้
คณะกรรมการนโยบายและแผนพัฒนาการเกษตรและสหกรณ์ (2560). (ร่าง) ยุทธศาสตร์การ
เปลีย่ นแปลงภูมอ ิ ากาศด ้านการเกษตร กระทรวงเกษตรและสหกรณ์ (พ.ศ. 2560 - 2564).
18. วนิดา สุขสุวรรณ สภาวะโลกร ้อนกับการผันแปรภูมอ ิ ากาศในประเทศไทย.
19. ปรียชยา คล ้ายทวน (2554). ทางรอดของชาวนาไทย “ข ้าวหอมชลสท ิ ธิ”์ พันธุข
์ ้าวทนน ้าท่วม.
เกษตรกรรมธรรมชาติ 1449-55.
1620. G.R.Brakenridge. Global Active Archive of Large Flood Events [Online]. Dartmouth Flood
Observatory, University of Colorado. Available:
http://floodobservatory.colorado.edu/Archives/index.html.
21. Office of Agriculture Economics (2018).
22. TheWaterChannel. (2011). Monkey Cheeks Project (Kaem Ling) [Online]. Available:
http://www.thewaterchannel.tv/media-gallery/1860-monkey-cheeks-project-kaem-ling
[Accessed 22 January 2018].
23. Siripong, H., Wirat, K.-u. & Suwit, T. (Year) Published. Flood management in Chao Phraya
River basin. Proceedings of the International Conference: The Chao Phraya Delta: Historical
Development, Dynamics and Challenges for Thailand's Rice Bowl, 2000 Bangkok, Thailand.
24. David, E., Vera, K. & Laura, S. (2017). Global Climate Risk Index 2018 [Online]. Available:
https://germanwatch.org/en/14638.
25. Sönke, K., David, E. & Inga, M. Global climate risk index 2017 [Online]. Available:
https://germanwatch.org/en/download/16411.pdf.
17You can also read