Production of Hydrogen Peroxide for Drinking Water Treatment in a Proton Exchange Membrane Electrolyzer at Near-Neutral pH - IOPscience
←
→
Page content transcription
If your browser does not render page correctly, please read the page content below
Journal of The Electrochemical
Society

OPEN ACCESS

Production of Hydrogen Peroxide for Drinking Water Treatment in a
Proton Exchange Membrane Electrolyzer at Near-Neutral pH
To cite this article: Winton Li et al 2020 J. Electrochem. Soc. 167 044502

View the article online for updates and enhancements.

                                This content was downloaded from IP address 176.9.8.24 on 16/09/2020 at 01:34
Journal of The Electrochemical Society, 2020 167 044502

                            Production of Hydrogen Peroxide for Drinking Water Treatment
                            in a Proton Exchange Membrane Electrolyzer at Near-Neutral pH
                            Winton Li, Arman Bonakdarpour,* Előd Gyenge,*,z and David P. Wilkinson*,z
                            Department of Chemical and Biological Engineering and the Clean Energy Research Center, University of British Columbia,
                            Vancouver, BC V6T 1Z3, Canada

              We provide a detailed report on the electrosynthesis of H2O2 for drinking water treatment under near-neutral conditions using a
              proton exchange membrane (PEM) electrolyzer. Two novel cathode catalysts for O2 electroreduction to H2O2 were investigated in
              the PEM electrolyzer: an inorganic cobalt-carbon (Co–C) composite and an organic redox catalyst anthraquinone-riboflavinyl
              mixed with carbon (AQ–C), respectively. The impact of operational variables such as temperature, cathode carrier water flow rate,
              and anode configurations (aimed at mitigating carbon corrosion at the anode) were examined in single-pass and full recycle
              operation. Using a superficial current density of 245 mA cm−2 and an operating temperature of 40 °C, H2O2 molar fluxes of
              360 μmol hr−1 cm−2 and 580 μmol hr−1 cm−2 were generated at near-neutral pH with the Co–C and RF-AQ catalysts,
              respectively. Seventy-two hour experiments with closed loop recirculation, produced H2O2 concentrations of 1300 and 3000 ppm
              for the Co–C and AQ–C catalysts, respectively. These concentrations are adequate for advanced oxidation (UV/H2O2) treatment of
              drinking water, rendering the PEM electrolysis approach particularly suitable for on-site and on-demand production of H2O2.
              © 2020 The Author(s). Published on behalf of The Electrochemical Society by IOP Publishing Limited. This is an open access
              article distributed under the terms of the Creative Commons Attribution 4.0 License (CC BY, http://creativecommons.org/licenses/
              by/4.0/), which permits unrestricted reuse of the work in any medium, provided the original work is properly cited. [DOI: 10.1149/
              1945-7111/ab6fee]

              Manuscript submitted September 30, 2019; revised manuscript received December 16, 2019. Published February 11, 2020.
              Supplementary material for this article is available online

    Hydrogen peroxide is an excellent oxidizer and is widely used in              titanium anode for generation of oxygen, and a carbon felt cathode
a number of applications such as waste or drinking water treatment,               for reduction of the generated O2 to produce H2O2 in order to
textile industry, pulp and paper bleaching and a number of other                  remove dissolved organic carbonaceous compounds from municipal
chemical oxidation processes. Furthermore, it is considered an                    sewage plant effluents.11 In another application, Ridruejo et al.
environmentally-friendly oxidizer because oxygen and water are                    reported on the activity of pyrite-structured nanoparticles of
the only products of H2O2 decomposition. For these reasons,                       supported-CoS2 towards production of H2O2 and demonstrated their
hydrogen peroxide, with a global market of about $2.44 billion                    effectiveness on the removal of pharmaceutical tetracaine from an
(USD) per year, has a steady market growth trajectory for the next                acidic solution.12 Besides experimental activities, theoretical calcu-
decade.1 At present, economic and high-volume production of                       lations are also gaining significant attention in catalyst design and
hydrogen peroxide is only achieved by the anthraquinone auto-                     identification of catalytic trends. The propensity of an electrocatalyst
oxidation (AQAO) process (also known as the Riedl-Pfleiderer                       for reduction of O2 to H2O2 can be largely gauged by the adsorption
process) involving cyclic hydrogenation and oxidation of an                       energy of the HOO* intermediate in the overall reaction pathway,
alkylanthraquinone precursor, Pd-catalysts, organic solvents, and                 the strength of which should ideally be thermoneutral at the
liquid-liquid extraction. The Riedl-Pfleiderer process requires sig-               equilibrium potential (O2/H2O2 = 0.7 V vs SHE) in order to yield
nificant energy input and in addition, produces waste chemicals that               a theoretically zero-overpotential active surface. Recently, density
require proper disposal and/or recycling. Because of these difficul-               functional theory (DFT) techniques have been successfully used to
ties and also the great importance of H2O2 in the chemical industry               determine, and even predict, the trends in activity and selectivity of
and water treatment sectors, research on sustainable and green                    catalysts for the direct reduction of O2 to H2O2 by locating the
methods of H2O2 production remains quite active. One such                         optimum values of HOO* binding energy. For example, Verdaguer-
approach is the reduction of O2 to H2O2 through an electrochemical                Casadevall and co-workers have identified Pt-Hg and Ag-Hg
process. Campos et al. provide a review of AQAO and alternative                   electrocatalysts with enhanced activity for the reduction of O2 to
methods of H2O2 production.2                                                      H2O2.13,14 However, the practical applicability of Hg containing Pt
    In alkaline media, various forms of carbon can produce sig-                   and Ag catalysts is very limited. DFT calculations have also been
nificant amounts of hydrogen peroxide. Alkaline peroxide synthesis                 used to identify electrocatalysts, such as SnO2, which can selectively
has been demonstrated in a number of different reactor designs such               oxidize water to H2O2 (as opposed to O2) by tuning the OH* binding
as trickle bed, fluidized bed and gas diffusion electrode designs.3 In             energy in order to suppress the four electron process of oxygen
acidic to neutral media, however, modified forms of carbon (e.g.,                  evolution.15
with added metals such as cobalt) leads to lower oxygen reduction                     In our earlier studies, we reported on the synthesis and electro-
overpotentials.4–6 More recent research in this area include the work             chemical characterization of novel catalysts for the 2-electron
of Zhao et al. who reported high production rates and efficiency for               reduction of O2 to H2O2 including low-cost inorganic Co–C
the 2e- reduction of O2 to H2O2 on fluorine-doped hierarchically                   composites and also organic redox mediators (riboflavin, anthraqui-
porous carbons at low pH (∼1). As a result of fluorine doping, the                 none derivatives and riboflavinyl–anthraquinone 2-carboxylate
electronic properties of porous carbon was tuned to facilitate the                ester).16,17 The Co–C composite was successfully demonstrated in a
desorption of the HOO* radical intermediate.7 Other recent reports                H2/O2 PEM fuel cell with simultaneous production of electric power
of electrocatalysts for the electroreduction of oxygen to hydrogen                and H2O2 at neutral pH.18 Furthermore, a number of different
peroxide include highly ordered mesoporous nitrogen-doped                         bifunctional cathode structures were examined to optimize the H2O2
carbon8,9 and hierarchically-structured porous carbons.10 On the                  production and power output.19 Although in the H2O2 fuel cell mode
application side, Drogui and co-workers have used a RuO2-coated                   only the Co–C composite can operate, both Co–C and the organic-
                                                                                  based redox mediator catalysts are functional in a PEM electrolyzer.
                                                                                      The work presented here is part of a large research initiative, the
  *Electrochemical Society Member.                                                REAS’EAU WaterNet Program, a federally funded research pro-
  z
    E-mail: egyenge@chbe.ubc.ca; dwilkinson@chbe.ubc.ca                           gram aimed at studying drinking water issues currently affecting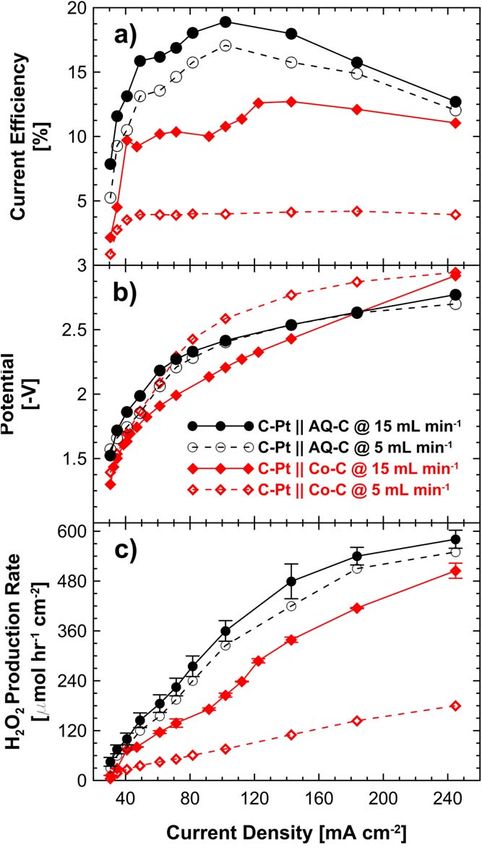
Journal of The Electrochemical Society, 2020 167 044502

small rural communities across Canada. The intent has been to                     NR-112, Dupont Nafion® Products) with a catalyst loading of
develop cost-effective portable water treatment using H2O2/UV                     0.4 mgPt-black cm−2 (identified as a half-CCM). Figure 1 shows the
advanced oxidation and producing the hydrogen peroxide on-site                    schematic diagram of anode types I and II. The Ti-mesh was chosen
and on-demand for small communities. Based on 500 liters of water                 because of its superior corrosion resistance at higher potentials with
required per day for each resident in a community of 500 residents,               respect to the carbon support.
the H2O2/UV treatment unit would require 10 ppm (or 0.3 mM) of                       The half-CCM was prepared by first drying a cleaned protonated
H2O2 in order to provide sufficient treatment for 250,000 liters of                Nafion 112 membrane using a hotpress (Dake Model 44226) at
water supplied at a flow rate of 100–300 l min−1. Both the inorganic               135 °C for two minutes. After cooling, the dried membrane was
(cobalt-carbon composite) and the organic redox catalyst (anthra-                 secured on a hotplate (at 70 °C) using a vacuum table and Pt black
quinone-riboflavinyl) were evaluated using a PEM electrolyzer with                 anode catalyst inks were then sprayed on the membrane using a spray
49 cm2 geometric electrode area. Specifically, cell polarization and               gun. Catalyst loading was determined by weighing the membrane
also steady-state long-term experiments were performed to study the               before and after the spraying. Membrane electrode assemblies
impact of cathode water flow rate, temperature, and cathode catalyst               (MEA), were produced by hot pressing (Dake Model 44226) a
and anode configuration on the production and stability of hydrogen                sandwich of membrane with the catalyst coated GDEs at 135 °C and
peroxide. To the best of the knowledge of the authors, this is the first           7584 kPa for a period of 2.5 min.
report on the use of an organic redox catalyst for hydrogen peroxide
production in a PEM electrolyzer and, moreover, the first compar-                      Electrolysis cell hardware and testing equipment.—A commer-
ison with an inorganic composite catalyst.                                        cially-available fuel cell hardware with an active area of 49 cm2
                                                                                  (TP50, Tandem Technologies Ltd.) was modified in-house and was
                                                                                  used for all the electrolysis experiments. Six K-type thermocouples
                        Experimental Methods
                                                                                  (Omega Engineering Canada) were inserted into the cell hardware
    Cathode and anode electrode preparation.—The cathode cata-                    through the bottom endplate to the test station, and were used to
lyst synthesis methods for the inorganic Co–C composite and the                   monitor the temperature of the cooling water loop, the anode and
organic 10 wt% anthraquinone-riboflavinyl on carbon (AQ–C)                         cathode streams (both inlet and outlet), and the cell temperature. This
catalysts were previously reported by our group.16,17 The catalyst                hardware enabled us to readily replace the cell components without
inks were prepared by mixing pre-weighed amounts of Co–C (or                      any disruption of the input feed. A standard single pass serpentine
AQ–C) powders with deionized (DI) water (18.2 MΩ cm, Barnstead                    flow field design was used for both the anode and the cathode flow
E-Pure System, Thermo-Fisher), 10 wt% Nafion solution (Sigma-                      field plates, and the assembled plates were in a cross-flow config-
Aldrich), and 2-propanol (Fischer-Scientific), then sonicating the                 uration. The cathode plate used was the original graphite plate
mixture for 60 min. The catalyst inks were sprayed by a hand-held                 provided by Tandem Technologies. The anode plate was, however,
spray gun pressurized with compressed air (Mastercraft HVLP Air                   machined in-house from brass (McMaster Carr Supply Company)
Spray Gun Set, Canadian Tire) onto a gas diffusion layer (GDL)                    and was coated with 4 μm nickel and 1 μm gold (ACME Plating and
(TGPH-060 Toray paper with 10 wt% teflon, Fuel Cell Earth LLC),                    Silver Shop Ltd., Vancouver, Canada) in order to provide adequate
while maintaining the temperature at about 80 °C using a hotplate                 corrosion resistance at the high electrolysis potentials.
(Corning PC-620D, Cole-Parmer Canada Company). Similar                                Sealing of the MEA between the flow field plates was achieved
cathode loadings of about 3.6 mg cm−2 were used for both catalysts.               with Silicone JRTV gaskets (Dow Corning Corporation). Figure S1
    Two types of anode configurations were investigated using Pt                   and Table SI (available online at stacks.iop.org/JES/167/044502/
black catalyst (Platinum black standard, Johnson Matthey                          mmedia) show the cell hardware and details of the cell components
Company): i) (Type I) Pt-black catalyst ink sprayed onto TGP-                     used (see the Supplementary Electronic Information). Figure 2 shows
H060 unteflonated Toray carbon paper with a catalyst loading of                    the schematics of the experimental setup used for the experiments
0.2 mgPt cm−2, and ii) (Type II) Pt-black catalyst ink sprayed on one             reported here. A 2-kW fuel cell test station (G100 Test Station with
side of a polymer exchange membrane (Nafion® PFSA membrane                         HYWARE II software, Green Light Innovation) was used to control

Figure 1. Comparison of MEA configurations with two anode types using Ti mesh. (a) Type I: Pt-black catalyst ink sprayed onto TGP-H060 unteflonated Toray
carbon paper with a catalyst loading of 0.2 mgPt cm−2 and (b) Type II: Pt catalyst layer sprayed on the anode side of the membrane (half-CCM) and brought into
contact with the Ti-mesh.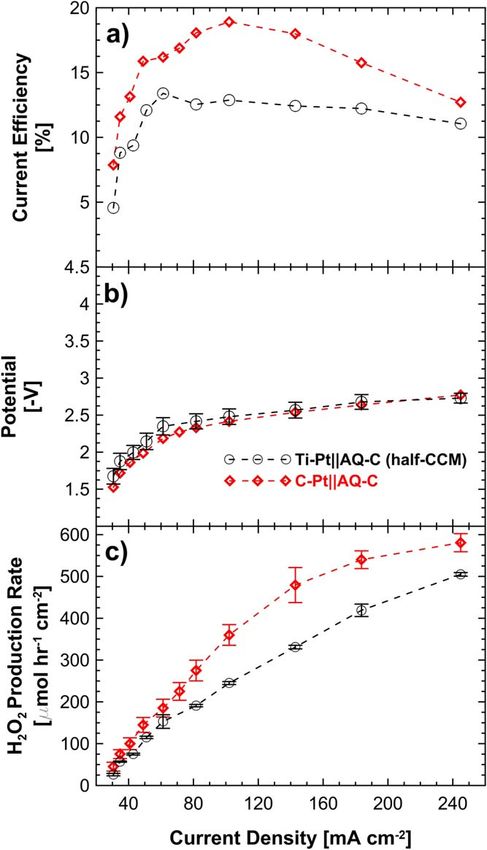
Journal of The Electrochemical Society, 2020 167 044502

Figure 2. Process flow diagram of the experimental setup for hydrogen peroxide production in a PEM electrolyzer.

the flows of cathode gas and coolant loop to the electrolysis cell. The        carrier flow rate fixed at 15 ml min−1. The anode water was not
carrier water feed (neutral DI water) to the cathode was controlled by a      recycled during the experiments and was operated in a single pass
peristaltic pump (model 7553–80, Masterflex). The water flow rate in            mode with a fixed flow rate of 15 ml min−1. The recycle experiments
the anode compartment was 15 ml min−1 and was provided by a                   were conducted up to 72 h of continuous operation with samples
similar peristaltic pump. An external power supply (Xantrex XHR               taken periodically for analysis.
20–50, AMETEK Programmable Power, Inc.) was used to provide the
required electrical power for the electrolysis experiments.                       Chemical analysis.—Both the anode and the cathode outlet water
                                                                              streams were sampled. On the anode side the outlet water sample
    MEA conditioning and polarization measurements.—During                    was tested for trace metal ions from possible anode corrosion. On the
the electrolysis experiments the modified TP50 cell was compressed             cathode side, samples were analyzed for H2O2 concentration, as well
to a pressure of 827 kPa. Table I presents the employed experimental          as trace metal ions.
conditions, controlled and monitored by the Greenlight test station.              Quantitative analysis of H2O2 concentration was performed by a
At the beginning of the experiments first the cathode and anode DI             modified tri-iodide/UV–VIS spectroscopy method described by
water streams were turned on, and then an initial current density             Klassen et al.20 This method is suitable for H2O2 concentrations of
(≈ 29 mA cm−2) was applied to initiate the MEA conditioning at                up to 10 ppm. Samples with greater H2O2 concentrations were
60 oC. The current density was slowly increased every 10–15 min up            diluted prior to analysis. All the measurements were carried out
to ≈ 143 mA cm−2, while monitoring the cell potential. The MEA                under neutral conditions. The UV–VIS measurements were con-
was conditioned at this higher current density for one hour.                  ducted with a UV–VIS spectrophotometer (UVmini-1240, Shimadzu
    All polarization measurements were carried out galvanostatically          Corp.) and were performed at least twice to ensure repeatability.
using eighteen different superficial current densities between 30 to           Errors were within ± 0.5%.
300 mA cm−2. Each polarization current density point was held for                 Inductively coupled plasma—optical emission spectrometry
two minutes, during which time the voltage was approximately                  (ICP-OES) measurements were performed using an Agilent 725
constant throughout, and its value was recorded at the end of the             ICP-OES, equipped with an auto-sampler and radial view. The
two-minute period.                                                            samples were prepared by mixing a 1 ml solution of the cathode (or
                                                                              anode) in a 2 % HNO3 solution to a final volume of 10 ml.
    Full recycle loop experiments.—The operating conditions for the
                                                                                                     Results and Discussion
long-term recycle tests were the same as those listed in Table I.
These experiments started with the cell operating in a single pass               The fundamental mechanisms for the two-electron O2 reduction
mode for 25 min with the cathode carrier water flow at 15 ml min−1             on either Co–C or the organic redox catalyst anthraquinone-
at a current density of 61 mA cm−2. Once sufficient product solution           riboflavynil (AQ–C) were discussed by us previously.16,17 Here
was accumulated in the collection reservoir in order to allow for             the focus is exclusively on the results obtained in the PEM
sampling, the recycle pump was turned on with the recycle cathode             electrolyzer.
Journal of The Electrochemical Society, 2020 167 044502
Figure 3. Impact of temperature on the electrolyzer performance for H2O2 production with (a)–(c) Co–C and (d)–(f) AQ–C cathode catalysts. (a), (d) current
efficiency for H2O2 production; (b), (e) electrolysis cell polarizations; and (c), (f) H2O2 production rates. Anode: DI water flow rate 15 ml min−1, catalyst loading
0.2 mgPt cm−2 on TGP-H060 with 0 wt% PTFE Toray paper (Type I). Cathode: O2 flow rate 1,000 ml min−1, pressure 150 kPa(g), DI water flow rate 15 ml
min−1, (a)–(c) Co–C catalyst loading 3.6 mgCo–C cm−2 on TGP-H060 10 wt% PTFE and (d)–(f) AQ–C catalyst loading 3.6 mgAQ–C cm−2 on TGP-H060 10 wt%
PTFE.
Table I. Standard operating conditions and the experimental variables investigated for the electrolytic generation of H2O2.
Operating Variable Value
PEM Electrolyzer Compression [kPa(g)] 827
Anode DI Water Flow Rate [ml min−1] 15
Cathode Relative Humidity [%] 100
Cathode Gas Flow [ml min−1 O2] 1000
Stoichiometric factor: 58.6 @ 100 mA cm−2
Cathode Pressure [kPa] 150
Operating Temperature [°C] 20 40 60 80
Cathode DI Water Flow Rate [ml min−1] 5 15Journal of The Electrochemical Society, 2020 167 044502
Figure 5. Comparison of the two anode types using AQ–C cathode catalyst
Figure 4. Effect of cathode water flow rate on the electrolyzer performance
at 40 °C. Type I: C-Pt, and Type II: Ti-Pt half-CCM. Cathode carrier water
at 40 °C for H2O2 production, and comparison between Co–C and AQ–C
flow rate 15 ml min−1, O2 flow rate 1,000 ml min−1, pressure 150 kPa(g),
cathode catalysts. Cathode carrier water flow rate 5 ml min−1 and 15 ml
AQ–C catalyst loading 3.6 mgAQ–C cm−2 on TGP-H060 (10 wt% PTFE).
min−1, respectively. Anode: DI water flow rate 15 ml min−1, catalyst loading
Anode water flow rate 15 ml min−1.
0.2 mgPt cm−2 on TGP-H060 (0 wt% PTFE) Toray paper (Type I anode).
Cathode: O2 flow rate 1,000 ml min−1, pressure 150 kPa(g). Cathode
catalyst: either AQ–C 3.6 mgAQ–C cm−2 on TGP-H060 (10 wt% PTFE) or
Co–C 3.6 mgCo–C cm−2 on TGP-H060 (10 wt% PTFE).
approximately 580 μmol hr−1 cm−2 (at 245 mA cm−2) exceeding by
about 21% the maximum production rate obtained using Co–C
(Figs. 3f and 3c). At 40 °C and 100 mA cm−2 the organic redox
Effect of temperature on H2O2 production.—Figure 3 shows the catalyst AQ–C generated a 19% current efficiency, whereas with
impact of temperature on current efficiency, cell potential, and H2O2 Co–C the current efficiency was only 10% (Figs. 3d and 3a).
production for the Co–C catalyst (a–c) and the AQ–C cathode However, the current efficiency on AQ–C decreases at current
catalysts (d–f), respectively. The type I anode (i.e., Pt/C) was used densities higher than 100 mA cm−2. This indicates that the rates of
in these experiments. With Co–C catalyst, at current densities the secondary reactions H2O2 reduction and H2 evolution become
⩽ 100 mA cm−2, the H2O2 production rate is almost identical for more significant. In terms of temperature, similar to the Co–C
all temperatures examined. As the current density increases above catalyst, 40 °C is optimal, favoring higher production rate while
100 mA cm−2, however, differences among the four temperatures keeping the H2O2 decomposition rate low.
studied appear (Fig. 3c). The highest H2O2 production rate is
obtained at 40 °C as well as a corresponding increase in current Effect of cathode carrier water flow rate on H2O2 production.—
efficiency (Figs. 3a and 3c). Further increase of the temperature to Figure 4 shows the results of experiments performed with both types
60 °C and 80 °C is not beneficial in terms of H2O2 production and of catalysts at 40 °C and water flow rates of 5 and 15 ml min−1,
current efficiency. At elevated operating temperatures the H2O2 respectively. In case of the AQ–C cathode catalyst, the cell
decomposition rate increases more significantly with current density. performance was similar for both cathode water flow rates. For
The AQ–C catalyst shows generally similar trends to the Co–C Co–C however, the higher water flow rate (i.e., shorter residence
with respect to the temperature effect (Figs. 3d–3f). At either 40 °C time) had a significant beneficial effect on all figures of merit: H2O2
or 60 °C the H2O2 production rate on AQ–C reaches a maximum of production rate, cell voltage and current efficiency. This mayJournal of The Electrochemical Society, 2020 167 044502
the interaction and bonding between the ionomer and the cathode
catalyst layer is superior in the case of the hot pressed MEA (i.e.,
with Type I anode), improving the cathode catalyst layer utilization
and, therefore, the H2O2 production rate. It should be also mentioned
that further reduction of the over cell potential can be achieved using
iridium oxide-based anodes. In the present work Pt-based anodes
were used for direct comparison of the same cell in either
electrolysis or fuel cell mode operation for peroxide generation.18,19
Full recycle operation mode.—The capability to produce H2O2
over a longer period of time is crucial to assess the applicability of
the proposed PEM electrolyzer approach for commercial operation.
In order to simulate on a laboratory scale such a scenario,
experiments with full recycle of the cathode product solution were
performed for 72 h. For the continuous recycle operation experi-
ments, the AQ–C (half CCM) cathode with the Ti mesh-based anode
configurations (Type II, Fig. 1) was employed to mitigate the carbon
corrosion on the anode side. (Fig. 6). Results show that the AQ–C
catalyst produced 3000 ppm (0.3 wt %) of H2O2 by the end of the
72-hour experiment (Fig. 6b). The H2O2 production rate peaked after
approximately 20 h (Fig. 6a). Beyond 20 h the production rate
decreased and the net accumulated H2O2 concentration virtually
levelled off (Fig. 6b). This is due to the competition between H2O2
generation and losses through pathways such as secondary electro-
reduction, and thermocatalytic decomposition (see next section).
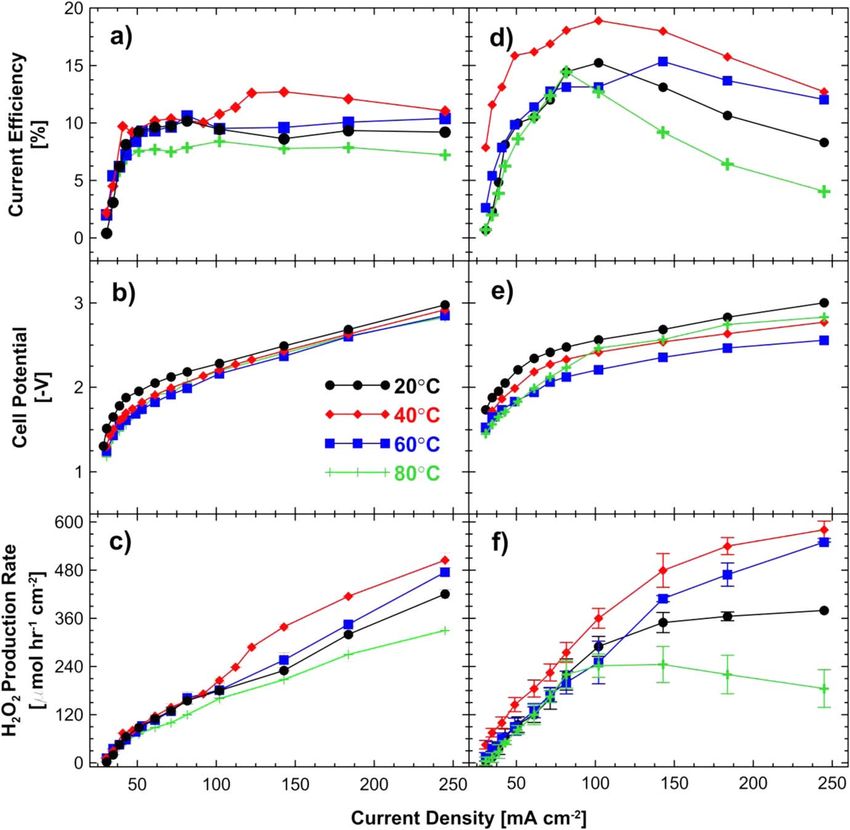
Effect of catalyst and temperature on H2O2 degradation.—The
H2O2 stability was investigated at three different temperatures (40,
60, 80 °C) using a fully assembled electrolysis cell consisting of
AQ–C cathode catalyst and a half-CCM Pt anode with a Ti mesh
current collector. The goal was to determine the H2O2 loss under
open circuit conditions due to thermocatalytic (i.e., non-electroche-
mical) degradation. Figures 7a and 7b show clear evidence for
thermal decomposition of H2O2 with higher temperatures leading to
increased decomposition of H2O2. Figures 7c and 7d display the data
on a semi logarithmic plot, where dashed lines show the linear
regression. Clearly, full recycle operation of the electrolyzer at 80 °C
for over two hours is not beneficial. Furthermore, the presence of O2
gas enhanced the H2O2 decomposition in a positive synergistic
interaction effect with temperature (i.e., the higher the temperature
the higher was the interaction effect between gas presence and
temperature regarding H2O2 decomposition, compare Figs. 7c and
Figure 6. Continuous recycle operation (for up to 72 h) of the PEM 7d, 80 °C data). Similar behavior was reported before as well.18
electrolyzer for H2O2 production. AQ–C cathode catalyst with Pt on Ti-mesh In addition, the membrane degradation was also evaluated by
anode. (a) H2O2 production rate, (b) total accumulated H2O2 concentration analyzing the fluoride released. The median fluoride release rate was
and (c) cell voltage. Current density 61 mA cm−2, temperature 40 °C and rest ∼0.03 ng hr−1 cm−2 for the sixteen samples analyzed. Drinking
of the conditions identical to Fig. 5. water guidelines from the Government of B.C. in Canada suggests a
fluoride limit of 1.0–1.5 mg l−1.21 The long-term recycle experi-
ments showed the cumulative fluoride concentration over the three
indicate that Co–C is catalytically more active for the secondary
day runs was well below the limit set out by the guidelines, at about
reactions of H2O2 electroreduction and/or thermocatalytic decom-
2.2 μg l−1.
position of H2O2. Therefore, a shorter residence time is beneficial.
Conclusions
Effect of the anode configuration.—The durability of the PEM
electrolyzer for H2O2 production can be compromised by carbon The electroreduction of O2 to H2O2 was investigated in a PEM
corrosion at the anode (i.e., carbon paper GDL, Type I anode, electrolyzer under near-neutral pH operation using deionized water.
Fig. 1). To address this issue an anode configuration composed of Pt Two novel cathode catalysts, a cobalt-carbon composite (Co–C) and
catalyst coated half-membrane (half-CCM) was also used in con- an organic redox catalyst, anthraquinone-riboflavinyl supported on
junction with Ti mesh (Type II anode, Fig. 1). Figure 5 shows a carbon (AQ–C), were investigated. Using a superficial current
comparison of the two anode types tested: Ti-CCM and C-Pt anodes density of 245 mA cm−2 and an operating temperature of 40 °C,
with AQ–C cathode catalyst. The cell potential using the half-CCM H2O2 molar fluxes of 360 μmol hr−1 cm−2 and 580 μmol hr−1 cm−2
anode with Ti mesh is similar to that of the carbon paper GDL-Pt were obtained in single pass mode with the Co–C and RF-AQ
anode (Fig. 6b), however, the H2O2 production is lower (Fig. 6c). catalysts, respectively. To the best of our knowledge, this is the first
The reason for lower H2O2 production with Type II anode could be time that H2O2 production in a PEM electrolyzer with an organic
attributed to the different preparation of the MEAs. The MEA with redox catalyst has been reported.
the Type I anode (i.e., containing the carbon paper GDL) was Longer term (72 h) experiments conducted at a constant super-
prepared using a hot press method, whereas the MEA with a half- ficial current density of 61 mA cm−2 with complete recycle of the
CCM and Ti mesh anode (Type II) was not hot pressed. Therefore, cathode carrier water solution, showed a maximum steady-stateJournal of The Electrochemical Society, 2020 167 044502
Figure 7. H2O2 stability in the electrolysis cell at open circuit as a function of temperature and oxygen gas flow. (a), (c) no oxygen gas; (b), (d) with oxygen gas
flow. Cathode catalyst: AQ–C 3.6 mgAQ–C cm−2 on TGP-H060 (10 wt% PTFE). Continuous recycle of the cathode water carrier flow at 15 ml min−1. O2 flow
rate 1,000 ml min−1, pressure 150 kPa(g). Anode conditions: water flow 15 ml min−1, Ti-Pt anode.
H2O2 concentration of 3000 ppm for the AQ–C catalyst. The 9. T. P. Fellinger, F. Hasché, P. Strasser, and M. Antonietti, “Mesoporous nitrogen-
electrolytic production of H2O2 using the AQ–C composite catalyst doped carbon for the electrocatalytic synthesis of hydrogen peroxide.” J. Am. Chem.
Soc., 134, 4072 (2012).
in a PEM electrolyzer can provide an adequate supply of H2O2 for 10. Y. Liu, X. Quan, X. Fan, H. Wang, and S. Chen, “High-yield electrosynthesis of
advanced oxidation drinking water treatment applications on-site hydrogen peroxide from oxygen reduction by hierarchically porous carbon.”
and on-demand. Angew. Chemie—Int. Ed., 54, 6837 (2015).
11. P. Drogui, S. Elmaleh, M. Rumeau, C. Bernard, and A. Rambaud, “Hydrogen
Acknowledgments peroxide production by water electrolysis: application to disinfection.” J. Appl.
Electrochem., 31, 877 (2001).
Funding for this work has been provided by the Natural Sciences 12. C. Ridruejo, F. Alcaide, G. Álvarez, E. Brillas, and I. Sirés, “On-site H2O2
electrogeneration at a CoS2-based air-diffusion cathode for the electrochemical
and Engineering Research Council of Canada (NSERC) through the degradation of organic pollutants.” J. Electroanal. Chem., 808, 364 (2018).
Strategic Res’Eau WaterNet program and the NSERC Discovery 13. A. Verdaguer-Casadevall, D. Deiana, M. Karamad, S. Siahrostami, P. Malacrida,
Grant program. T. W. Hansen, J. Rossmeisl, I. Chorkendorff, and I. E. L. Stephens, “Trends in the
electrochemical synthesis of H2O2: enhancing activity and selectivity by electro-
References catalytic site engineering.” Nano Lett., 14, 1603 (2014).
14. S. Siahrostami et al., “Enabling direct H2O2 production through rational electro-
1. https://transparencymarketresearch.com/pressrelease/hydrogen-peroxide-market. catalyst design.” Nat. Mater., 12, 1137 (2013).
htm (accessed February 2, 2020). 15. V. Viswanathan, H. A. Hansen, and J. K. Nørskov, “Selective electrochemical
2. J. M. Campos-Martin, G. Blanco-Brieva, and J. L. G. Fierro, “Hydrogen peroxide generation of hydrogen peroxide from water oxidation.” J. Phys. Chem. Lett., 6,
synthesis: an outlook beyond the anthraquinone process.” Angew. Chemie—Int. Ed., 4224 (2015).
45, 6962 (2006). 16. A. Bonakdarpour, D. Esau, H. Cheng, A. Wang, E. Gyenge, and D. P. Wilkinson,
3. C. W. Oloman, in Electrochemical Processing for the Pulp & Paper Industry (The “Preparation and electrochemical studies of metal-carbon composite catalysts for
Electrochemical Consultancy, New York) (1996). small-scale electrosynthesis of H2O2.” Electrochim. Acta, 56, 9074 (2011).
4. I. Yamanaka, S. Tazawa, T. Murayama, T. Iwasaki, and S. Takenaka, “Catalytic 17. A. Wang, A. Bonakdarpour, D. P. Wilkinson, and E. Gyenge, “Novel organic redox
synthesis of neutral hydrogen peroxide at a CoN2Cx cathode of a polymer catalyst for the electroreduction of oxygen to hydrogen peroxide.” Electrochim.
electrolyte membrane fuel cell (PEMFC).” Chem. Sus. Chem., 3, 59 (2010). Acta, 66, 222 (2012).
5. W. Zhang, A. U. Shaikh, E. Y. Tsui, and T. M. Swager, “Cobalt porphyrin 18. W. Li, A. Bonakdarpour, E. Gyenge, and D. P. Wilkinson, “Drinking water
functionalized carbon nanotubes for oxygen reduction.” Chem. Mater., 21, 3234 (2009). purification by electrosynthesis of hydrogen peroxide in a power-producing PEM
6. H. J. Zhang, X. Yuan, W. Wen, D. Y. Zhang, L. Sun, Q. Z. Jiang, and Z. F. Ma, fuel cell.” Chem. Sus. Chem., 6, 2137 (2013).
“Electrochemical performance of a novel CoTETA/C catalyst for the oxygen 19. W. Li, A. Bonakdarpour, E. Gyenge, and D. P. Wilkinson, “Design of bifunctional
reduction reaction.” Electrochem. Commun., 11, 206 (2009). electrodes for co-generation of electrical power and hydrogen peroxide.” J. Appl.
7. K. Zhao, Y. Su, X. Quan, Y. Liu, S. Chen, and H. Yu, “Enhanced H2O2 production Electrochem., 48, 985 (2018).
by selective electrochemical reduction of O2on fluorine-doped hierarchically 20. N. V. Klassen, D. Marchington, and H. C. E. McGowan, “H2O2 Determination by
porous carbon.” J. Catal., 357, 118 (2018). the I3− method and by KMnO4 titration.” Anal. Chem., 66, 2921 (1994).
8. J. Park, Y. Nabae, T. Hayakawa, and M. A. Kakimoto, “Highly selective two- 21. BC Ministry of Environment and Climate Change Strategy, “B.C. Source Drinking
electron oxygen reduction catalyzed by mesoporous nitrogen-doped carbon.” ACS Water Quality Guidelines: Guideline Summary.” Water Quality Guideline Series
Catal., 4, 3749 (2014). WQG-01 (2017).You can also read