ANGLO AMERICAN PLATINUM - 2020 Interim Results Presentation BUILDING THE BUSINESS FOR THE FUTURE, BEYOND CURRENT HEADWINDS
←
→
Page content transcription
If your browser does not render page correctly, please read the page content below
ANGLO AMERICAN PLATINUM
2020 Interim Results Presentation

 BUILDING THE BUSINESS FOR THE FUTURE, BEYOND CURRENT HEADWINDS
CAUTIONARY STATEMENT
 Disclaimer: This presentation has been prepared by Anglo American              Anglo American Platinum’s actual results, performance or                   from publicly available third party sources.
 Platinum Limited (“Anglo American Platinum”) and comprises the                 achievements to differ materially from those in the forward-looking        As such it presents the views of those third parties, but may not
 written materials/slides for a presentation concerning Anglo American          statements include, among others, levels of actual production during       necessarily correspond to the views held by Anglo American
 Platinum.                                                                      any period, levels of global demand and commodity market prices,           Platinum.
 By attending this presentation and/or reviewing the slides you agree           mineral resource exploration and development capabilities, recovery
 to be bound by the following conditions.                                       rates and other operational capabilities, the availability of mining and
                                                                                processing equipment, the ability to produce and transport products
 This presentation is for information purposes only and does not                profitably, the impact of foreign currency exchange rates on market        No Investment Advice
 constitute an offer to sell or the solicitation of an offer to buy shares in   prices and operating costs, the availability of sufficient credit, the
 Anglo American Platinum. Further, it does not constitute a                     effects of inflation, political uncertainty and economic conditions in     This presentation has been prepared without reference to your
 recommendation by Anglo American Platinum or any other party to                relevant areas of the world, the actions of competitors, activities by     particular investment objectives, financial situation, taxation position
 sell or buy shares in Anglo American Platinum or any other                     governmental authorities such as changes in taxation or safety,            and particular needs. It is important that you view this presentation in
 securities. All written or oral forward-looking statements attributable        health, environmental or other types of regulations in the countries       its entirety. If you are in any doubt in relation to these matters, you
 to Anglo American Platinum or persons acting on their behalf are               where Anglo American Platinum operates, conflicts over land and            should consult your stockbroker, bank manager, solicitor, accountant,
 qualified in their entirety by these cautionary statements.                    resource ownership rights and such other risk factors identified in        taxation adviser or other independent financial adviser (where
                                                                                Anglo American Platinum’s most recent Integrated Report.                   applicable, as authorised in South Africa, under the Financial
                                                                                                                                                           Advisory and Intermediary Services Act 37
                                                                                Forward-looking statements should, therefore, be construed in light of     of 2002).
 Forward-Looking Statements                                                     such risk factors and undue reliance should not be placed on
                                                                                forward-looking statements. These forward-looking statements speak
 This presentation includes forward-looking statements.                         only as of the date of this presentation.
 All statements, other than statements of historical facts included in                                                                                     Alternative performance measures
 this presentation, including, without limitation, those regarding Anglo
 American Platinum’s financial position, business, acquisition and              Anglo American Platinum expressly disclaims any obligation or              Throughout this presentation a range of financial and non-financial
 divestment strategy, plans and objectives of management for future             undertaking (except as required by applicable law, the Listings            measures are used to assess our performance, including a number
 operations (including development plans and objectives relating to             Requirements of the securities exchange of the JSE Limited in South        of the financial measures that are not defined under international
 Anglo American Platinum’s products, production forecasts and,                  Africa and any other applicable regulations) to release publicly any       financial reporting standards (IFRS), which are termed ‘alternative
 reserve and resource positions), are forward-looking statements. By            updates or revisions to any forward-looking statement contained            performance measures’ (APMs). Management uses these measures
 their nature, such forward-looking statements involve known and                herein to reflect any change in Anglo American Platinum’s                  to monitor Anglo American Platinum’s financial performance
 unknown risks, uncertainties and other factors which may cause the             expectations with regard thereto or any change in events, conditions       alongside IFRS measures because they help illustrate the underlying
 actual results, performance or achievements of Anglo American                  or circumstances on which any such statement is based.                     financial performance and position of Anglo American Platinum.
 Platinum, or industry results, to be materially different from any future                                                                                 These APMs should be considered in addition to, and not as a
 results, performance or achievements expressed or implied by such              Nothing in this presentation should be interpreted to mean that future     substitute for, or as superior to, measures of financial performance,
 forward-looking statements.                                                    earnings per share of Anglo American Platinum will necessarily             financial position or cash flows reported in accordance with IFRS.
                                                                                match or exceed its historical published earnings per share.               APMs are not uniformly defined by all companies, including those in
 Such forward-looking statements are based on numerous                                                                                                     Anglo American Platinum’s industry. Accordingly, it may not be
 assumptions regarding Anglo American Platinum’s present and future                                                                                        comparable with similarly titled measures and disclosures by other
 business strategies and the environment in which Anglo American                Certain statistical and other information about                            companies.
 Platinum will operate in the future. Important factors that could cause        Anglo American Platinum included in this presentation is sourced

                                                                                                    Interim Results July 2020                                                                                                         2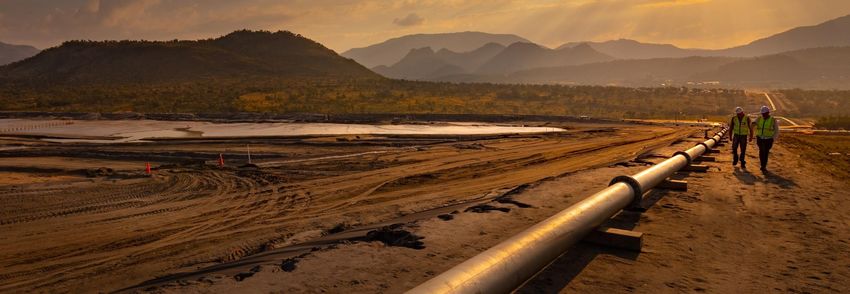
2020 INTERIM RESULTS AGENDA

.   Supporting stakeholders                                             Natascha Viljoen

    Operational performance                                             Natascha Viljoen

.   Financials                                                            Craig Miller

.   PGM market review                                                   Natascha Viljoen

1 Positioning the business for the future                               Natascha Viljoen

.   Outlook and guidance                                                Natascha Viljoen

                                            Interim Results July 2020                      3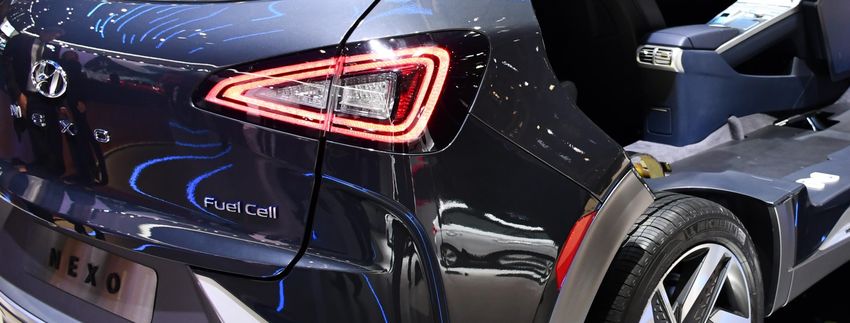
RESILIENT BUSINESS DESPITE HEADWINDS
Safety performance           Health and well-being                       Community support - Covid-19

  Fatalities                   Protecting livelihoods                      Investment in communities

  zero                         R1.2bn                                      R55m
  at managed operations        in unproductive labour costs to
                               support employees

Robust PGM fundamentals      Strong balance sheet                        Industry leading returns

  USD basket price up          Net cash position                           H1 2020 dividend

  56%                          R11.3bn                                     R2.8bn
  rand basket price up 80%     after paying R11.1 billion in dividends     R10.23 per share
  per PGM ounce sold

                                          Interim Results July 2020                                     4
SUPPORTING STAKEHOLDERS

                      5
ELIMINATION OF FATALITIES REMAINS THE FOCUS
Fatalities & total recordable case injury frequency rate (TRCFR)(1)
                                                                                                 Fatalities in H1 2020
9                                                                                          5

8
                 4.52                                                                      4.5
                                                                                                 zero
                                                                                                 at own managed operations
7

                                                                                           4
             6
6
                                                                                                 Fatality free days
                                                                                           3.5
5

4                                      3.00                                                3
                                                                                                 620
                                                                                                 at own managed operations since
                                                                                                 19 October 2018
3
                                                            2.50                           2.5
                                   2                                            2.24
2
                                                                                                 Improved safety indicators
                                                                                           2

                                                                                                 2.24
1
                                                        zero                      zero
0                                                                                          1.5
            2017                  2018                  2019                     H1 2020         TRCFR(1) down 50% since 2017

                                                            Interim Results July 2020                                              6
DEVELOPING OUR COVID-19 RESPONSE

                SUPPORT WHERE IT IS NEEDED MOST

            Prevent                       Respond                      Recover

          Operating protocols        Employee and                 Safe and healthy
                                   community support                 operations
        Physical & mental health
                                     Workforce &                Education, healthcare
                                   community testing              and livelihoods

                                    Interim Results July 2020                           7
SUPPORTING COMMUNITIES THROUGH COVID-19

24,000                     100,000              77                           53,000            4.6m
food parcels delivered     face masks donated   clinics supported            provided access   reach – through
                                                                             to water          education awareness
                                                                                               campaigns

                         Commitment to reshaping relationships with
                                       communities
                                                 Interim Results July 2020                                           8
OPERATIONAL PERFORMANCE

                      9
CHALLENGING H1 | COVID-19 & ACP HEADWINDS
Operational performance             H1 2020 production                    Lost PGM production

  PGM production decreased            Impacted by                           Due to Covid-19

  25%                                 Covid-19                              ~585,000

Refined production (2)              H1 2020 refined production            All-in-sustaining cost (3)

  PGM production decreased            Impacted by                           AISC per platinum ounce sold

  49%                                 ACP repairs                           $(480)
  Including tolling decreased 46%                                           against a realised platinum price of $857

                                              Interim Results July 2020                                                 10
MOGALAKWENA | OPERATING AT 100%
Total PGM Production (’000 ounces) Impact of COVID-19 (‘000 ounces)
PGM production decrease
8%
8%
610 impact from COVID-19
560 COVID-19
70 losses
63
303
Production level
278
281
258 100%
at the end of June
307
258 239
282 All-in-sustaining cost
$(594)
H1 2019 H1 2020 H1 2019 H1 2020 per platinum ounce sold
Platinum Palladium Other PGMs & Gold Q1 Q2 Covid-19 losses
Interim Results July 2020 11AMANDELBULT | OPERATING AT 50%, RAMP UP TO 85%
Total PGM Production (’000 ounces) 2020 Ramp-up schedule (% vs 2019)
PGM production decrease
422
48%
85%
48%
impact from COVID-19
75%
108
COVID-19
Production level
losses
50%
99
50%
56 at the end of June, increasing to 85%
by the end of 2020
51
215 218
All-in-sustaining cost
111
$(176)
H1 2019 H1 2020 June 2020 Q3 2020 Q4 2020 per platinum ounce sold
Platinum Palladium Other PGMs & Gold
Interim Results July 2020 12MOTOTOLO | OPERATING AT 90%
Total PGM Production (’000 ounces) Impact of COVID-19 (‘000 ounces)
PGM production decrease
107
24%
24%
impact from COVID-19
27
82
COVID-19 Production level
losses
21
30
50
20
90%
23 at the end of June, increasing to
100% in July
50 61 All-in-sustaining cost
58
38
$(320)
H1 2019 H1 2020 H1 2019 H1 2020 per platinum ounce sold
Platinum Palladium Other PGMs & Gold Q1 Q2 Covid-19 losses
Interim Results July 2020 13UNKI | OPERATING AT 100%
Total PGM Production (’000 ounces) Impact of COVID-19 (‘000 ounces)
PGM production decrease
16%
16%
impact from COVID-19
96
COVID-19
16 80 losses
Production level
13
53
38
31
100%
32 at the end of June
42 43
49 All-in-sustaining cost
36
$525
H1 2019 H1 2020 H1 2019 H1 2020 per platinum ounce sold
Platinum Palladium Other PGMs & Gold Q1 Q2 Covid-19 losses
Interim Results July 2020 14ACP PHASE B UNIT REPAIRS & SAFE RAMP-UP COMPLETE
Cross section of the Anglo American Platinum Converter Plant
Increased
monitoring
High pressure coolers freeboard section
(ACP Phase B water leak)
No
Increased
Coal dust explosion during lance ignition
(ACP Phase A explosion) measurement uncontrolled
events
Low pressure ‘waffle’ coolers
(ACP Phase B water leak) Greater
automation
Interim Results July 2020 15REFINED PRODUCTION IMPACTED BY ACP REPAIRS
Build up in WIP inventories (3E ounces) Refined PGM production (PGM ounces) Work-in-progress build at H1
c.500,000 oz
of 3E metal inventory
(800)
Build due
1,300 1,450 to power
disruptions
and ACP
c.500 Refined production(2) decrease
repairs
950
75 Build up in
2,004
49%
WIP from 2019 Including tolling down 46%
875 1,019
Sales volumes decrease
38%
H1 WIP
Opening WIP
M&C
Refined
H1 2019 H1 2020 due to lower refined production, supplemented
by drawdown in refined inventory
Interim Results July 2020 16FINANCIALS
FINANCIAL PERFORMANCE
     Headline earnings per share   EBITDA                              Headline earnings
              (R/share)

      28.15
                         26.27
                                    R13.1bn                              R6.9bn
                                     up 6%

                                   ROCE (%)                            Net cash

                                    48%                                  R11.3bn
                                    up from 45%

     H1 2019            H1 2020           R2.8bn                 dividend declared for H1 2020

                                     Interim Results July 2020                                   18
EBITDA IMPACTED BY OPERATIONAL HEADWINDS
EBITDA (R billion) H1 2020 vs. H1 2019
2.6 (0.9)
23.7 (11.2)
9.6
3.5
3.5
Pd
6.0 Rh
108
0.6
2.0 13.1
12.4
0.1 Other Covid-19 (0.3)
costs
Non-productive labour (1.2)
H1 2019 Price Currency Inflation + Operational Costs H1 2020
Royalties headwinds
Interim Results July 2020 19UNIT COST IMPACTED BY LOWER PRODUCTION
Unit cost per PGM ounce produced (Rand per PGM ounce) Cost savings
+16%
R2.0bn
1,057 12,555
2,008
11,498
(1,024)
All-in sustaining unit cost
$(480)
563
9,951
per platinum ounce sold against an achieved price of
$857
2020 unit cost guidance per PGM ounce
R11,800 - R12,200
H1 2019 CPI/Fx Lower Costs Non- H1 2020 H2 guidance: R11,500- R12,000
production productive
labour
~Fx movement relates to Unki cost
Interim Results July 2020 20WORKING CAPITAL IMPACTED BY WORK IN PROGRESS BUILD
Working capital movement (R billion) Working capital days
2.1
8.6
(0.5) 47 Days
WIP balance
(6.7)
6.6
R22.9bn
2019: R14.3bn
3.1
Customer prepayment
R16.1bn
Dec-19 Inventory Trade creditors Trade Customer H1 2020
2019: R9.4bn
Debtors prepayment
Interim Results July 2020 21CAPITAL GUIDANCE LOWERED BUT ASSET INTEGRITY MAINTAINED
Capital expenditure (Rand billion) SIB capital expenditure
5.7 – 6.5
1.6 – 2.0
R1.4bn
investment in SO2 abatement & Mogalakwena HME
Capitalised waste stripping
R1.4bn
2.1
0.3 1.9 4.1 – 4.5
0.4
FY 2020 Capex deferments
1.8
1.4
R1.0bn
H1 2019 H1 2020 2020 guidance
SIB Projects & Breakthrough (P101)
Interim Results July 2020 22CASH FLOW IMPACTED BY WORKING CAPITAL BUILD
Net cash (Rand billion) Cash utilised
R11.3bn R3.5bn
after a dividend payment of R11.1bn 17.3
Liquidity headroom
11.3
R16.6bn
excluding customer prepayment
6.0
H1 2020 dividend declared
H1 2019 2019 H1 2020
R2.8bn
R10.23 /share
Interim Results July 2020 23PGM MARKET REVIEW
PALLADIUM & RHODIUM PROPEL BASKET PRICE HIGHER
Indexed market prices log scale (2 Jan 2019 = 100)                                       USD basket price increase
800

                                                                                         56%
                                                                                         realised prices H1 2020 average
                                                                                         year-on-year
400

                                                                                         Rand weakened against USD

200
                                                                                         13%
100

                                                                                         Rand basket price increase

 50
  Jan 19        Apr 19        Jul 19        Oct 19          Jan 20            Apr 20
                                                                                         80%
                                                                                         realised prices H1 2020 average
                         Pt   Pd       Rh      ZAR basket        USD Basket              year-on-year

                                                             Interim Results July 2020                                     25
COVID IMPACTED AUTO SALES | BUT NOW RECOVERING
Global light duty automotive sales (million vehicles per month)(5) Automotive demand
8 Forecasts
Sales return to 2019 levels
65%
FY 2020 = down 14% yoy of gross 3E PGM demand
7 2019
6
Global LDV(4) sales down in H1
2020
5
4
Sale remain at current levels
FY 2020 = down 22% yoy 28%
H1 2019 year on year
3
2 2020 forecast LDV(4) sales decline
1
~14 – 22%
-
Jan Feb Mar Apr May Jun Jul Aug Sep Oct Nov Dec
Interim Results July 2020 26LONG-TERM AUTOMOTIVE PGM DEMAND ROBUST
Global light duty automotive production outlook (million vehicles)(6) ICE(7)-based vehicle output
increase
89 million 104 million
10 k
PGMs in powertrain
Pt
Fuel Cell Electric Vehicles 65 k 9%
9m between 2019 and 2027
2m
Hybrid Electric Vehicles
5m Pt Pd Rh (contain ICE, require PGM)
22 m 3E gross PGM auto demand
increasing
due to higher loadings as emissions legislation
tightens
67 m Pd Rh Gasoline 61 m
Fuel cell electric vehicle demand
long term
15 m Pt Diesel 12 m
positive
as market share increases and costs fall
2019 2020 2021 2022 2023 2024 2025 2026 2027
Interim Results July 2020 27OTHER DEMAND | POSITIVE STORY POST-COVID
Industrial demand Jewellery demand Investment demand
of gross of gross of gross
22% 3E PGM
demand
13% 3E PGM
demand
6% platinum
demand
2020 3E demand outlook 2020 3E demand outlook 2020 demand 3E outlook
resilient weak mixed
Medium-term 3E demand outlook Medium-term 3E demand outlook Medium-term 3E demand outlook
positive steady positive
• Many diversified and expanding • Lower global income after Covid • Product innovation and investor
end-uses education
Changing consumer preferences
• Quickening momentum behind • Palladium ETF outflows slowing
“hydrogen economy” • Growing middle class
Interim Results July 2020 283E METALS REMAIN IN FUNDAMENTAL DEFICIT
Market balance 2017- 2021 forecast (‘000 ounces)(8) 2020 palladium outlook
Pd
(208) deficit
(754) despite lower automotive demand
(950)
2020 platinum outlook
187 225
Pt
modest deficit
due to lower mine production
(265)
50
28 2020 rhodium outlook
Rh
(26) deficit
on rising loadings and lower production
2017 2018 2019 2020f 2021f
Interim Results July 2020 29POSITIONING THE BUSINESS FOR THE FUTURE
BUILDING BLOCKS IN PLACE
Operational efficiency                                                                                      Breakthrough technology

   Achieve and beat world best practice - P101                                       Development of FutureSmartTM technology innovation

   Deployment of FutureSmartTM technology & innovation                                                                  Bulk-ore sorting

   Digitalisation                                                                                               Coarse particle rejection

   Modernisation and mechanisation of Amandelbult                                                                           Dry-stacking
                                                          Environment,
                                                            Social &
Projects & growth options                                 Governance                                              Market development
                                                         and our People
   Fast payback projects                                                                           Developing new applications for PGMs
   Mogalakwena expansion options                                                                Growing demand – jewellery & investment
   Mototolo / Der Brochen life extension or expansion                                      Supporting development of hydrogen economy

                                    Delivering industry-leading returns for shareholders
                                        and a sustainable future for all stakeholders

                                                         Interim Results July 2020                                                          31
SHAPING THE FUTURE OF MOGALAKWENA
Optimise resource development Create trusting relationships
including underground opportunities and valued partnerships
Utilise downstream Shaping the Optimise mine plan and
processing to maximise value mine for operational performance
the future
Design and build the
Develop and deploy technology
concentrator of the future
Interim Results July 2020 32LEADING THE PLATINUM INDUSTRY’S DEMAND CREATION EFFORTS
INVESTMENT
JEWELLERY
INDUSTRIAL
Developing the world’s largest fuel-cell mining truck
‘Green hydrogen’ through Hydrogen powered
Mogalakwena solar PV plant electrolysis fuel-cell truck fleet
Green Electricity Hydrogen
Interim Results July 2020 33GUIDANCE & CONCLUSION
342020 GUIDANCE | COVID-19 HEADWINDS REMAIN
Production M&C (million ounces) Refined production (million ounces) Sales volumes (million ounces)
PGMs 3.1 – 3.6 PGMs 3.1 – 3.6 PGMs 3.1 – 3.6
Pt: 1.45 – 1.65 Pt: 1.45 – 1.65 Pt: 1.45 – 1.65
Pd: 1.00 – 1.15 Pd: 1.00 – 1.15 Pd: 1.00 – 1.15
Other: 0.65 – 0.90 Other: 0.65 – 0.90 Other: 0.65 – 0.90
Excluding toll production Excluding toll production Excluding toll production
Capital expenditure Capitalised waste stripping Unit cost per PGM ounce
R5.7– 6.5bn R2.4 – 2.6bn R11,800 - R12,200
Interim Results July 2020 35TO CONCLUDE…
✓ Resilient business through significant headwinds
✓ Zero fatalities and best ever safety performance
✓ ESG strategy supporting stakeholders during COVID-19 pandemic
✓ Clean air movement underpins robust fundamentals for PGMs
✓ Strong balance sheet – c.45% release of WIP in H2 2020
✓ Interim dividend declared – base dividend of 40% pay-out ratio
✓ Continuing to position the business for the future
…Stronger H2 expected but significant headwinds still exist
Interim Results July 2020 36APPENDIX
OPERATIONAL EFFICIENCY | BENCHMARK & BEYOND (P101)
Double benching at Mogalakwena               Rope shovel efficiency improvement           Modernisation at Amandelbult

 • From 2020 - pit slope design based         • Digitalisation improves control systems    • Tumela 15E mechanisation – narrow
   on double benching                                                                        reef technology
                                              • Improve drill accuracy and blasting
 • Moving from 30m to 60m stack height          fragmentation                              • Dishaba ramp-up
 • Digitalisation enhances slope stability    • Improved truck utilisation through         • Modernisation and digitalisation
   control                                      double side loading
                                                                                           • Cycle mining
 • Significant reduction in incremental       • Better truck positioning reduces shovel
                                                                                           • PGM recovery improvements
   strip ratio                                  hang time
                                                                                           • Asset reliability and maintenance
 • Reduces waste tonnes mined                 • Rope shovel bucket fill-factor
                                                                                             enhancements
                                                increased

                                                         Interim Results July 2020                                               38
BREAKTHROUGH | FUTURESMART MININGTM TECHNOLOGY
Bulk-ore sorter – trial underway Coarse particle rejection – Q1 2021 Hydraulic Dry Stacking – H2 2021
• Sensors determine ore content prior to • Trial plant to be built at Mogalakwena • New approach to eliminate wet tailings
processing allowing waste material to North Concentrator storage
be removed • Rejection of coarse gangue ahead of • Leverage CPR sands to accelerate
the primary flotation section dewatering at tailings facility
Benefits
Benefits
• Immediate grade testing Benefits
• Safety – desaturated tailings inherently
• Unlocks production capacity by • Unlocks downstream capacity for safe
rejecting waste early increased throughput • Water recycling expected to exceed
• Allows for lower cut off grades • Reduced energy consumption 85%
• Reduces mining cost & complexity • Reduced water consumption • Fast closure facilitating land re-
• Reduced operating cost purposing
Interim Results July 2020 39FAST PAYBACK PROJECTS - HIGH RETURN, HIGH MARGIN
Base Metal Refinery - copper debottlenecking Amandelbult modernisation
Copper plates at the Rustenburg Base Metal Refinery (RBMR) Winder upgrades increase hoisting capacity from 160ktpm to 230ktpm
Disciplined capital allocation framework drives project selection
Projects : Commission:
Modikwa chrome recovery plant R0.2bn +288ktpa H1 2021 ~2 year payback >50%IRR
RBMR copper debottlenecking R0.7bn -- H2 2021 ~2 year payback >35%IRR
Unki debottlenecking R0.7bn +31ktpm H2 2021 ~3 year payback >35%IRR
Amandelbult modernisation R1.3bn -- H1 2022 ~3 year payback >60%IRR
Tumela 15E R1.1bn +70ktpm H2 2022 ~5 year payback >20%IRR
Interim Results July 2020 40PROJECT STUDIES ON VALUE ACCRETIVE GROWTH OPTIONS
Mogalakwena expansion Der Brochen / Mototolo replacement and growth
• Feasibility project study on track to complete in 2021, assessing: • Replacement of Mototolo in feasibility - maintain current
‒ Construction of third concentrator with breakthrough technology production
‒ Upgrading and debottlenecking existing concentrators
• Requires establishment of Der Brochen South Shaft to replace
‒ Concurrently studying underground mining options Lebowa shaft
• Ramp up to fill third concentrator – 18 to 24 months • Shaft infrastructure designed such to allow future expansion
• Full production expected in 2024 • Expansion of Der Brochen / Mototolo project in pre-feasibility B
• Estimated ounces ~500,000 PGMs ‒ Breakthrough technology to increase throughput and improve grade into
the concentrator
‒ Potential to increase production by c.33%
Project studies for value-accretive growth underway
Project studies: Status
Der Brochen / Mototolo - replacement Replacement of Mototolo
Mogalakwena expansion Significant expansion potential - studies under way
Der Brochen / Mototolo – replacement & expansion Expansion potential - studies under way
Interim Results July 2020 41AUTOMOTIVE PGM DEMAND SUPPORTED BY HIGHER LOADINGS
PER VEHICLE
Historic and forecast 3E light duty PGM loadings(9) LDV gasoline loadings increase by
Light duty gasoline vehicles 4.83
Pt
3.35
4.29
40%
between 2015 and 2025 due to tighter
emissions legislation in China and Europe
Rh
2015 2020 2025
LDV diesel loadings increase by
Light duty diesel vehicles
6.41
Pt
5.77 5.93
10%
between 2015 and 2025 from already high
Pd levels
2015 2020 2025
Heavy duty diesel vehicles
5.95 Heavy duty diesel loadings
Pd 4.30 4.69 increase by
Rh
40%
2015 2020 2025 Between 2015 and 2025
Interim Results July 2020PLATINUM PHYSICAL INVESTMENT FIRM
Platinum bar and coin gross demand (‘000 ounces per quarter)(10) Platinum bar/coin demand
350
300
250 +300 koz
200
in Q1
150
100
50
- Total Platinum ETF liquidation
Q3 Q4 Q1 Q2 Q3 Q4 Q1 Q2 Q3 Q4 Q1 Q2 Q3 Q4 Q1 Q2 Q3 Q4 Q1 Q2 Q3 Q4 Q1
14 14 15 15 15 15 16 16 16 16 17 17 17 17 18 18 18 18 19 19 19 19 20
ETF holdings (million ounces)(11)
100 koz
withdrawn in H1 2020
Moz
4.0
3.0
Palladium ETF holding reduced to
2.0
1.0 510 koz
Platinum Palladium
0.0
2015 2015 2015 2016 2016 2016 2017 2017 2017 2018 2018 2018 2019 2019 2019 2020 2020
Interim Results July 2020 43CHINESE TRUCK DEMAND A PLATINUM GROWTH AREA
Forecast platinum demand in Chinese heavy-duty trucks (‘000 ounces)(12) All Chinese heavy-duty trucks sold by
300
2023
250 Will need platinum-based catalysts, with many manufacturers
already implementing standard
200
Platinum loadings per vehicle
150
~3x higher
by 2022 than 2019
100
50
Demand supported by tighter
emissions legislation
0
2020 2021 2022 2023
Interim Results July 2020 44OVERALL OUTLOOK FOR 3E PGM DEMAND FIRM
Short to medium term… …longer term
Substitution into Electrification
Commercial vehicle
gasoline Hydrogen economy through fuel cell
demand grows
autocatalysts vehicles
Platinum
Global
Jewellery demand Stricter emissions Industrial
‘middle class’
recovers legislation applications growing
increasing
Decarbonisation
Palladium & Stricter emissions Chemical demand
through hybrid New applications
Rhodium legislation growing
vehicles
Electronic Hydrogen Higher
Other PGMs Clean chemistry
demand increases generation technology future
Interim Results July 2020 453E PRIMARY SUPPLY DOWN C.21% IN 2020
3E Primary supply (’000 ounces)(13)
Current production outlook
expected recovery
between 2020 to 2030
13,859
Impact of Covid-19
increased uncertainty
Probable projects
replaces depleting
2019* 2020 2025 2030
Production Probable Projects Range of uncertainty supply
Interim Results July 2020 46EARNINGS SENSITIVITIES
Sensitivity analysis - 2020 Impact of 10% change in price/FX
Commodity / Currency 30 June spot Average realized EBITDA (Rm)
Platinum ($/oz) 815 857 504
Palladium ($/oz) 1 900 2 141 1 960
Rhodium ($/oz) 8 000 8 985 1 010
Gold ($/oz) 1 773 1 631 113
Nickel ($/ton) 12 642 13 145 93
Copper ($/ton) 5 953 5 573 38
Chrome ($/ton) 165 109 44
South African Rand 17.31 16.44 4 054
Interim Results July 2020 47DISCIPLINED AND VALUE FOCUSSED CAPITAL ALLOCATION
Capital allocation framework H1 2020 (Rbn)
• Free cash flow utilised of R3.5bn
5.5 • Customer prepayment increase of R6.7bn
• Other: R2.3bn
• Paid dividend of R11.1bn
• Base dividend R4.5bn
11.1 • Special dividend R6.6bn
• H1 dividend of R2.8bn declared
Discretionary capital options
• Low capex, fast payback projects
Portfolio upgrade
Future project Additional 0.4 • Funding growth/expansion studies
options shareholder returns
Interim Results July 2020 48NET CASH FLOW BY MINE
6.7
17.3 1.1
1.9
13.7
(2.9) (0.4) 11.3
(1.3)
(11.1)
(R3.5bn)
Investment in
100% Economic Cash tax and
Net cash Cash from SIB and Economic free Project Free associates, Customer Net cash June
Operation Operating free interest net interest Dividend
December 2019 operations waste capital cashflow(15) capital cash flow funding & prepayment 2020
cashflow adjustment(14) paid
other(16)
Mogalakwena 5 137 (2 114) 3 022 - 3 022) (159) 2 863)
Amandelbult 1 811 (203) 1 608 (33) 1 575) (135) 1 474)
Unki 183 (54) 129 - 129) (32) 97)
Mototolo 682 (199) 483 - 483) (48) 435) (522)
Joint Ventures 910 (142) 768 - 768) (55) 713)
3rd Parties (3 068) (85) (3 153) - (3 153) (17) (3 170)
Other(17) (4 603) (79) (4 683) (37) (4 720) (0) (1 286) (5 969) 2 443 6 716 (11 059) -
17 278 1 052 (2 877) (1 825) (71) (1 896) (446) (1 286) (3 557) 1 920 6 716 (11 059) 11 298
Interim Results July 2020 49COST BREAKDOWN
Costs reflective of AAP Own mined and Joint Venture share of production and costs at operations. Excludes all purchase of concentrate costs and volume, overhead and
marketing expenses.
H1 2020 COST BASE (RBN) VOLUME % PGMS (KOZ) LABOUR CONTRACTORS MATERIALS UTILITIES SUNDRIES
Opencast Mining 2.7 45% 560 18% 4% 44% 2% 32%
Conventional Mining 4.7 23% 290 61% 6% 14% 7% 12%
Mechanised Mining 4.4 32% 396 41% 7% 30% 6% 15%
Concentrating 2.9 18% 0% 35% 21% 26%
Processing 3.6 27% 2% 22% 24% 24%
Total 18.2 100% 1 246 34% 5% 30% 12% 20%
H1 2019 COST BASE (RBN) VOLUME % PGMS (KOZ) LABOUR CONTRACTORS MATERIALS UTILITIES SUNDRIES
Opencast Mining 2.4 36% 610 17% 5% 44% 2% 32%
Conventional Mining 5.1 31% 516 52% 7% 20% 6% 15%
Mechanised Mining 4.5 33% 547 43% 7% 33% 6% 15%
Concentrating 3.0 15% 0% 39% 20% 27%
Processing 3.7 25% 1% 24% 27% 22%
Total 18.8 100% 1 673 34% 5% 30% 12% 20%
Non ZAR – 10% of total costs
• 100% at Unki
• C. 25% at Mogalakwena
• Diesel 3% of total mined cash operating costs
• Diesel 12% of Mogalakwena cash operating cost
Interim Results July 2020 50ALL-IN SUSTAINING COST (AISC)
Mogalakwena Amandebult Unki Mototolo JV mined AAP Total mined
Costs (US$million)
Cash operating costs 289 288 75 71 127 850
Other costs and marketing 57 55 26 12 16 170
Capitalised waste costs 85 - - - - 85
Sustaining capital 44 12 3 12 7 79
a Total Cost 474 356 104 94 150 1 184
Total revenue excluding platinum
PGMs excluding platinum 530 379 93 111 227 1 339
Base metals, chrome and other 16 (8) 1 (9) (15) (14)
b Total revenue ex. Platinum 547 371 94 102 212 1 325
c=a–b All-in sustaining costs (72) (16) 11 (8) (62) (141)
d Platinum ounces sold (000) 122 88 20 24 41 295
e = c d x 1,000 US$ AISC per platinum ounce sold (594) (176) 525 (320) (1 503) (480)
Average Pt price achieved ($) 857 857 857 857 857 857
Marketing adjustment (57) (55) (60) (56) (65) (57)
Realised $ cash margin/Pt ounce sold 1 508 1 089 392 1 233 2 425 1 394
~ Not consolidated in economic free cash flow
Interim Results July 2020 51RAND BASKET PRICE
Company
Mogalakwena Amandebult Unki Mototolo JV mined POC/Other
(ex-trading) (18)
Net sales revenue (US$million)
from platinum 105 76 17 21 38 121 378
from palladium 358 115 49 41 84 196 843
from rhodium 121 227 31 58 122 286 845
base metals & other 109 64 23 12 21 133 362
a Total Revenue 693 482 120 132 265 735 2 428
Sales volume (000 ounces)
b Platinum ounces sold 122 88 20 24 41 141 436
Other PGMs sold 221 141 37 45 83 267 794
c Total PGMs sold 343 229 57 69 124 408 1 229
d = a b x 1,000 US$ basket per platinum ounce 5 681 5 476 6 012 5 545 6 448 5 228 5 573
e = a c x 1,000 US$ basket per PGM ounce 2 018 2 103 2 115 1 929 2 143 1 804 1 975
f US Dollar/ZAR exchange rate 16.44 16.44 16.44 16.44 16.44 16.44 16.44
g=dxf Rand basket per platinum ounce 93 370 89 998 98 813 91 145 105 973 85 934 90 776
h=exf Rand basket per PGM ounce 33 164 34 565 34 766 31 703 35 218 29 653 32 460
~ Not consolidated in economic free cash flow
Interim Results July 2020 52SIMPLIFIED EBITDA PER PGM OUNCE
Mogalakwena Amandebult Unki Mototolo JV mined Mining POC Toll Trading Company
c=axb Net revenue 11 385 7 923 1 977 2 173 4 359 27 817 12 088 392 14 866 54 770
a Rand basket per PGM ounce 33 164 34 565 34 766 31 703 35 218 33 853 29 653 32 437
b PGM ounces sold (000 ounces) 343 229 57 69 124 822 408 459 1 689
f=dxe Cash operating costs 5 106 4 492 1 107 1 043 2 075 13 722 15 036 28 859
d Cash operating cost/PGM oz (M&C) 9 120 20 626 13 782 14 294 12 555
d Purchase of concentrate/PGM oz (M&C) 27 798
e PGM oz produced (M&C) (000 ounces) 560 218 80 82 145 1 093 541 1 634
g Other costs (164) 1 150 308 307 118 1 911 (5 070) 349 14 380 12 849
Other cost (468) 887 193 236 (13) 1 855 (5 070) 349 14 380 11 556
Royalties 304 262 112 71 131 892 892
Marketing & Development 400
h=f+g Total cost 4 942 5 642 1 415 1 350 2 194 15 632 9 967 349 14 380 41 707
i=c–h EBITDA 6 443 2 281 532 823 2 165 12 185 2 121 44 486 13 063
j = i/c x 100 EBITDA margin 57% 29% 28% 38% 50% 44% 18% 31% 3% 24%
~ Unit cost excludes once off costs
Interim Results July 2020 53SIMPLIFIED EBITDA PER PLATINUM OUNCE
Mogalakwena Amandebult Unki Mototolo JV mined Mining POC Toll Trading Company
c=axb Net revenue 11 385 7 923 1 977 2 173 4 359 27 817 12 088 392 14 866 54 770
a Rand basket per platinum ounce 93 370 89 998 98 813 91 145 105 973 94 311 85 934 94 130
b Rand basket ounces sold (000 ounces) 122 88 20 24 41 295 141 146 582
f=dxe Cash operating costs 5 106 4 492 1 107 1 043 2 075 13 722 15 036 28 859
d Cash operating cost/Pt oz (M&C) 21 347 40 515 31 017 27 624 32 094
d Purchase of concentrate/Pt oz (M&C) 57 158
e Pt oz produced (M&C) (000 ounces) 239 111 36 38 65 491 263 755
g Other costs (164) 1 150 308 307 118 1 911 (5 070) 349 14 380 12 849
Other cost (468) 887 193 236 (13) 1 855 (5 070) 349 14 380 11 556
Royalties 304 262 112 71 131 892 892
Marketing & Development 400
h=f+g Total cost 4 942 5 642 1 415 1 350 2 194 15 632 9 967 349 14 380 41 707
i=c–h EBITDA 6 443 2 281 532 823 2 165 12 185 2 121 44 486 13 063
j = i/c x 100 EBITDA margin 57% 29% 28% 38% 50% 44% 18% 31% 3% 24%
~ Unit cost excludes once off costs
Interim Results July 2020 54FOOT NOTES
(1) Total recordable case injury frequency rate (TRCFR) is a measure of the rate of all injuries requiring treatment above first aid per 1,000,000 hours worked
(2) Refined production excluding tolling and 4E purchase of concentrate that is now tolled
(3) AISC stands for all-in sustaining costs: defined as cash operating costs, overhead costs, other income and expenses, all sustaining capital expenditure, capitalised waste stripping and allocated marketing and market
development costs net of revenue from all metals other than platinum
(4) LDV stands for light-duty vehicles
(5) Source: Company analysis
(6) Source: LMC Automotive
(7) ICE stands for internal combustion engine
(8) Source: Johnson Matthey, Company analysis
(9) Source: Johnson Matthey, Company analysis
(10) Source: World Platinum Investment Council
(11) Source: Company analysis
(12) Source: Company analysis
(13) Source: 2019 per Johnson Matthey view (May 2020) , Company analysis
(14) Economic interest adjustment is an adjustment to exclude minority share of operating free cash flow for subsidiaries / joint operations and include associate’s share of profit or loss
(15) Economic free cash flow represents AAP’s economic share of operating cash flow after adjusting for minority interests for subsidiaries / joint operations and includes associate’s share or profit and loss
(16) Investment in associates, funding and other: includes Mototolo deferred consideration, Sibanye deferred consideration, Proceeds from BRPM and Bokoni funding
(17) Other: includes market and market development costs, restructuring, working capital movements not allocated to each individual asset
(18) Company excluding trading – does not include traded ounces
Images
• Front cover picture: Mareesburg Tailings Dam
• Supporting stakeholders divider: AAP collaborating with Gift of the Givers on providing food parcels
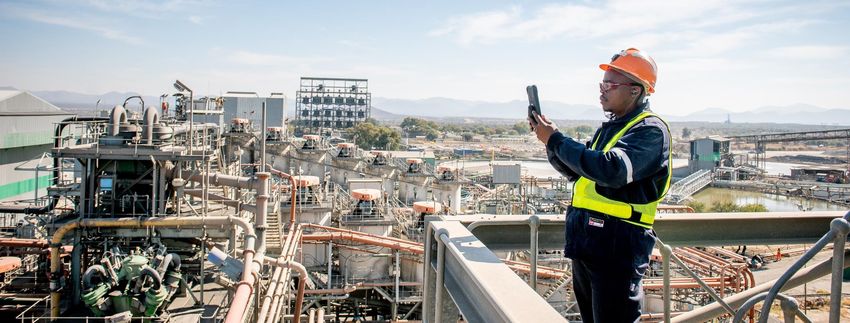
• Operational performance divider: Unki laser device used underground for precision mark-up of centre lines and panel marking
• Financials divider: PlatAfrica jewellery submission
• PGM Market divider: Hyundai Nexo fuel-cell vehicle
• Positioning the business for the future divider: View from the top of Amandelbult
• Guidance and conclusion divider: Employee demonstrating wearing protective mask
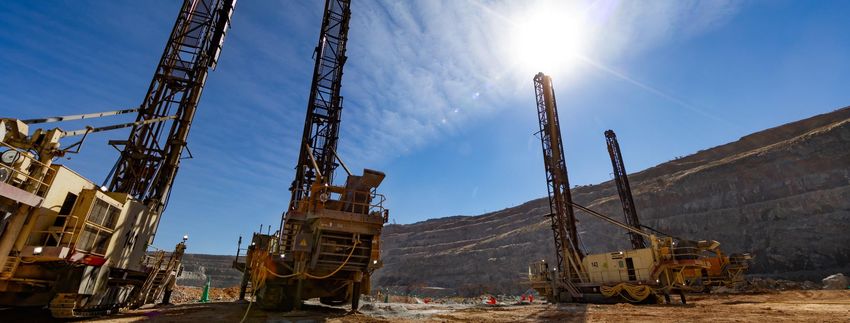
• Appendix divider: Autonomous drilling at Mogalakwena
Interim Results July 2020 55You can also read