Origin Energy 2018 Full Year Results Full year ended 30 June 2018 - Frank Calabria, CEO and Lawrie Tremaine, CFO 16 August 2018

Page created by Wayne Pham
 
CONTINUE READING
Origin Energy 2018 Full Year Results Full year ended 30 June 2018 - Frank Calabria, CEO and Lawrie Tremaine, CFO 16 August 2018
Origin Energy
2018 Full Year Results
Full year ended 30 June 2018

Frank Calabria, CEO and Lawrie Tremaine, CFO
16 August 2018
Origin Energy 2018 Full Year Results Full year ended 30 June 2018 - Frank Calabria, CEO and Lawrie Tremaine, CFO 16 August 2018
Important Notice
Forward looking statements
This presentation contains forward looking statements, including statements of current intention, statements of opinion
and predictions as to possible future events. Such statements are not statements of fact and there can be no certainty of
outcome in relation to the matters to which the statements relate. These forward looking statements involve known and
unknown risks, uncertainties, assumptions and other important factors that could cause the actual outcomes to be
materially different from the events or results expressed or implied by such statements. Those risks, uncertainties,
assumptions and other important factors are not all within the control of Origin and cannot be predicted by Origin and
include changes in circumstances or events that may cause objectives to change as well as risks, circumstances and
events specific to the industry, countries and markets in which Origin and its related bodies corporate, joint ventures and
associated undertakings operate. They also include general economic conditions, exchange rates, interest rates,
regulatory environments, competitive pressures, selling price, market demand and conditions in the financial markets
which may cause objectives to change or may cause outcomes not to be realised.

None of Origin Energy Limited or any of its respective subsidiaries, affiliates and associated companies (or any of their
respective officers, employees or agents) (the Relevant Persons) makes any representation, assurance or guarantee as to
the accuracy or likelihood of fulfilment of any forward looking statement or any outcomes expressed or implied in any
forward looking statements. The forward looking statements in this presentation reflect views held only at the date of this
presentation.

Statements about past performance are not necessarily indicative of future performance.

Except as required by applicable law or the ASX Listing Rules, the Relevant Persons disclaim any obligation or
undertaking to publicly update any forward looking statements, whether as a result of new information or future events.

No offer of securities

This presentation does not constitute investment advice, or an inducement or recommendation to acquire or dispose of
any securities in Origin, in any jurisdiction.

2       16 August 2018      2018 Full Year Results Announcement
Outline

1. Performance Highlights
   - Frank Calabria
2. Financial Review
   - Lawrie Tremaine
3. Operational Review
   - Frank Calabria
4. Outlook
   - Frank Calabria

3   16 August 2018   2018 Full Year Results Announcement
Performance
                                                           Highlights
                                                           Frank Calabria,
                                                           CEO

4   16 August 2018   2018 Full Year Results Announcement
Financial highlights

       Statutory Profit                               Underlying Profit                    Underlying EBITDA
                                                   (continuing operations)               (continuing operations)

      $218 million                                      $838 million                      $2,947 million
                        12.4 cps                                      47.7 cps
     Including H1 FY2018 impairments                 Up $438 million or 110% on FY2017    Up $774 million or 36% on FY2017
          of $533 million after tax

             NCOIA                                    Adjusted Net Debt                     Underlying ROCE
                                                                                         (continuing operations)

    $2,645 million                                       $6.5 billion                              8.4%

    Up $1,267 million or 92% on FY2017                Down $1.6 billion from June 2017     Up from 5.5% in FY2017 and in
                                                                                           line with H1 FY2018

5      16 August 2018         2018 Full Year Results Announcement
Sustainability highlights

                           People                                                   Customer

    ▪ Total Recordable Incident Frequency                          ▪ Addressing affordability and transparency
      Rate (TRIFR) down from 3.2 to 2.2                            ▪ Improved Net Promoter Scores, #1 Tier 1
    ▪ Refreshed purpose and values                                   retailer for Strategic NPS
    ▪ Employee engagement up 3%                                    ▪ New products and digital experiences

                         Communities                                                 Climate

    ▪ $236 million spent with regional suppliers                   ▪ Committed to halving emissions by 2032
    ▪ $23 million awarded by Origin                                ▪ TCFD recommendations adopted
      Foundation to organisations since 2010                       ▪ Owned and contracted generation
    ▪ ‘Best Company Indigenous Procurement’                          consistently below NEM average CO2
      Award                                                          emissions intensity

6       16 August 2018       2018 Full Year Results Announcement
First full year of production at APLNG

              Commodity prices                                                                           LNG cargoes delivered                Sales revenue
                                                                                                                                                   (APLNG 100%)
          80                                                                            13
                                                                                                         140                             6

          70                                                                            11               120
                                                                                                                                         5

                                                                                             US$/mmbtu   100
          60                                                                            9
                                                                                                                                         4
US$/bbl

                                                                                                         80

                                                                                                                                  A$bn
          50                                                                            7                                                3
                                                                                                         60

          40                                                                            5                                                2
                                                                                                         40

          30                                                                            3                                                1
                                                                                                         20
                         Oct-16

                                           Apr-17

                                                             Oct-17

                                                                               Apr-18
                                  Jan-17

                                                                      Jan-18
                Jul-16

                                                    Jul-17

                                                                                                          0                              0
                           JCC (LHS)
                                                                                                               FY17        FY18                FY17          FY18
                           APLNG effective oil price (LHS)
                           JKM (RHS)                                                                                                         LNG        Domestic Gas
                                                                                                               Contract   Spot
          Source: Origin analysis

          7               16 August 2018                                        2018 Full Year Results Announcement
APLNG unit cost reductions on-track

Key Outcomes                      Initial Targets                     Metric            FY2018        FY2018      June 2019
                                                                                       Guidance       Actual      target run
                                                                                                                     rate

Cost reduction                    Well cost1                          A$m/well            2.4           1.9           1.2
and productivity
improvement                       Operating cost2                     A$/GJ               1.3           1.3           1.0

      •    Flatter, smaller, asset-led structure built around core processes – 500 role reduction in
           FY2018
      •    Driving down well costs by
           – Lower overheads                                                   – Continuous drilling improvements
           – Optimised gathering construction                                  – Re-priced rig and construction contracts
           – Simplified surface facilities design

      •    Further operating cost savings from power & streamlined maintenance through FY2019

    1) Standard unfracked vertical Surat well; 2) Upstream operated

8           16 August 2018             2018 Full Year Results Announcement
Supply response in wholesale markets

                                                     Electricity                                                                                                      Natural Gas
                                 Actual                                                 Forward price
         250                                                                                                                                          16

                                                                                                                                                      14
     200
                                                                                                                                                      12

         150
                                                                                                                                                      10
A$/MWh

                                                                                                                                              A$/GJ
                                                                                                                                                      8
         100
                                                                                                                                                      6

                                                                                                                                                      4
         50
                                                                                                                                                      2

          0                                                                                                                                           0

                                                                                                                                                                    Sep-16

                                                                                                                                                                                                                                                     Mar-18
                                                                                                                                                                                      Jan-17
                                                                                                                                                                                               Mar-17
                                                                                                                                                                                                        May-17

                                                                                                                                                                                                                          Sep-17
                                                                                                                                                           Jul-16

                                                                                                                                                                             Nov-16

                                                                                                                                                                                                                                   Nov-17
                                                                                                                                                                                                                                            Jan-18

                                                                                                                                                                                                                                                              May-18
                                                                                                                                                                                                                 Jul-17

                                                                                                                                                                                                                                                                       Jul-18
                                                                                                                            Jul-20
                        Nov-16

                                 Mar-17

                                          Jul-17

                                                             Mar-18

                                                                                        Mar-19

                                                                                                                   Mar-20
                                                                                                          Nov-19

                                                                                                                                     Nov-20
                                                   Nov-17
               Jul-16

                                                                      Jul-18

                                                                               Nov-18

                                                                                                 Jul-19

                                                                                                                                                       Brisbane                                 Sydney                                        Victoria
                        QLD                             NSW                                  VIC                              SA
                                                                                                                                                       Adelaide                                 Wallumbilla
           Source: AEMO                                                                                                                        Source: AEMO

9              16 August 2018                               2018 Full Year Results Announcement
Increased competition in retail markets

Customer movement                                      Customer activity                       Market churn
           (‘000 customers)                                   (‘000 customers)                 Rolling 12 month average

                   FY18                                                                  25%
 40
                                                  3,000
 30
                                                                                         23%
 20                                               2,500

 10                                                                                      21%
                                                  2,000
  0
                                                                                         19%
(10)                                              1,500
(20)                                                                                     17%
(30)                                              1,000

(40)                                                                                     15%
                                                    500
(50)
                                                                                         13%
(60)                                                    0
       NSW      VIC       QLD      SA                            FY17        FY18

          Electricity     Gas                                   Wins    Retains                  Market       Origin

   •   Net retail and business                •   23% increase in wins and retains   •    Origin churn lower than
       customer loss of 17,000                •   23% increase in call volumes            market

  10     16 August 2018         2018 Full Year Results Announcement
Transforming customer experience

                      • Increasing supply – Eraring, Pelican Point and renewables
                      • Flat/falling tariffs in FY2019 – Absorbed 3% electricity price
More                    increase in NSW
affordable
                      • No increases for hardship customers since 2016
                      • Low rate concession products in SA, VIC

                      • Transparency - Savernator comparator & dollar value estimates
Smarter and
            • Digital first approach – seamless customer journey
easier
                      • Improved visibility & control – Usage Buster, HomeHQ

More                  • #1 provider for Business solar
sustainable           • Targeting renewables to be >25% of generation mix by 2020
                      • Investing in future energy solutions

11   16 August 2018      2018 Full Year Results Announcement
Active role in policy development

                        • Investment signal in low emissions and reliable generation
Support NEG
            • Support more ambitious targets for the electricity sector over
objectives
                          time

                        • We support sensible reform provided no unintended
                          consequences
                             − Conditional discounts to be cost reflective

ACCC report:      − Improve hardship framework and customer transfers
Industry-wide     − Abolish SRES and other state based green schemes; and
response to       − Write-down network asset bases
drive best    • Industry can go further:
customer
                  − Prevent confusing sales activity - e.g. door-to-door sales to
outcomes            vulnerable customers; and
                             − Ban unanchored discounts & convert to dollar value
                               discounts
                        • We do not believe price regulation is in the best long-term
                          interests of customers or the industry
 12    16 August 2018     2018 Full Year Results Announcement
Making progress on key commitments

     ➢ Balance sheet repair – approaching target capital structure

     ➢ Disciplined capital management initiatives implemented

     ➢ Improving returns

     ➢ Becoming a low cost operator

       − Step change reduction in costs at APLNG on track

       − Cost to serve reduction underway in Energy Markets: Update to be
         provided later in the year

13     16 August 2018   2018 Full Year Results Announcement
Positioned for the future

       Today’s portfolio                                              Growth opportunities

APLNG strong foundations                                     Integrated Gas
• On track to international                                  • Entering stage 2 in the Beetaloo
  competitiveness                                              − Targeting liquids rich plays
• Delivering into strong Asian demand
                                                             • Entered FEED for Ironbark Stage 1
• Significant cash generation
                                                               − Targeting first gas in FY2021/22
                                                               − Assessing alternative strategic options

Flexibility a strength in Energy Markets                     Energy Markets
• Strong gas position with length                            • Growing renewables >1,000 MW by FY2020
  beyond 2022 and flexible transport
                                                             • Brownfield generation
• Short energy and balanced capacity
                                                               − Increased flexibility and capacity
• Fuel and geographic diversity
                                                               − Pumped hydro and batteries
• Moderate near term capex required
                                                             • Retail adjacencies and new products
                                                             • Growing rooftop solar

14    16 August 2018   2018 Full Year Results Announcement
Priorities and opportunities are aligned to our
strategy
Connecting customers to the energy and technologies of the future
Leading customer
                                  • Making energy more affordable, smarter, easier and more
experience and
                                    sustainable
solutions

Accelerating towards              • Targeting renewables to be >25% of generation mix by
clean energy                        2020

Embracing a
                          • Connecting customers to distributed generation, storage
decentralised and digital
                            and digitally enabled solutions
future

                                  • Achieve international competitiveness in upstream gas
Becoming a low cost               • Reducing Energy Markets cost to serve
operator                          • Simplifying and streamlining processes across the
                                    company

Developing resources to
                        • Through our interest in APLNG and other upstream
meet growing gas
                          opportunities
demand
15   16 August 2018   2018 Full Year Results Announcement
Financial
                                                            Review
                                                            Lawrie Tremaine,
                                                            CFO

16   16 August 2018   2018 Full Year Results Announcement
Strong underlying financial performance

                  Statutory Profit/(Loss)           218                           Underlying Profit
                                                                        1,000   (Continuing operations)
            (200)
                                                                                                             838
     A$m

                                                                  A$m
           (1,200)                                                       500

           (2,200)                                                         0
                         FY16         FY17         FY18                            FY16       FY17        FY18

                      Operating Cash Flow
                                                                                     Underlying ROCE
                      (Continuing operations)
                                                                                   (Continuing operations)
            1,600
                                                                          9%
                                                    363
                                                                                                             8.4%
                                                   1,153                  6%
     A$m

              800
                                                                          3%

                  0                                                       0%
                         FY16        FY17          FY18                           FY16        FY17        FY18

                        Net cash flow from APLNG

17   16 August 2018         2018 Full Year Results Announcement
Underlying profit from continuing operations
more than doubled to $838 million

                                                           Movements in Underlying Profit

                                                               $235 million

                                                                             (269)

                                                            504                                                                                1,022
                                                                                                (116)                            184
     $ million

                                                                                                                   838

                                          319

                        400

                                                                                                            1
                      FY17 -         EM EBITDA          IG EBITDA          Share of          Tax/Other            FY18 -     Discontinued   FY18 - Total
                    Continuing                                           APLNG ITDA                             Continuing    Operations     operations
                    operations                                                                                  operations

                   1)   Primarily driven by an increase in provisions for legacy site remediation ($70 million pre-tax)

18               16 August 2018            2018 Full Year Results Announcement
Energy Markets Underlying EBITDA
increased by 21%
                                         Movements in Energy Markets Underlying EBITDA

                                                                                          60              (35)             (48)
                                                                          61                                                               2

                   (68)                                                                                                                           1,811
                                                        478
                                      (131)
     1,492

                               Electricity                                    Gas
                              +$279 million                               +$121 million

      FY17    Electricity Volume   Competition /     Electricity      Natural Gas     Natural Gas    Cost to acquire   Cost to maintain   Other   FY18
                                     Activity      Wholesale Margin    Volume       Wholesale Margin

Electricity                                                                               Natural Gas
•    5% decrease in sales volumes - customer losses,                                      •    13% increase in sales volumes primarily to Business
     milder weather & energy efficiency                                                        customers
•    Improved wholesale margin - 3TWh increase in                                         •    Competitively priced and flexible supply portfolio in a
     owned and contracted generation less higher green                                         rising market
     costs
                                                                                          Costs to serve
                                                                                          •    Increased competition and customer activity,
                                                                                               increased brand, analytics and digital spend

19      16 August 2018                2018 Full Year Results Announcement
Integrated Gas Underlying EBITDA
increased by 67%
                                  Movements in Integrated Gas Underlying EBITDA

                                                            106
                                                                             (63)
                                                                                           (13)            (29)
                                          214

                         289

                                        Share of APLNG                                       Origin only costs          1,251
                                         +$546 million                                         -$42 million

       747

       FY17          LNG Volume        LNG Price     Domestic Revenue   APLNG opex/      Commodity         Other        FY18
                                                                           other          hedging

 Share of APLNG                                                          Origin only costs

 •   Full year of production from both LNG trains                        •     Oil and LNG hedging costs

 •   Higher domestic revenue as legacy contracts roll-off                •     Other - lower cost recoveries from upstream
                                                                               operatorship of APLNG
 •   APLNG opex – Gilbert Gully exploration non-cash
     write-off ($41 million)

20      16 August 2018         2018 Full Year Results Announcement
$2.6 billion free cash flow at APLNG
                 APLNG uses of cash                   $1.3 billion
      6,000                                           distributable
                                                      cashflow
                                                                                   •   Effective oil price of US$56/bbl

      5,000                                                                        •   Project finance debt
                                                                                         – Principal repaid $0.9 billion
                                                                        $2.6

      4,000
                                                                        billion free     – Interest paid $0.4 billion
                                                                        cashflow

                                                                                   •   $1.3 billion distributable cash flow after
                                                                                       debt service (ORG share $482 million)
A$m

      3,000
                                                                                   •   Cash flow to Origin was $363 million
                                                                                         – ($74) million contributed in H1
      2,000
                                                                                         – $76 million Reserve account loan
                                                                                         – $227 million MRCPS interest
      1,000
                                                                                         – $134 million MRCPS buy back

                                                                                   •   Balance of cash retained by APLNG to
           0                                                                           meet scheduled project finance
                           FY17                          FY18                          payments

     Distributable cash flow              Project finance principal                •   Refinancing of project finance debt
     Project finance interest             Capital expenditure                          underway
     Working capital and other            Operating costs

21        16 August 2018          2018 Full Year Results Announcement
Cash flow improvement

                                                         FY2018 FY2017 Change           •   Working capital increases impacting
                                                                                            cash conversion
Underlying EBITDA                                           2,947       2,173    774
                                                                                               –   FY2018 driven by coal and
Non-cash items (primarily share of APLNG)                 (1,269)     (743)     (526)
                                                                                                   LREC inventory and timing of
Change in working capital                                   (245)       (178)    (67)              APLNG cost recoveries
Electricity hedge premiums (excl. from
                                                            (160)       (133)    (27)
underlying)                                                                             •   From FY2019 certain electricity
Tax/Other                                                   (120)       (115)     (5)       hedge premium costs previously
Cash from operating activities - continuing                                                 excluded from underlying earnings
                                                            1,153     1,005      148        will be included within Underlying
operations
Capital expenditure - continuing operations                 (328)     (323)       (5)       Profit
Net cash flow from/(to) APLNG       1
                                                              287     (297)      584           –   No change to statutory
Net disposals/other                                         1,486        888     598               results or cash flow
Total cash flows - discontinued operations                      46       106     (60)   •   Positive result from both Lattice and
NCOIA                                                      2,645      1,378     1,267       Acumen sales

1. Additional $76 million from APLNG included in financing cash flows

22       16 August 2018         2018 Full Year Results Announcement
Delivering on balance sheet commitments
                      Adjusted net debt (A$bn)                                        Capital structure

                                                                    6x
     10

     8                                                              5x

     6
                                                        6.5         4x

     4
                                                                                          Interim Target (3.0 - 3.5x)
                                                                    3x
     2                                                                                        Target (2.5 – 3.0x)

     0                                                              2x
                  FY16             FY17                FY18                    FY16              FY17    1              FY18
                                                                                              Debt/EBITDA
 • $1.5 billion cash from operating activities and APLNG
 • $1.5 billion net asset sale proceeds
                                                                    • Gearing2 reduced to 35% from 42% in FY2017
 • ~$100 million annualised interest savings from FY2019
                                                                    • Favourable credit rating action following Lattice
     –    Refinanced $4 billion bank facility                         Energy sale and H1 FY2018 results
     –    Cancelled $3.4 billion of liquidity                       • On track to achieve target capital structure
     –    Lattice proceeds and redemption of €500 million hybrid
 • Expect $50 million per annum additional savings from hybrid
   redemption in Sept 2019
                                                                      1)   EBITDA excludes share of APLNG EBITDA and includes cash from
23        16 August 2018      2018 Full Year Results Announcement          APLNG. FY2018 represents EBITDA from continuing operations only
                                                                      2)   Adjusted net debt / Adjusted net debt plus equity
Oil price risk management

                                                     FY2019 oil hedging payoff                                                                                      FY2020 oil hedging payoff

                                 90                                                                                                                       90
                                                      FY19 effective price                                                                                                   FY20 effective price
                                 85                   FY19 effective price after hedging                                                                  85
                                                                                                                                                                             FY20 effective price after hedging
                                 80                                                                                                                       80
1

                                                                                                                          1
Effective oil price (US$/bbl)1

                                                                                                                          Effective oil price (US$/bbl)
                                 75                                                                                                                       75

                                 70                                                                                                                       70

                                 65                                                                                                                       65

                                 60                                                                                                                       60

                                 55                                                                                                                       55

                                 50                                                                                                                       50
                                                                                                                                                                                       Objective is to protect
                                 45                                                                                                                       45                           investment grade rating
                                 40                                                                                                                       40
                                      40      45     50     55    60     65     70    75   80     85     90                                                    40    45     50    55    60     65    70     75    80   85   90
                                                   FY19 average market oil price (US$/bbl)                                                                                FY20 average market oil price (US$/bbl)

          •                      15.4 mmbbl hedged - combination of put and call                                      •        11.6 mmbbl hedged - average floor of U$48/bbl
                                 options, collars and three-way producer hedges
                                                                                                                      •        Sold 4.2 mmbbl call options at US$85/bbl
          •                      Hedge premium cost of $34 million
                                                                                                                      •        Hedge premium cost of $26 million
          •                      Full participation above US$75/bbl

                 1)                   All prices are in JCC crude oil equivalent. Effective price is inclusive of contract pricing lags, hedging gains (losses) and premium costs.

 24                                        16 August 2018              2018 Full Year Results Announcement
Operational
                                                            Review
                                                            Frank Calabria,
                                                            CEO

25   16 August 2018   2018 Full Year Results Announcement
Energy Markets

26   16 August 2018   2018 Full Year Results Announcement
Improved returns from generation portfolio

                       Electricity sources and uses
            45

            40                                                        •   Increased generation more than covered retail
                                                                          sales and reduced market price exposure
            35
                                                                          − 14% increase at Eraring to 15.9TWh (NSW)
            30                                                            − 1.5TWh new supply from Pelican Point (SA)

            25                                                        •   Eraring average availability factor 85% (well
     TWh

                                                                          above NEM average)
            20                                                        •   1TWh reduction at Darling Downs Power Station
                                                                          (QLD) liberated gas for the domestic market
             15
                                                                      •   Flexibility a key strength
            10
                                                                            –   Eraring limited long term take-or-pay
                                                                                exposure and can flex intra-day
              5
                                                                            –   Ability to add renewables supported by
              -                                                                 existing gas position
                       FY17         FY18               FY18
                                                                            –   Ability to manage short energy position
                      Sources      Sources             Sales
           Renewables        Coal (Eraring)         Gas
           Other             Contracts              Spot
           Retail            Business

27          16 August 2018      2018 Full Year Results Announcement
Continuing to grow gas sales volumes

             Energy Markets Domestic Gas
                      sales (PJ)
     300

     250                                                                •   Secured additional 69 PJ for the east coast
                                                                            domestic markets
                                                                        •   Record gas sales volume
     200
                                                                             − Business customer sales up 26.5 PJ
                                                                             − Gas directed to generation up 5.2 PJ
     150
                                                                        •   Flexibility to direct competitive gas supply to
                                                                            where it is needed most
     100

      50

      0
                        FY17                        FY18

               Retail       Business    Generation         LNG

28         16 August 2018         2018 Full Year Results Announcement
Competing in market and improving
customer experience

                      Net customer movement                               Origin Interaction NPS                     Strategic NPS1

                                                                                                                      FY17         FY18
          40

          20
                                                30
                                                                                                     21.7
('000s)

            -
                                                                                16.1
                                                                                                                                    (13)
          (20)
                            (47)                                                                                      (16)

          (40)
                                                                                FY17                FY18             #1 of Tier 1 retailers
          (60)
                          H1 FY18             H2 FY18

  •        Responded to competitive activity and grew                       •       Digitising customer experiences
           customer accounts in the second half by 30k                      •       Building analytics capability to grow value
  •        Continued focus on managing share and value                      •       Developing new products and services
                                                                            •       Brand investment to position for the future

                                                                                1   90 day rolling average at June

 29              16 August 2018     2018 Full Year Results Announcement
Increased activity driving higher retail costs

            Customer activity                                                 Electricity and Natural Gas Cost to Serve
                (‘000 customers)                                                                           (A$m)

                                                                                                                   17         11
 3,000                                                                                   42           13
                             23% increase in                                                                                         624
                            customer activity
                                                                              541
 2,500

 2,000
                                                                                                       15% increase in
                                                                                                        cost to serve
 1,500

 1,000                                                                        FY17   Competitive   Bad debts     Digital,    Other   FY18
                                                                                       activity                Analytics &
                                                                                                                Products

     500
                                                                          •    Competitive activity – channel costs,
                                                                               marketing, brand and Power of Choice
      0
                     FY17                   FY18                          •    Increased digital investment to enable
                                                                               customer experience improvements
                       Wins       Retains
                                                                          •    Cost to serve reduction underway

30         16 August 2018           2018 Full Year Results Announcement
Digitising interactions, products and services

                    Increasing digital interactions                                                             New products and services

                                                                                                   Technology pipeline
         Online sales up 28%                    MyAccount & Mobile
          (wins & retains)                     App unique visits up 54%

                                                                                                  Visibility and control       Reducing energy cost
                                                                           1,822k
                              345k
                                                                                                 Usage Buster      Home HQ    Savernator
             270k
                                                    1,186k

                                                                                                                                           Solar (Boost, Flex)

                                                                                                            Demand Response
             FY17           FY18                    FY17                   FY18
        Lower online sale cost                 Digital interactions reducing
                                                  call volumes during H2
                                                                                                 Adjacent offerings
                                                                                                                                    Centralised
                                                                                         37%
                                                                                                                                Energy Services
                                                                                                         NBN                            growth

                                                                                                         Broadband
                                                                                         (13%)                                        WA mass market
                                                                                                                                      launch (Oct 17)
                                                                                                         Pay TV
        Online      Call centre Third Party

                                               Jan-18
                                                29-Jan   28-Feb   31-Mar 30-Apr 31-MayJun-18
Sales        14%        77%          9%
mix
                                                              Digital interactions
                                                                                                     One-stop service                      Growth
                                                              Service call volume
        31          16 August 2018            2018 Full Year Results Announcement
Integrated Gas

32   16 August 2018   2018 Full Year Results Announcement
Increased production and realised prices

           APLNG production                          APLNG domestic price               APLNG LNG price
             (ORG share)

                                                                                                   7.90

                                                                                         6.48

                                                                            US$/mmbtu
                                             A$/GJ
     PJ

                                                                   4.50
                         254
              229

                                                        3.04

              FY17      FY18                            FY17       FY18                  FY17      FY18

33   16 August 2018   2018 Full Year Results Announcement
FY2018 breakeven improvement
               US$45/boe
                                                                                                          US$39/boe
                       18

                                                2                                                              18
                                                                            2                 2

                      27
                                                               Operating breakeven                             21
                                                                down US$6/boe

               FY18 guidance          Operated well cost           Non-operated     LNG spot & domestic    FY18 actual
                                           savings                    Capex           revenue/other
                                                    Operating Breakeven           Project Finance

•        FY2018 breakeven benefited from:
         − Savings on operated well costs (US$2/boe), reduced to $1.9 million/well vs guidance of
           $2.4 million/well
         − Changes in scope of non-operated activity (US$2/boe); and
         − Higher realised prices on LNG spot and domestic gas sales (US$2/boe)

    1)    FX rate : FY2018 - 0.78 AUD/USD

    34        16 August 2018          2018 Full Year Results Announcement
FY2019 breakeven guidance

100% APLNG                                                      (US$/boe)1   •   Continued capex and opex savings
                                                                                 offset by additional scope in FY2019
FY2018 Distribution breakeven                                          39
                                                                                   – Non-operated capex from
Continued reduction in well costs                                      (1)           FY2018 (US$2/boe)

Opex savings and lower purchases                                       (2)         – Increased E&A (US$2/boe)
                                                                                   – Infrastructure spend to increase
Non-operated capex                                                     2
                                                                                     flexibility and other (US$3/boe)
Operated E&A                                                           2     •   Project finance estimate does not
Infrastructure spend and other capex                                   3
                                                                                 include potential savings from a
                                                                                 project debt refinancing underway
Project finance                                                        (1)
                                                                             •   Range represents variability around
FY2019 Distribution breakeven (estimate)                          39 – 44        work program scope, operating costs,
                                                                                 project refinancing and non oil-linked
 1)      AUD/USD rate : FY2018 – 0.78, FY2019 and target run rate – 0.75         revenue

     Increased activity in FY2019, but we remain on
     track to achieve our June 2019 run-rate targets1
     •   Operated breakeven
2P reserves up 5% before production

                                                                             Revisions/
      APLNG 100% Reserves / Resources1                       FY2017                            Production FY2018
                                                                             extensions

1P (proven)                                                        7,518                 837            (676)        7,679
2P (proven plus probable)                                        12,545                  584            (676)      12,453
3P (proven plus probable plus possible)                          13,382                 603             (676)       13,310
2C (best estimate contingent resource)                            3,956               (707)                         3,249

  •    11% increase in 1P – FY2018 development drilling
  •    5% increase in 2P and 3P – improved recovery estimates from operated areas and economic
       assumptions, including reductions in future unit costs
  •    5% decrease in 2C – intended divestment of Gilbert Gully (573PJ), and conversion to
       reserves
  •    Exploration campaign underway to test new conventional and unconventional prospects, in
       which a success case would mature toward contingent resource

 1)    For further information refer to Origin’s Annual Reserves Report for the year ended 30 June 2018, announced on the same date as this presentation.
       Some of APLNG’s reserves and resources are subject to reversionary rights and an ongoing royalty interest in favour of Tri-Star. Refer to section 6 of the
       Operating and Financial Review for further information
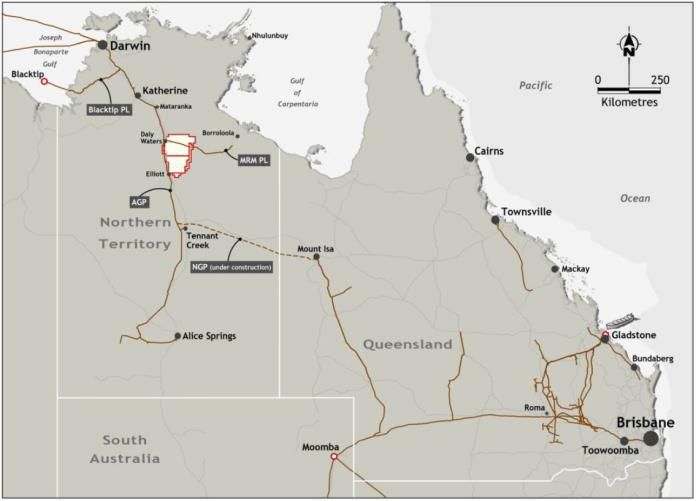
36       16 August 2018              2018 Full Year Results Announcement
Next phase at Beetaloo

                                                                                        •    NT moratorium lifted in April 2018
                                                                                        •    70% interest in 18,500km2 permit
                                                                                        •    Four, stacked, unconventional
                                                                                             hydrocarbons plays identified
                                                                                        •    Booked 6.6 TCF contingent resource
                                                                                             (4.6 TCF Origin share) in February 2017
                                                                                             relating to Velkerri B shale dry gas play
                                                                                        •    Entering Stage 2 appraisal targeting:
                                                                                               − Kyalla shale liquids rich gas play
                                                                                               − Velkerri shale liquids rich gas play
                                                                                        •    One vertical and two horizontal appraisal
                                                                                             wells are expected to be drilled and
     Measured and Estimated Parameters
                                                              Unit        Best               fracture stimulated during 2019
                                                               s        Estimate
     P50 area (from Contingent Resource
                                                              km2          1,968
     area distribution)

     Original Gas In Place (OGIP)1 (Gross)                    TCF           61.0

     2C Contingent Resource (Gross)                           TCF           6.6

     2C Contingent Resource (Net to Origin)2                  TCF           4.6
 (1)    OGIP presented is the product of the P50 Area by the P50 OGIP per km2.
 (2)    Net to Origin’s 70% interest in EP76, EP98, and EP117.
 (3)    Origin is not aware of any new information or data that materially affects the information included in the announcement to the ASX on 15 February 2017 and
        all material assumptions and technical parameters underpinning these estimates continue to apply and have not materially changed.
37        16 August 2018             2018 Full Year Results Announcement
Outlook
                                                            Frank Calabria,
                                                            CEO

38   16 August 2018   2018 Full Year Results Announcement
FY2019 guidance
 Provided that market conditions and regulatory environment do not materially change

 Overall, Origin expects Underlying Profit to be higher and further debt reduction in
 FY2019
 Energy Markets                                                       APLNG (100%)
 •    Underlying EBITDA of $1,500-1,600 million                       •   Production range of 660-690 PJ
      − $80 million impact of absorbing an expected                   •   250-300 operated wells drilled
        3% electricity price increase in NSW;
                                                                      •   Targeting operating breakeven of
      − ongoing retail competition;                                       US$22-26/boe and distribution
                                                                          breakeven of US$39-44/boe
      − modest growth in gas gross profit; and
      − change in treatment of certain electricity
        hedge premiums ($160 million)                                 Corporate/Other
                                                                      •   Costs of $60-65 million at EBITDA
                                                         FY2019
$m                                       FY2018
                                                        Guidance
                                                                      •   Capex (ex-APLNG) of $385-445 million
Underlying EBITDA – pre NSW revenue
forgone and treatment change               1,811      1,740 – 1,840
NSW 3% electricity price increase
                                             -              (80)
absorbed
Electricity hedge premiums                 (160)           (160)
Underlying EBITDA – new basis              1,651      1,500 – 1,600

 39     16 August 2018    2018 Full Year Results Announcement
Dividend

 • The Board has determined not to pay a dividend in respect of earnings for
   the second half of FY2018

 • Subject to Board approval and no material adverse change in business
   conditions, our medium term outlook supports recommencement of
   dividends in FY2019

40   16 August 2018   2018 Full Year Results Announcement
Appendix

41   16 August 2018   2018 Full Year Results Announcement
FY2019 breakeven guidance

100% APLNG (A$m)                                     FY2018            FY2019 guidance1
Capital expenditure – Sustain                          1,105                    1,450
Capital expenditure – E&A                                65                      200
Operating expenses – pre
                                                       1,673                    1,5703
capitalisation

Less: Spot LNG & domestic revenue                     (1,345)                  (1,350)

Operating breakeven                                    1,498                    1,870

Operating breakeven (US$/boe)                            21                   22 – 262
Project finance interest                                418                      460
Project finance principal                               915                      860
Distribution breakeven                                 2,831                    3,190

Distribution breakeven (US$/boe)                         39                   39 – 442

100% APLNG (PJ)                                      FY2018            FY2019 guidance1

Domestic & Spot LNG                                     248                      232

Contract LNG                                            432                      427

Contract LNG (mmboe)                                   57.0                      56.4

 1)   FX rate : FY2018 – 0.78, FY2019 – 0.75 AUD/USD
 2)   Range represents variability around work program scope, operating costs, project refinancing and non oil-linked revenue
 3)   Operating costs estimate reflects royalties payable at the breakeven oil price. Royalties payable increases as oil price increases

42      16 August 2018              2018 Full Year Results Announcement
Statutory to underlying earnings

Reconciliation from statutory to underlying profit

$m                                               FY2018 FY2017 Change

Statutory Profit / (Loss)                               218 (2,226)         2,444

Items Excluded from Underlying (post-tax)

  - Fair value and FX movements                       (410)           96    (506)

  - LNG items pre-revenue recognition                      -         (36)     36

  - Disposals, impairments and restructuring         (394)        (2,836)   2,442

Total Excluded from Underlying (post-tax)            (804)        (2,776)   1,972

Underlying Profit - total operations                 1,022           550     472

Discontinued operations                                 184          150      34

Underlying Profit - continuing operations              838          400      438

43      16 August 2018      2018 Full Year Results Announcement
Accounting for APLNG
                                                           Origin                                                                            Origin Share
                                                                                                                                              of APLNG
                                                            ($m)

Revenue                                                                                                                                         ($m)
                                                             14,604
Cost of Sales                                                                                                Revenue                                2,073
                                                            (11,785)
Contribution                                                                                                 Operating costs                        (668)
                                                               2,819
Other Income                                                        29                                       Underlying EBITDA                      1,405

Operating costs                                              (1,306)                                         Depreciation and Amortisation          (695)

Share of APLNG EBITDA                                                                                        Interest on MRCPS                      (227)
                                                               1,405
Underlying EBITDA (continuing operations)                                                                    Interest on project finance            (193)
                                                              2,947
ITDA of Equity accounted Associates                                                                          Income tax expense                        (83)
                                                              (1,194)
Depreciation and Amortisation     1
                                                                (381)                                        ITDA1                                (1,198)

Underlying EBIT (continuing operations)                        1,372                                         Underlying Profit                         207

MRCPS income                                                       227
Net financing costs                                            (497)
Income tax expense                                              (261)
Non-controlling interest                                            (3)
Underlying Profit (continuing operations)                        838

    1)    Difference represents an elimination of APLNG depreciation related to capitalised MRCPS interest. Refer to note E1.2 of Origin’s
          financial statements for details

   44          16 August 2018           2018 Full Year Results Announcement
Important Notices
All figures in this presentation relate to businesses of the Origin Energy Group (Origin, or the Company), being Origin
Energy Limited and its controlled entities, for the financial year ended 30 June 2018 (the period) compared with the
financial year ended 30 June 2017 (the prior corresponding period), except where otherwise stated.
Origin’s Financial Statements for the financial year ended 30 June 2018 are presented in accordance with Australian
Accounting Standards. The Segment results, which are used to measure segment performance, are disclosed in note A1
of the Financial Statements and are disclosed on a basis consistent with the information provided internally to the Chief
Executive Officer. Origin’s Statutory Profit contains a number of items that when excluded provide a different
perspective on the financial and operational performance of the business. Income Statement amounts presented on an
underlying basis such as Underlying Consolidated Profit, are non-IFRS financial measures, and exclude the impact of
these items consistent with the manner in which the Chief Executive Officer reviews the financial and operating
performance of the business. Each underlying measure disclosed has been adjusted to remove the impact of these items
on a consistent basis. A reconciliation and description of the items that contribute to the difference between Statutory
Profit and Underlying Consolidated Profit is provided in the Operating and Financial Review.
This presentation also includes certain other non-IFRS financial measures. These non-IFRS financial measures are used
internally by management to assess the performance of Origin’s business and make decisions on allocation of resources.
Further information regarding the non-IFRS financial measures and other key terms used in this presentation is included
in this Appendix. Non-IFRS measures have not been subject to audit or review.
Certain comparative amounts from the prior corresponding period have been re-presented to conform to the current
period’s presentation.
A reference to Australia Pacific LNG or APLNG is a reference to Australia Pacific LNG Pty Limited in which Origin holds a
37.5% shareholding. Origin’s shareholding in Australia Pacific LNG is equity accounted.
A reference to $ is a reference to Australian dollars unless specifically marked otherwise.
All references to debt are a reference to interest bearing debt only. Individual items and totals are rounded to the nearest
appropriate number or decimal. Some totals may not add down the page due to rounding of individual components.
When calculating a percentage change, a positive or negative percentage change denotes the mathematical movement
in the underlying metric, rather than a positive or a detrimental impact. Measures for which the numbers change from
negative to positive, or vice versa, are labelled as not applicable.

45     16 August 2018       2018 Full Year Results Announcement
Important Notices (cont)
Reserves
Disclosures of Origin and APLNG’s reserves and resources are as at 30 June 2018. These reserves and resources
were announced on the same date as the release of this presentation in Origin’s Annual Reserves Report for the year
ended 30 June 2018. Petroleum reserves and contingent resources are typically prepared by deterministic methods
with support from probabilistic methods. Petroleum reserves and contingent resources are aggregated by
arithmetic summation by category and as a result, proved reserves (1P reserves) may be a conservative estimate
due to the portfolio effects of the arithmetic summation. Proved plus probable plus possible (3P reserves) may be
an optimistic estimate due to the same aforementioned reasons.

Some of APLNG’s reserves and resources are subject to reversionary rights and an ongoing royalty interest in favour
of Tri-Star. Refer to Section 6 of the Operating and Financial Review released on the same date as this presentation
for further information.

46      16 August 2018      2018 Full Year Results Announcement
For more information

Peter Rice
General Manager, Capital Markets
Email: peter.rice@originenergy.com.au
Office: +61 2 8345 5308
Mobile: + 61 417 230 306

Liam Barry
Senior Manager, Investor Relations
Email: liam.barry@originenergy.com.au
Office: +61 2 9375 5991
Mobile: + 61 401 710 367

www.originenergy.com.au

47   16 August 2018   2018 Full Year Results Announcement
Thank You
You can also read