ALARM 2019 Annual Local Authority Road Maintenance Survey - Asphalt Industry ...
←
→
Page content transcription
If your browser does not render page correctly, please read the page content below
ALARM
    Annual Local Authority
  Road Maintenance Survey

                      2019
        Publication embargo: 00.01 26 March 2019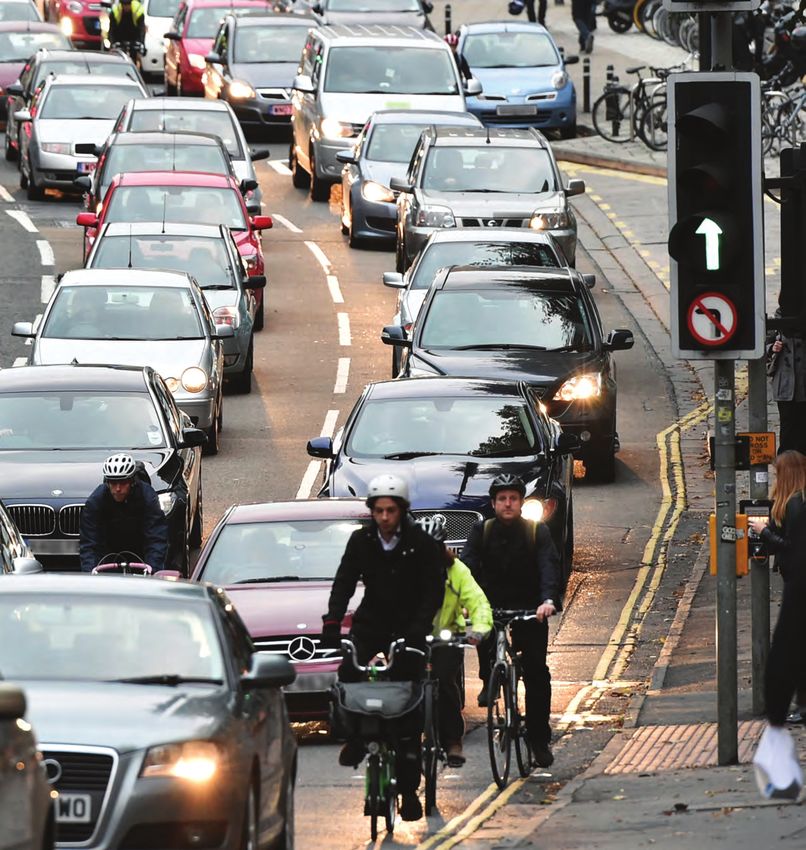
About the ALARM survey Each year the Asphalt Industry Alliance (AIA) commissions an independent survey of local authority highway departments in England and Wales. The aim of the survey is to take a snapshot of the general condition of the local road network, based on information provided directly by those responsible for its maintenance. The data received from local authorities provides a means of tracking any improvement or deterioration and the qualitative feedback received from them provides context. Questions in the survey relate predominantly to the maintenance of the carriageway itself – the road surface and structure – and only that part of the total highway maintenance budget which addresses the condition of the carriageway specifically. The total highway maintenance budget covers other significant areas of expenditure including structural work to bridges, street lighting, cyclical maintenance for example grass- cutting, checking traffic signals and the replacement of street furniture, which are excluded from this survey. ALARM 2019 is the AIA’s 24th annual survey and 64% of authorities responsible for roads in England and Wales responded. This report summarises the key findings. The survey was carried out during December 2018 and January and February 2019. Unless otherwise stated, the findings are based on the financial year 2018/19, ending 31 March 2019. Where these are unavailable, figures for the calendar year 2018 were requested. There are four authorities in England, and one in London, which have Private Finance Initiative (PFI) contracts in place to fund and manage their highway maintenance programmes over a 25-year period. These are not included in the survey. For further information about the ALARM survey contact: AIA Press & Information Office, Park House, 10 Park Street, Bristol BS1 5HX +44 (0)20 7222 0136 | info@asphaltuk.org @AIA_Asphalt | asphaltuk.org
ALARM 2019                01

Contents
Chairman’s introduction                                                2
Key facts                                                              3
Highway maintenance budgets                                            4
    Funding streams                                                    4
    Disparities in funding                                             5
    Winners and losers                                                 5
    Carriageway maintenance                                            6
    Unforeseen costs                                                   6
    Longer term funding                                                8
    Budget shortfall                                                   8
    Maintenance backlog                                                9
Road condition                                                        10
    Road Condition Index (RCI)                                        10
    Structural road condition                                         11
    Potholes                                                          12
    Road surfacing frequency                                          13
    Utility company road openings                                     13
Road user compensation claims                                         14
    North/south divide                                                14
Key findings – ALARM survey 2019                                      16

The ALARM survey 2019 includes the findings of both quantitative and qualitative research. The data
received from local authorities has been extrapolated to represent the 114 local authorities in England             Quotations used in this
                                                                                                                    report are from local
without a PFI, 22 in Wales and 32 in London. The results have been collated, analysed and verified by an
                                                                                                                    authority highway officials.
independent researcher. ALARM survey reports from previous years can be accessed via our website www.
asphaltuk.org. A broad range of other road-related statistics are collated on RoadFile: www.roadusers.org.uk

                                                                                                                      Arrows indicate the
   Acknowledging ALARM
                                                                                                                      direction of change from
   The Asphalt Industry Alliance is happy for journalists, researchers, industry organisations, government
                                                                                                                      ALARM 2018.
   departments and others to use and/or quote the findings of the ALARM survey 2019 and the infographics
   contained in this report. We do ask that it is acknowledged as your source – referencing it as the AIA’s ALARM
   survey 2019 – both in main body copy and in any supplementary notes.

   Please contact our press office on Tel: 020 7222 0136 or email: info@asphaltuk.org if you have any queries
   about this.

© Asphalt Industry Alliance 2019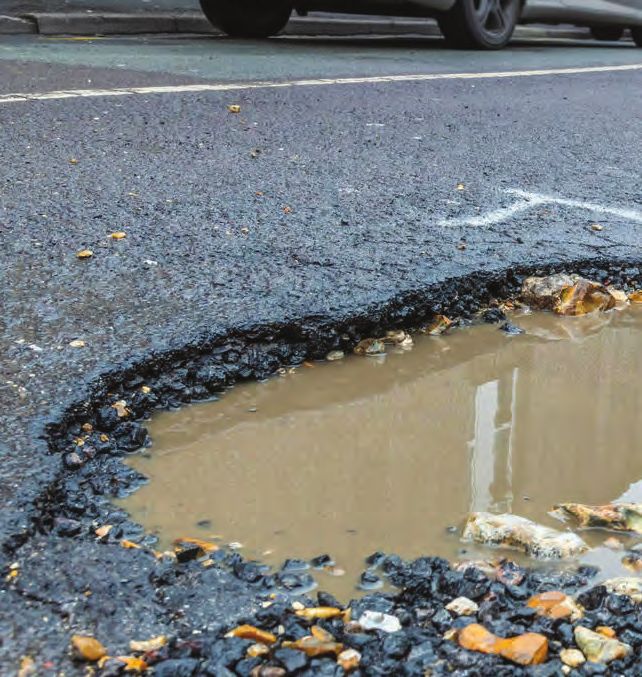
02      ALARM 2019

                                         Don’t stop now
                                         Introduction by Rick Green, Chairman, Asphalt Industry Alliance

L
     ocal authorities have reported an           overall budgets are up, there is still a big   in road conditions. But, the extra money
     increase in their overall highway           discrepancy between the haves and have         coming as it did in the Autumn Budget and
     maintenance budgets for the second          nots. Some local authorities in England        allocated for the remainder of the financial
successive year and there are some early         received highway maintenance pots              year, was out of kilter with best practice and
signs that this is stemming further decline      equivalent to over £90,000 per mile of their   effective highway asset management plans.
in local road conditions.                        individual networks, while a third continue      Yes, there’s been more money, but it’s
  It is encouraging that those in control        to struggle with reduced budgets, with         clear from the 29% increase in the number
of the purse strings have acknowledged           several having less than £9,000 per mile to    of potholes filled in England and London
that long-term underfunding has taken            maintain their local roads.                    that much of this has been used for patch
its toll on the network, leading to a rising                                                    and mend, which does not provide value
bill to put it right. More importantly, they     Targets out of reach                           for money or improve the underlying
have recognised the value that additional        Consequently, the focus on primary routes      structure and resilience of our roads.
investment in roads can deliver.                 continues and achieving target conditions        Last year we called for an additional £1.5
  Of course, it’s a long journey from            on all categories of road still remains out    billion of funding for local roads each year
slowing decline to improving the overall         of reach. To put this into context, if local   for the next 10 years to allow them to be
condition and resilience of the network          authorities had enough funds to meet their     brought up to a condition from which they
and this additional investment could go to       own targets across all road types it would     can be managed in a cost-effective way.
waste if it is not continued. So, our message    give us more than 20,000 miles of improved     We stand by this call. The findings from
is: don’t stop now.                              local roads.                                   this year’s ALARM survey support the need
  Average overall highway maintenance              The outlook for Wales is particularly        for this long-term approach to allow local
budgets have increased by almost 20%,            concerning with a reduction in highway         authorities to maximise the effectiveness of
from £20.6 million reported in ALARM             maintenance budgets and a big jump in          their asset management plans and deliver
2018, to £24.5 million. In England, there is     the amount needed to bring roads up to a       enhanced mobility, connectivity and
a small indication of a brightening picture      steady state. A reminder, if one was needed,   productivity.
with slight improvements reported in road        of how important sustained funding is.
conditions: the percentage of the network          The allocation of the additional £420
in a good state of repair has gone up by         million announced in the November
2%, the equivalent of an extra 3,500 miles       Budget for local roads in England and
of local roads reaching target condition.        London was gratefully received, particularly
  Nevertheless, significant challenges still     in the capital which is facing cuts to its
remain for many local authorities and, while     funding from TfL and reported a decline
ALARM 2019    03

Key facts 2018/19

                            HIGHWAY MAINTENANCE
                                                            AVERAGE HIGHWAY
                            BUDGETS                         MAINTENANCE BUDGETS
                            RANGE/MILE
                            £90k

  2m UTILITIES OPENINGS
                                                                     2086

                                                                    ROADS ONLY
                                                                    RESURFACED
                                                                    EVERY
                                                                    67  YEARS

   ANNUAL CARRIAGEWAY
   BUDGET SHORTFALL:

        £657m
                                                                  £26.7m
                                                                  SPENT DEALING WITH
                       MORE POTHOLES FILLED                       COMPENSATION
                       EQUIVALENT TO 1                            CLAIMS
                       EVERY   17
                                SECONDS

                                                  A ONE-TIME CATCH UP WOULD
                                                  TAKE10    YEARS TO COMPLETE

Detailed key findings can
be found on page 16.
                                                  AND COST
                                                           £9.79bn
04 ALARM 2019
Highway maintenance budgets
L
ocal highway authorities in England
and Wales, including London, are Overall average
responsible for over 204,300 miles of
roads (source: DfT, 2017). This represents highway maintenance
97% cent of the total road network and has Budget 2018/19
a reported asset value of approximately
£395 billion. Includes bridge maintenance and structural work, cyclical
Highway maintenance is just one area of maintenance (such as sweeping, grass cutting, checking traffic
local authority responsibility and feedback signals and replacing street furniture) and maintaining street lighting
suggests the proportion of total expenditure
allocated to this sector in 2018/19 has
ENGLAND LONDON WALES
dropped in all areas to 5.6% in England
(2017/18: 6.3%), 3.0% in London (2017/18: £31.5m £10.6m £7.8m
10.5%) and 2.3% in Wales (2017/18: 3.5%).
The expenditure is funded by central
government – through Transport for
Up from £26.2m Up from £9.2m Down from £8.1m
London (TfL) in the capital and the Welsh
Assembly Government (WAG) in Wales – as
well as local authority funding, including
prudential borrowing, use of capital 14/15 15/16 16/17 17/18 18/19 14/15 15/16 16/17 17/18 18/19 14/15 15/16 16/17 17/18 18/19
reserves and monies collected through
parking fines and other fees.
In England (excluding London)
the reported average local authority Local authority and central government
funding
budget for highway maintenance in
2018/19 increased by 20% to £31.5
million (2017/18: £26.2m), 55% of which 2017/18 2018/19
is funded by central government. This
budget comes predominantly from KEY
n Local
the Department for Transport (DfT),
ENGLAND 45%/55% 45%/55% authority
but also includes other sources such as n Central
Environment Agency grants, regional government
enterprise and growth funding.
Funding streams
DfT funding is split into several pots: some LONDON 27%/73% 68%/32%
is needs-based, which is not ring-fenced,
while others are incentive-based or
bid-for funds, which may be ring-fenced
specifically for highway improvements.
It also includes a share of the additional WALES
£100 million extra for the Pothole Action
34%/66% 29%/71%
Fund for England announced in March
2018 as well as the £420 million additional
highway maintenance pot announced inALARM 2019 05
the November 2018 Budget. Incentive- to withdraw funding to TfL. Only 32% of Winners and losers
based funding was introduced in April funding is now reported as originating from As reported in ALARM 2018, all of the
2016 in England. To secure this element central government sources, down from average totals hide a wide disparity
local authorities must respond to an annual 73% last year, with a huge increase in the between those seeing increased highway
self-assessment questionnaire covering use of council reserves and borrowing. maintenance funding and those local
asset management, resilience, customer Budgets reported by Welsh authorities authorities who have experienced a cut,
satisfaction, benchmarking and efficiency, have seen a slight decrease (4%) to £7.8 with funds diverted to other areas of council
and operational delivery. million in 2018/19 (2017/18: £8.1m). expenditure, notably education and social
The results determined which of three care. In England more than a quarter of
bands they were placed in – and therefore local authorities reported a cut in last year’s
how much from the £151 million incentive Our needs-based funding budgets, while in Wales and in London
funding available in 2018/19 they were isn’t enough to maintain a
allocated – with band 1 at the lowest end steady state. We are having
and band 3 at the highest. to dip into reserves each We’ve managed to
The approach aims to promote year, which clearly isn’t maintain our highway
efficiency improvements and reward sustainable in the long run. maintenance budget this
success: local authorities still in band 1 in year through borrowing
2020/21 will receive no incentive funding but we need more
at all. Our asset stock continues to money from TfL – and
Responses show there has been another grow yet our revenue budget quickly – if the roads in
improvement in the number of local has more than halved in the last the capital are to have
authorities placing themselves in the 10 years. We are doing things any chance of remaining
highest band, which has increased from more efficiently but we can never fit for purpose.
84% last year to 87% this, and none report cover that cut.
they are still in band 1.
In addition, English authorities have
received monies through ‘top-up’ sources
such as the Challenge Fund, National
Productivity Investment Fund and Safer
Roads Fund money for specific (capital)
Highway maintenance
improvement schemes. budget range
Significantly, as reported last year, around per mile of local road
45% of highway maintenance budgets in
England come from local authorities’ own
sources. ENGLAND £6,500 £120,000
per mile per mile
Disparities in funding
Respondents in London have reported
LONDON £8,000 £75,000
a 15% increase in their overall highway
per mile per mile
maintenance budget to an average of
£10.6 million, up from £9.2 million a
year ago. Despite benefiting from some
WALES £3,000 £22,000
additional funding in the November per mile per mile
Budget, London authorities are feeling
the effects of the Government’s decision06 ALARM 2019
Highway maintenance budgets continued
around a half of authorities reported a
year-on-year reduction. This disparity is Proportion of overall budget spent on
particularly apparent when considering
highway maintenance budgets per mile
carriageway maintenance
of local road, which varies from less than Proportion of the overall highway maintenance budget
£9,000 per mile to more than £90,000 per spent on the carriageway itself
mile.
ENGLAND LONDON WALES
Overall, the reported total highway
maintenance budget across England and
54% 57% 58%
Wales has increased by around 20% for
the second successive year to £4.1 billion
(2017/18: £3.46 billion). Figures from a
decade ago reported this annual figure as
£3.1 billion, highlighting that, after some
Down from 56% Up from 49% Down from 63%
years of below-inflationary rises, budgets
are now rising more in line with inflation.
Carriageway maintenance
The percentage of the highway
Actual average budget for
maintenance budget spent on the carriageway maintenance
carriageway itself (the carriageway
maintenance budget) is in line with last
year at an average of 55% across ALARM ENGLAND LONDON WALES
respondents (2017/18: 56%).
Consequently, total carriageway
maintenance expenditure across England
£17.0m £6.0m £4.6m
and Wales in 2018/19 was calculated at
£2.23 billion, up again on last year (£2.04
billion) and the highest figure reported in
Up from £14.7m Up from £4.5m Down from £5.1m
the ALARM survey to date.
The majority of local authorities (84%
14/15 15/16 16/17 17/18 18/19 14/15 15/16 16/17 17/18 18/19 14/15 15/16 16/17 17/18 18/19
of responses) spent all of this with almost
a third (32%) reporting an overspend due
to a wide range of factors including the
an immediate need for maintenance to downpours and hotter drier summers,
effects of adverse weather conditions,
keep the roads safe and serviceable. It is coupled with increased volume and weight
schemes carried over from the previous
extremely difficult for councils to predict of traffic and the age of the network can
financial year and the scope of projects
the percentage of budget required for result in accelerated deterioration and
changing at the point of delivery.
this kind of work but, it is generally agreed unpredicted failures.
The average proportion of the
that around 16% could be considered the The impact is particularly acute on
carriageway maintenance budget spent on
ideal. poorly maintained, less resilient roads,
reactive maintenance (that not planned for
where water can penetrate existing cracks
at the beginning of the year) was 19% in
Unforeseen costs or defects, leading to the formation of
England, 25% in London and 17% in Wales.
Adverse weather conditions, particularly potholes and, in time, undermine the entire
These figures acknowledge that
wetter winters with more intense structure of the road.
unforeseen circumstances can createALARM 2019 07
Highway/carriageway maintenance trends
Total highway maintenance budget Carriageway maintenance
in England and Wales budget needed
(£bn) Annual average per authority (£m)
4.5 18
4.0
15
3.5
3.0 12
2.5
9
2.0
3.1 2.9 2.5 2.9 2.8 3.1 2.8 2.9 3.5 4.1
6
1.5
1.0 3
0.5
0 0
2010 2011 2012 2013 2014 2015 2016 2017 2018 2019 2010 2011 2012 2013 2014 2015 2016 2017 2018 2019
n Total highway maintenance budget in England and Wales n Annual average carriageway maintenance budget needed
Equivalent rate of inflation rise n Annual average budget for carriageway maintenance
Shortfall
One-time catch-up costs Potholes
Estimate per authority (£m) Number of potholes filled (with cost £m)
80 3.0m 2.7m
(£144.3m)
70
2.5m 2.2m 2.2m
60 (£119.6m) (£118.4m)
1.9m 1,860,072
(£99.0m) (£97.8m)
50 2.0m
40 1.7m
1.7m (£102.3m)
1.5m (£90.9m)
30 1.5m
1.4m 1.4m (£94.9m)
20 (£103.5m) (£80.6m)
1.0m
10
0 0
2010 2011 2012 2013 2014 2015 2016 2017 2018 2019 2010 2011 2012 2013 2014 2015 2016 2017 2018 2019
n Annual average budget for carriageway maintenance l Number and cost of filling in potholes
n Annual average carriageway maintenance budget needed (Cost to fill potholes £m)
n Estimated one-time catch-up costs per authority
Linear (estimated one-time catch-up costs per authority)08 ALARM 2019
Highway maintenance budgets continued
There has been a marked increase in
the number of respondents who had to Proportion of carriageway maintenance
cope with unforeseen costs over the last
budget spent on
year in England and London, primarily as
the effects of the Beast from the East have reactive maintenance
been realised. In England the number has (16% considered ideal)
increased from 28% last year to 55% this,
ENGLAND LONDON WALES
while in London it is 64% (2017/18: 54%).
The figure for Wales is slightly lower than
reported last year, when the region had
been hit by the worst flooding for 50 years, 19% 25% 17%
but is still very high at 57% (2017/18: 75%).
The severity of the weather experienced
is reflected in the average additional cost No
Up from 18% change Down from 25%
incurred, which in England has increased
to £2,572,500 (2017/18: £938,600) and in
London to £464,300 (2017/18: £191,200). The
average additional cost in Wales has dropped
Longer term funding
slightly to £353,300 (2017/18: £373,300).
Reported ideal term of funding
Longer term funding England and Wales
All respondents agreed that guaranteed,
longer term funding helps increase
efficiency and provide a more durable road
3
YEARS
5
YEARS
10
YEARS
OTHER
network with the majority indicating that 5
years is the optimum term. 6% 67% 25% 2%
Security of funding helps authorities plan
with more confidence and drive greater Up from 3% Up from 58% Down from 38% Up from 1%
efficiencies. Previous research carried out
by the AIA demonstrated that planned
preventative maintenance is 20 times less
I don’t support a
expensive per square metre than reactive
TotEx would provide move to TotEx. I think it is
work, such as patching and filling potholes.
greater flexibility to deal important to demonstrate the
Advocates of a more holistic approach to
with changing circumstances need for increased funding by
highway maintenance expenditure, in
such as adverse weather and showing how much pressure
which revenue budgets (mostly from a
prioritising outcomes, allowing us there is on revenue budget.
local authority’s own sources) could be
to manage our resources better.
combined with capital funding (mostly
from central government) and allocated
where most needed, believe a TotEx the actual budget they receive.
(combined total expenditure) approach Budget shortfall The shortfall in annual carriageway
would help drive further efficiencies and The shortfall is measured as the difference maintenance budget reported this year is
improve conditions. Around 57% of between the annual budget that highways £657 million, the equivalent of an average
respondents would be supportive of such a departments calculate they require to keep funding gap of £3.9 million per authority. In
move with others citing causes for caution. the carriageway in reasonable order and England the shortfall has widened by 21%ALARM 2019 09
from £3.4 million per authority last year to
£4.1 million this, while in London the figure
has increased by a third from £3.0 million
Budget shortfall
2017/18 to £4.0 million in 2018/19. Average annual carriageway maintenance budget received and
In Wales, the average shortfall reported average shortfall, £m (2017/18 in brackets)
declined by 11% from £3.1 million last year
to £2.8 million this.
ENGLAND £17.0m 4.1 (£14.7m/£3.4m)
One again, the real extent of the
shortfall could be being masked by
the fact that 40% of English and Welsh LONDON £6.0m 4.0 (£4.5m/£3.0m)
authorities report transferring capital funds,
intended for highways improvements, to
supplement traditional revenue budgets WALES £4.6m 2.8 (£5.1m/£3.1m)
for maintenance work. Of course, carrying
out road maintenance as part of capital
0 5 10 15 20 £25m
works, still leads to efficient highway
n Funding received n Shortfall
improvements, regardless of funding
stream.
Addressing the shortfall
Each year the ALARM survey asks highway Addressing the shortfall
departments to estimate how much it Average one-off investment required to clear carriageway
would cost to bring their road networks maintenance backlog per authority, £m (2017/18 in brackets)
up to scratch (assuming they had the
resources in place to make it practical to
do so as a one-off project). This would be £69.9m (£72.3m)
ENGLAND
the condition from which longer term
and cost-effective, planned preventative
maintenance programmes could be put LONDON £31.9m (£14.6m)
into place, reducing the future cost of more
extensive repairs or replacement.
The estimate for this one-time “catch-up” WALES £36.3m (£27.4m)
cost has grown by approximately 5% to
£9.79 billion from £9.31 billion reported 0 20 40 60 £80m
last year. This is an average of £69.9 million
per authority in England; £31.9 million in
London and £36.3 million in Wales.
Maintenance backlog Maintenance backlog
Highway departments reported that it
Average number of years needed to clear
would now take 10 years to get local roads
maintenance backlog
back into a reasonable steady state, if
adequate funding and resources were in
place, down on the 14 years reported in
10 years (2017/18: 14)
ALARM 2018.10 ALARM 2019
Road condition
Well-managed highways categories – GREEN, AMBER and RED carriageway in poor overall condition,
The majority of local authorities (England: 81%, – across three road classes – principal, likely to require planned maintenance
London: 90%, Wales: 66%) are now compliant classified (non-principal) and unclassified within a year or so.
with the Well-Managed Highway Infrastructure – and compares current road conditions English councils’ performance against
Code, which came into force in October against these targets. targets improved over the last year, with
2018. The Code aims to support a maturing Local authorities can adjust the levels being reached or exceeded in more
approach to highway infrastructure asset precise definitions of the categories categories, despite some targets being
management based on the establishment to reflect the individual nature of their raised. Across all classes of road England
of local levels of service through risk- networks. However, in general, GREEN showed a slight improvement in conditions
based assessment. It enables authorities to defines lengths where the carriageway over last year, with a small reduction in
develop their own levels of service in line is in a good state of repair; AMBER is for the percentage of the network classed as
with local needs, priorities and affordability. lengths where some deterioration is AMBER and RED and a 2% increase in the
apparent which should be investigated to number of roads classed as GREEN.
Road condition index determine the optimum time for planned In Wales there was an improvement in
The RCI index features three condition maintenance and RED for lengths of the number of roads classed as GREEN,
Road Condition Index KEY: n GREEN: carriageway in a good state of repair
n AMBER: carriageway where some deterioration is apparent
by road category (%) n RED: carriageway in poor overall condition – likely to require
maintenance in the next 12 months
PRINCIPAL NON-PRINCIPAL UNCLASSIFIED
TARGET ACTUAL TARGET ACTUAL TARGET ACTUAL
England ≥75 74 ≥73 70 ≥64 55
GREEN London ≥65 65 ≥63 64 ≥59 54
Wales ≥74 71 ≥71 67 ≥58 40
England ≤23 23 ≤22 24 ≤24 29
AMBER London ≤24 25 ≤27 24 ≤27 25
Wales ≤22 25 ≤22 27 ≤30 34
England ≤3 3 ≤5 6 ≤14 15
RED London ≤10 9 ≤7 11 ≤22 21
Wales ≤4 4 ≤7 6 ≤13 14
Up from ALARM survey 2018 Down from ALARM survey 2018 Same as ALARM survey 2018ALARM 2019 11
mirrored by a reduction in those classed as
AMBER and RED.
In contrast, the figures reported for
Road condition
London indicate a decline in the condition by road category (%)
of the network with 55% marked as GREEN
compared to 62% last year. London also has
2017/18 2018/19
the highest percentage of principal roads
12 10
marked as RED, with 9% in this category
OVERALL:
compared to 3% in England and 4% in
ENGLAND,
Wales.
LONDON 26 62 27 63
This road report card underlines
& WALES
that there is continued prioritisation on
principal roads. The real impact of this on
the resilience of the overall local network
becomes more apparent when the RCI
figures reported are overlaid onto road
lengths. For example, English authorities’ 12 11
target of 75% of principal roads to be
classed as GREEN, equates to just 11% of
ENGLAND 26 62 25 64
England’s local road network in mileage
terms.
Extrapolating the condition numbers
over the whole of the local road network
across England, Wales and London,
highlights that there has been little
21 19
movement on the overall condition of
the network and there are still more
than 22,600 miles classed as requiring LONDON 62 55
17
maintenance within the next year or so, 26
compared to the 24,000 reported last year.
Structural road condition
Structural maintenance is required when 13 12
the road condition has deteriorated
beyond a level which addressing surface
WALES 57 61
issues only can remedy. 30 25
The picture is mixed, with improvements
in some areas and further decline in others.
Overall, around 55% of the local road
network in England and Wales is reported
KEY:
to be in good structural condition (with 15
n GREEN: carriageway in a good state of repair
or more years of life remaining), equivalent
n AMBER: carriageway where some deterioration is apparent
to 112,079 miles. A quarter (50,705 miles) is n RED: carriageway in poor overall condition – likely to require
reported to be in adequate condition (5-15 maintenance in the next 12 months
years of life remaining) and 20% – 41,57512 ALARM 2019
Road condition continued
miles – in poor condition and having less 1,878 per authority in 2017/18 to 2,711 in number of potholes formed across the
than five years of life remaining. 2018/19 – a 44% increase year-on-year. network. With the additional funding
Around 90% per cent of authorities awarded by DfT in the November Budget
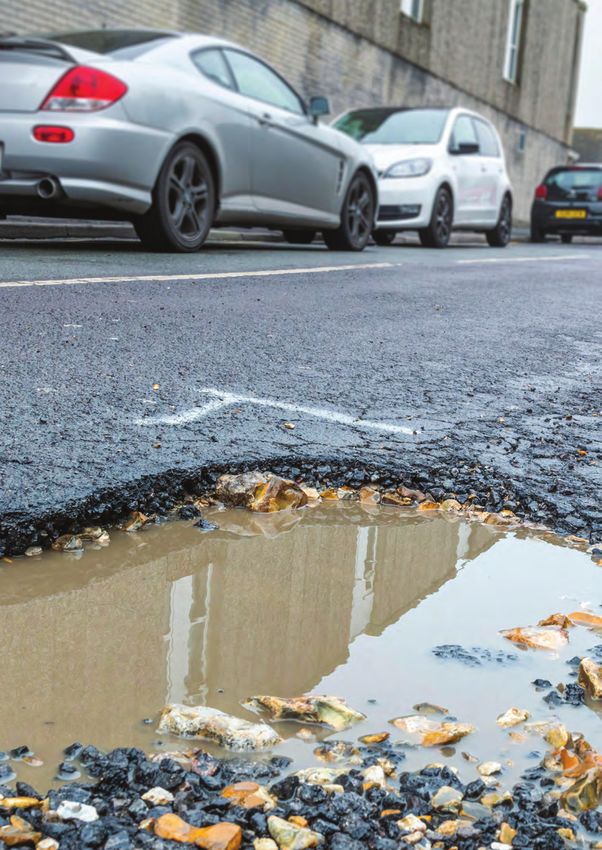
Potholes responding to the ALARM survey stated needing to be allocated by the end of the
Potholes are symptomatic of poorly that their definition of a pothole’s diameter financial year, some local authorities were
maintained roads and can point to and depth remains the same, with over only able to spend much of the additional
underlying structural issues. three quarters using the guideline depth of sums received on filling in potholes –
After four years of decline, the total 40mm (or less) to define a pothole. As the despite this flying in the face of asset
number of potholes filled in the last year effect of a pothole can vary dramatically management principles.
jumped by 24%, from 1.5 million in 2018, depending on its location and the nature The number of potholes filled by Welsh
to more than 1.86 million this year, the of the traffic on the road, depth definition councils, which did not benefit from the
equivalent of one pothole being repaired is not always the only means of prioritising additional funding allocated by DfT during
every 17 seconds in England and Wales. repairs. the year, fell by more than half on the
The biggest increase was reported by Qualitative feedback reported that previous year’s figures from an average
London authorities, with the average intense rainfall last winter, followed by of 5,976 per authority reported in ALARM
number of potholes filled climbing from a hot, dry summer, contributed to the 2018 to 2,531.
Structural road condition KEY:
GOOD: 15 years’ or more life remaining
Percentage of roads in good, adequate and poor condition ADEQUATE: 5-15 years’ life remaining
POOR: less than 5 years’ life remaining
16/17 17/18 18/19 16/17 17/18 18/19 16/17 17/18 18/19
ENGLAND
53% 54% 55% 30% 28% 24% 17% 18% 21%
LONDON
45% 51% 45% 39% 26% 29% 16% 23% 26%
WALES
51% 55% 58% 31% 28% 30% 18% 17% 12%ALARM 2019 13
The disparity in cost between filling
potholes as part of a planned programme
of carriageway repairs and as a reactive
Potholes
repair is again apparent. Taking an average
Average number of potholes filled per local authority,
plus costs to fill as part of a planned programme and
cost for filling a pothole across each region,
as a reactive repair
the total amount spent in England and
Wales last year is estimated at £97.8 million
PLANNED REACTIVE
COST COST
up from £94.9 million reported in ALARM
2018, despite the cost of filling a pothole
reducing. ENGLAND
15,067 £41 £65
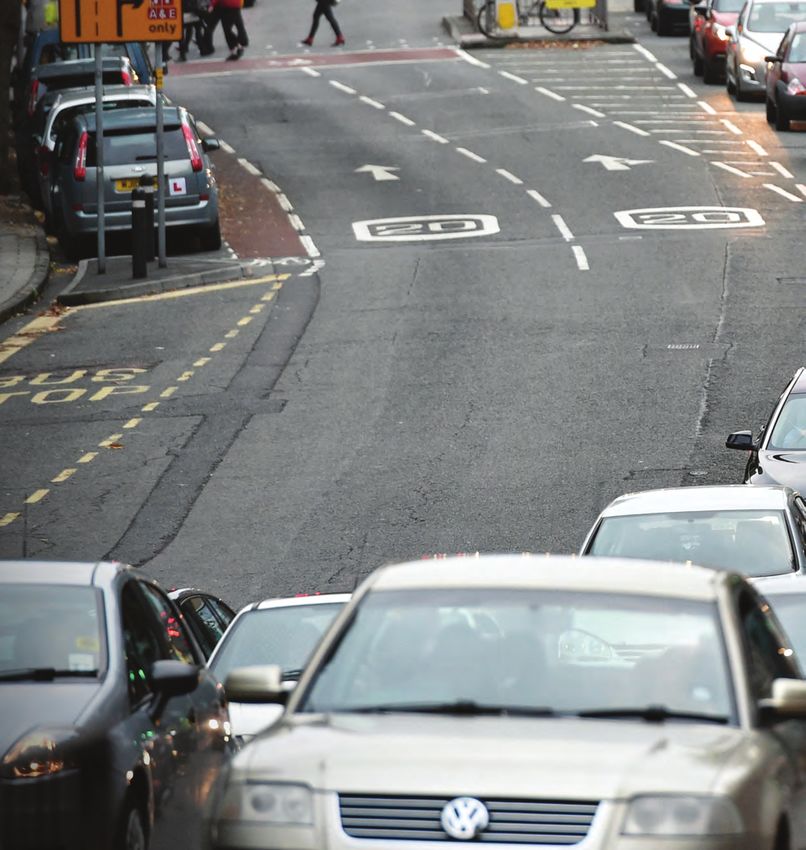
Road surfacing frequency
Replacing the surface layer of roads at
regular intervals maintains an appropriate
LONDON 2,711 £42 £64
level of grip, vital for road safety, and guards
against water ingress and freeze-thaw
effects by maintaining a weatherproof seal
WALES 2,531 £32 £70
on the road’s surface.
Taking into account the lifespan of
particular materials, the type of road
and the level and nature of its traffic,
the recommended frequency of road
resurfacing is between 10 and 20 years – an Road surfacing frequency
ideal only achieved on principal roads in Average frequency (years) of surfacing by road
London. category with change from 2017/18
All councils have seen an improvement
in road surfacing frequency reported, on All classes Principal Non principal Unclassified
average, for all classes of road. In England it
ENGLAND
has gone from once every 92 years, to once
79 37 56 99
every 79 years. In London the improvement
is from once every 31 years to once every
28, while in Wales the figure has dropped
to once every 59 years from once every 71 LONDON
reported last year.
28 19 24 29
No change
Utility company road openings
The number of utility openings increased
by nearly 10% over the last year to more
WALES 59 42 40 74
than 2 million in England and Wales.
Opening a road to create a trench can
reduce its structural life by up to 30%
and the continuing high level of utility received) are completed in accordance addressing premature works associated
openings in England and Wales can with legislative requirements, local with utilities openings. This amounts to
have a detrimental effect. Even though authorities are spending an average of 8% an average of £1.1 million per authority or
the majority (89% based on responses of their carriageway maintenance budget £181.4 million in England and Wales.14 ALARM 2019
Road user compensation claims
Road user compensation claims
Overall, the amount of time and money
spent settling claims has declined on last
Utility
year. However, the picture in England company ENGLAND LONDON WALES
differs with local authorities reporting an openings
increase in the total cost of claims due to
Number of utility
rising staff costs – despite the amount paid
out falling by 9% from £6.7 million last year
openings in past 14,808 7,804 3,691
year (average per
to £6.2 million this. authority) (13,252) (10,004) (5,112)
The figures indicate that almost 89%
of claims relate specifically to pothole
damage, up from 80% last year.
North/South divide Road user compensation claims
Local authorities in the North have
Number of claims in past year (average per authority) plus cost (£)
responsibility for almost half (45%) of the of dealing with claims
local road network in England and Wales,
but receive, on average, a third less overall
highway maintenance budget than their
535 COST OF
CLAIMS
STAFF
COSTS
TOTAL
COST
(259)
southern counterparts. In other words, for ENGLAND
every £3 allocated to highway maintenance £6.2m £16.3m £22.5m
in the South, £2 was allocated in the North. 14/15 15/16 16/17 17/18 18/19
(£6.7m) (£12.8m) (£19.5m)
North/South
divide
80 COST OF
CLAIMS
STAFF
COSTS
TOTAL
COST
LONDON (43)
£444k 3.2m £3.6m
14/15 15/16 16/17 17/18 18/19
(£565k) (£7.6m) (£8.2m)
80 COST OF
CLAIMS
STAFF
COSTS
TOTAL
COST
WALES (34)
£251k £330k £581k
14/15 15/16 16/17 17/18 18/19
(£35.2k) (£555k) (£590k)
The North/South divide split
is based on a University of
Sheffield definition, 2007We were, of course, very grateful for
the extra money we received in the
November Budget but the time pressure
that came with it flies in the face of asset
management. We ended up using it to
deliver patching, which does not provide
good value for money in the long term.
We have managed to maintain a
steady state on our roads but we
just won’t be able to continue to
The worse the condition of our do so indefinitely without more
roads, the more claims we receive. funding.
These then take time and money
to resolve, diverting our resources
from where they are needed most.
We are approaching a tipping
point fairly soon and more full-
scale reconstruction will need to
be carried out.16 ALARM 2019
Key findings
TOTAL* England** London Wales
Percentage of authorities responding 64% 72% 50% 45%
Highway maintenance budgets
Average highway maintenance budget per authority £24.5m £31.5m £10.6m £7.8m
Percentage of highway maintenance budget spent on carriageway 55% 54% 57% 58%
Average carriageway maintenance budget £13.5m £17.0m £6.0m £4.6m
Shortfall
Shortfall in annual carriageway maintenance budget £657.0m £467.4m £128.0m £61.6m
Average annual carriageway maintenance budget shortfall per authority £3.9m £4.1m £4.0m £2.8m
Estimated time to clear carriageway maintenance backlog 10 years 10 years 9 years 8 years
Estimated one-time catch-up cost £9.79bn £7.97bn £1.02bn £797.5m
Estimated one-time catch-up cost per authority £58.2m £69.9m £31.9m £36.3m
Road condition
Frequency of road surfacing (all road classes) 67 years 79 years 28 years 59 years
Number of potholes filled over past year 1,860,072 1,717,638 86,752 52,682
Average number of potholes filled per authority last year 11,072 15,067 2,711 2,531
Average cost to fill one pothole – planned £39.80 £40.70 £42.10 £31.50
Average cost to fill one pothole – reactive £65.10 £64.70 £63.60 £69.60
Total spent filling potholes in past year £97.8m £90.5m £4.6m £2.7m
Compensation claims
Amount paid in road user compensation claims £6.9m £6.2m 444k £251k
Staff costs spent on claims (per year) £19.8m £16.3m £3.2m £330k
* England, London and Wales Up from ALARM survey 2018
** excludes London Down from ALARM survey 2018
Same as ALARM survey 2018About the AIA
Asphalt Industry Alliance
The Asphalt Industry Alliance (AIA) is a partnership of the two principal bodies which
represent the suppliers of raw materials used to produce asphalt, as well as asphalt
producers and laying contractors: the Mineral Products Association (MPA) and Eurobitume
UK. It draws on the knowledge and resources of each association and its members.
The AIA was established in 2000 to increase awareness of the asphalt industry and
its activities, and the uses and benefits of asphalt. Asphalt is the generic term used to
refer to the range of bitumen coated materials available in the UK that are used in road
construction and surfacing. Asphalt also has other, non-road applications such as airport
runways, sports arenas and parking areas.
Mineral Products Association
MPA Asphalt is part of the Mineral Products Association (MPA) – the trade association
for the aggregates, asphalt, cement, concrete, dimension stone, lime, mortar, and silica
sand industries. It continues to have a growing membership since its formation and is the
sectoral voice for mineral products.
MPA Asphalt represents the interests of its asphalt producer and contractor members
through representation and liaison with national and European clients, specifiers,
regulators, researchers and standards bodies as well as with trade associations from
other countries and related industry sectors. It also funds research into asphalt and its
uses and operates the Asphalt Information Service which provides general guidance and
information on the use of asphalts in the wide range of their applications.
Eurobitume UK
Eurobitume UK is the trade association of the UK bitumen supply industry and its
members produce most of the UK’s bitumen. Almost all of this is used in the construction
and maintenance of bituminous, or asphalt roads, which account for over 95 per cent of
all UK roads.
Eurobitume UK is a consultative body formed to promote the technical benefits of
bitumen to the construction industry; to provide the industry with information and
advice; and to fund research into bituminous products. It also works with contractors and
authorities on issues relating to the use and recycling of bituminous materials.
It is involved in the development of industry policy on quality assurance and standards
relating to issues such as safety, storage and the handling of bitumen as well as the
development of specifications and test methods for bitumen.
Picture
Cover: © 1000words | Dreamstime.com
Page 15: Geoff Smith / Alamy Stock PhotoAIA Press & Information Office Park House, 10 Park Street Bristol BS1 5HX +44 (0)20 7222 0136 info@asphaltuk.org @AIA_Asphalt asphaltuk.org
You can also read