Qreport the - the Q report
←
→
Page content transcription
If your browser does not render page correctly, please read the page content below

V i c t o r i a R e a l E s t a t e M a r k e t Pe r f o r m a n c e I n s i g h t s
                                   Q4 2019

                    the

                             Q                             report

Fergus Kyne PREC*, B.Ed.                                                       Dirk VanderWal
REALTOR®                                                                            REALTOR®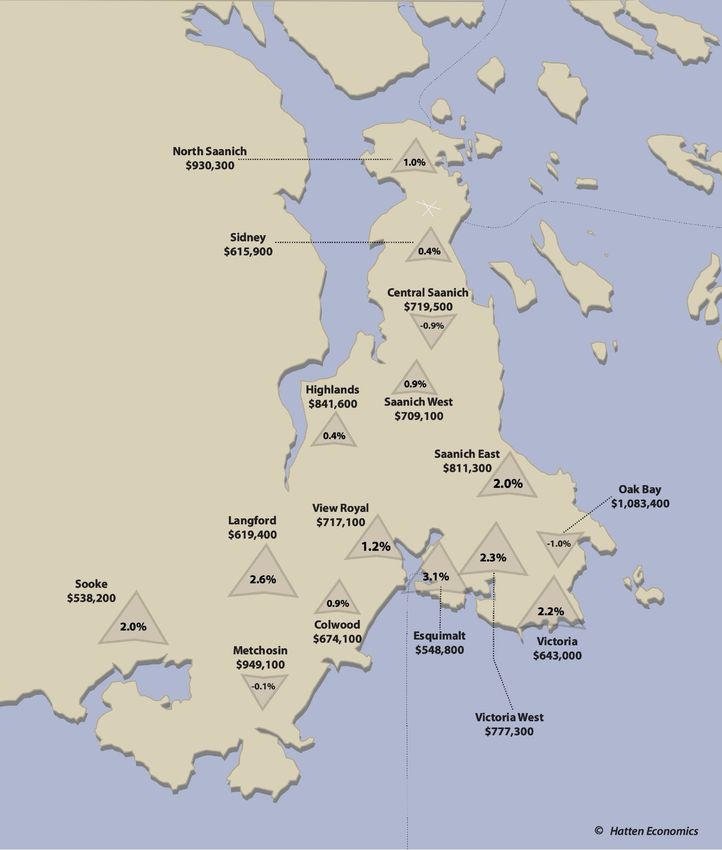
intro duc t io n

Hello again and Happy New Year to our growing group of readers and online
subscribers. May 2020 be all you've said it will be for you and yours.

We are proud to say that this edition of The Q Report represents a full calendar
year of publication for us and our fifth opportunity to offer our detailed insights
into the Victoria real estate market. We are discovering the value in drawing on
our growing back catalogue of data and inquiries, and we are extremely proud
that much of the analysis we are producing is unique to The Q Report and not
studied and interpreted in the same way anywhere else. We have appreciated
your feedback and your questions. For those who like to follow trends over
time, it's also a great time for a reminder that all our past reports are available
in digital form at VictoriaQReport.com.

Please help us continue to grow our subscriber base by sharing The Q Report
with someone you know, and don't hesitate to reach out to us to have any of
your specific questions answered or to suggest a topic.

                                                    — Dirk & Fergus

   list o f t e r ms

Assessed Value              BC Assessment’s value for taxation based on
                            property characteristics and classification

B-20 Stress Test            A federally mandated requirement for lenders to
                            ensure borrowers are protected from ‘rate shock’
                            by requiring borrows to qualify for financing at a
                            higher rate than the actual rate on the mortgage

Detached                    Single-family detached dwelling

Listing Discount            The difference between original list price and final
                            sale price, expressed as a percentage

Luxury >$1M                 ‘Luxury’ properties, comprised of detached and
                            attached dwellings trading over $1M

PPSF                        Price Per Square Foot

Strata                      Attached dwellings such as condominiums and
                            townhouses

YoY                         Year over year; comparing the current quarter to
                            the same quarter last year unless otherwise noted.
                                              1
1 mar ke t                    o v e rv i e w

Detached
Average Days to Sell                                                                                Days to Sell
Market times are up once again. We’ve measured an
                                                                  70
increase of around 10 days YoY each quarter since the end
                                                                  60
of 2017, across all categories. Why are things generally
                                                                  50                                                                                Average
taking longer to sell? Listing inventory has been gradually
                                                                  40
improving, giving buyers more choice and allowing them
                                                                  30
more time to buy. These market times may seem high in
                                                                  20
comparison to recent years but, believe it or not, they are
                                                                  10
still below the 10-year average, as shown in the chart at right
                                                                  0
(for a real eye-opener on the relationship between available

                                                                       2009
                                                                              2010
                                                                                     2011
                                                                                            2012
                                                                                                   2013
                                                                                                          2014
                                                                                                                 2015
                                                                                                                        2016
                                                                                                                               2017
                                                                                                                                      2018
                                                                                                                                             2019
listing inventory and market times, compare this chart to the
one on page 4).

If you’re listing your home, do you have a specific expectation as to when it
should sell? When you speak with us, we can provide you with a timeline
expectation matched with a marketing plan.

Median Sale Price
Median sale prices have continued to exhibit the sort of predictability that is
always welcome news for market participants. Detached homes under $1M
showed a little rise after a headline-grabbing drop in Q3. Strata properties are
holding steady, and the luxury segment is down from Q4 2018 but posted
quarterly gains throughout the year after starting out significantly lower in Q1
2019.

Average Price per Square Foot
Not surprisingly, PPSF figures are closely echoing median sale price figures,
with slightly larger gains in detached dwellings compared to strata. Long-term,
strata PPSF figures are gaining more steadily than detached or luxury
segments, with demand driven by more accessible price points and availability
of new product (for more on PPSF trends in new strata developments, check
out this edition’s feature on page 7).

Listing Discount
Listing discounts are shrinking YoY, and quarter over quarter, for detached
properties under $1M. Taken together with the modest increase in median sale
price, we may be seeing early signs of tightening in this market segment.
Listing discounts on strata properties show no change from last year but
recovered over the course of 2019 after a Q1 dip. Similarly, the over-$1M
market was in nearly the same position in Q4 2019 compared to Q4 2018, after
dropping earlier in the year and coming back up over subsequent quarters.

                                             3
Spring Market Predictions: Return of the Roaring ‘20s?
‘Big picture’ real estate market drivers — such as persistently low unemployment (Greater Victoria boasted the country’s lowest
unemployment figures in Q3), strong consumer confidence, and the Bank of Canada maintaining inflation at its 2% target rate —
point to a stable start to 2020. Doomsday talk of an impending recession seems to have dropped from a rolling boil to a low
simmer, with the Finance Minister going so far as to call talk of a recession “irresponsible” in late December. However, the yield
curve for Canadian bonds remains inverted as of the end of 2019 — a condition which usually occurs when the economy is in
recession — leaving market watchers wondering what happens next.
For the housing market, the silver lining of the inverted yield curve is the ongoing availability of low fixed 5-year rates, resulting in
unbelievably small spreads between fixed and variable rate products. Few are predicting a substantive rise in rates over the course
of 2020, in light of pockets of global economic uncertainty including Brexit and ongoing international trade disputes.
Consumers are now comfortably adjusted to the B-20 stress test and the Prime Minister already made good on his election
promise, instructing his Finance Minister to go back and take a look at tweaking the criteria, which may lead to some loosening of
borrowing restrictions.
We expect these socioeconomic factors to lead to higher demand in the 2020 spring market. Listing inventory has recovered
steadily from its lowest point, but remains below the 10-year average, as shown in the chart below.
With supply and demand being at odds, we predict a return to
Average Number of Monthly Active Listings more competition among buyers for properties in entry-level
and mid-level price points. We may see notable price gains in
5000 segments with acute supply shortages. The higher end of the
market, by contrast, will likely continue to be soft.
3750
Average Considering Selling?
2500 Informed pricing, calculated timing, and intelligent
communication to prospective buyers are all critically important
components for a successful sale in a tight market. We did a
1250
distribution analysis in the last edition of The Q Report, looking
at how many sales occurred at a given percentage of asking
0
price. We suspect that next time we revisit the topic, we may see
2009
2010
2011
2012
2013
2014
2015
2016
2017
2018
2019
an even higher proportion of sales going over the sellers’
asking price than in 2019.
Considering Buying?
Having a flexible yet strategic approach will give you every chance of getting the property you want. Remember, it’s not just about
price. Terms matter and relationships matter. Make sure you hire a representative deeply familiar with your market and agile
enough to get your offer the attention needed to close the deal.
42 hom e pr i ce i n dex ® tre n d s
Overview
Each quarter, we examine YoY price trends in the MLS® Home Price Index®
(HPI®), which tracks the value of statistically-average ‘notional’ homes in
different areas over time, using MLS® sales data.
In this installment,
the YoY values show
far less movement
than regular readers
will be used to
seeing. The general
trend was modest
gains in most areas
around the region,
with the majority
showing less than
1% change since the
end of last year.
This is no surprise,
echoing our Market
Overview for Q4 (on
pages 2-3 of this
edition), where we
demonstrated how
the past two years
have been a steady
return to relative
equanimity for
Greater Victoria’s
real estate market.
Numerous metrics
have moved back
toward their 10-year
average levels.
5Gainers
Esquimalt’s HPI® value gained the most YoY at +3.1%. If you have been
a regular reader, you may recall that we highlighted Esquimalt’s
performance in our Q3 HPI® trends report, also pointing out its
competitive edge in maintaining the least expensive benchmark value of
all core municipalities. Langford, Victoria proper, and Victoria West all
recorded gains in their HPI® benchmark values of more than 2% over Q4
2018 as well, as they also continued to attract interest from buyers.
Modest Decline
The only ‘notable’ decline in benchmark value in the year-end HPI® data
was barely notable at all. Oak Bay’s HPI® benchmark value dropped 1%
YoY. As we have noted before, the predominantly single-family
detached housing stock, much of which is valued at over $1M, has
found itself left behind a little as condos and areas which offer more
accessible price points have pulled ahead over the past few years.
Also of Interest
North Saanich, which we have tracked depreciating in lockstep with Oak Bay
through several quarters — for similar reasons — finally bucked the trend of YoY
losses in HPI® value, by returning a 1% gain. We will continue to update these
trends and see if Oak Bay follows suit in the new year.
Summary
Areas within the Capital Region that have more affordable HPI® benchmark
values and those with more diverse mixes of property types continue to lead
the pack in HPI® growth, albeit more conservatively than before.
Let us use our specialized expertise in tracking and interpreting Home Price
Index® values to help you make the best-informed decision, whether buying or
selling. Make an appointment today to see how we can apply this tool to
illuminate your property’s value for sale or show you pricing trends for the
neighbourhood in which you’d like to purchase.
63 Q4 feat u re : c o n d o p re sal e s
Overview
For this quarter’s feature, we analyzed hundreds of pre-construction
and new construction condo sales (presales), examining changes in
PPSF of MLS®-reported sales data from initial sales, through
resales, up to present day. Many new condo developments are sold
exclusively by developers’ in-house salespeople, leaving some gaps in the
MLS® data, but we were able to include nearly 900 individual sales from over a
dozen projects. We also compared the performance of resale price changes
against the MLS® HPI®, to see if presale purchasers were ‘beating the market’.
We Thought You’d Like to Know
‣ Is buying a condo at presale pricing a better investment than a conventional
resale purchase?
‣ If purchasing a presale, when is the ideal time to sell?
‣ Is it still worth purchasing pre-construction units in 2020?
Average PPSF, New Units, Dollars
A Better Investment? Average PPSF, Other Resales, Dollars
HPI Condo Index Value, Points
Here are some of our key findings:
$800 350
‣ Average PPSF started out higher for new construction than
for resales. These higher values were maintained over time, $700 300
$600
but generally didn’t outperform the HPI®. 250
‣ New units, especially in the city’s core, fared the best of all, $500 200
blown along by strong market tailwinds through 2016-17. $400
150
Many purchasers who got into buildings like Promontory, $300
100
Mondrian, Duet, or Union when pre-construction pricing was $200
under $500/sq. ft saw a massive lift. The latter two buildings $100 50
beat the HPI® index by up to 12% in their first few years of $0 0
2014
2015
2016
2017
2018
2019
resales.
‣ For example: one third-floor unit in Union we looked at
was originally purchased when built for $276K ($490/sq. ft) and traded
again in Q3 2019 for $462K ($818/sq. ft), going up in raw value by
approximately 68%, but also beating the HPI® growth for the same time
period by 7%.
‣ Buildings with short-term/vacation rental provisions outperformed all others.
However, we expect this will likely lessen over time, as a combination of
licensing fees, additional taxes, and reluctance from lenders toward short-
term rental units have somewhat dampened investor demand.
‣ Buildings further from the city’s core ultimately ended up seeing similar
appreciation to those closest to downtown, but it took more time. Although
these buildings did not outperform the HPI®, values were still above the rest
of the resale condo market.
7The bottom line: presale purchases can offer the potential for a better return
on investment than conventional resales but with the caveats that the purchase
price must be reasonable in the larger context of prices for comparable resale
units, and the purchaser must be aware of how the building’s location and
amenities are most likely to affect future resale.
When is the Best Time to Cash Out?
YoY % Change in Value
After totaling the average price changes by year, we found the
15%
numbers confirmed our firsthand experience: increases in
market value for new construction tended to slow down after 12%
year 4, as the market recognizes the ‘newness’ of the product
9%
wearing off. This first chart, at right, shows the average YoY
change in value for all sales. 6%
3%
There are distinct peaks at year 1 and the highest in year 3,
0%
although prices increase 9-12% YoY throughout the first four
Presale
Year 1
Year 2
Year 3
Year 4
Year 5
Year 6
years. By years 5-6, annual gains drop off to less than half of
those in year 3.
Price Performance,
% Change from Presale Price
50% Next, price performance by year, shown as a
percentage above the original presale price,
40% is depicted in the chart at left. As the YoY
30% chart above illustrates, the first and third
years show the steepest climbs — each over
20%
10% — with the second and fourth not far
10% behind at around 9% each. After year 4,
though, notice how the steep climb levels
0%
right off.
Presale
Year 1
Year 2
Year 3
Year 4
Year 5
Year 6
Year 7
We compared price performance against the HPI®’s Price Performance, % of Home Price Index®
performance, as well. As mentioned earlier, a small handful 6%
of stratas consistently performed better than the index.
However, the overall average in the chart at right shows us 0%
that after the first year, new construction tended to slightly
underperform compared to growth of the HPI® over the -6%
same period of time. A small lag should be considered
-12%
acceptable, given the higher price point; however, after
year 4 these sales are more than 10% short of what the HPI®
-18%
tells us the rest of the market is doing, falling as much as
Presale
Year 1
Year 2
Year 3
Year 4
Year 5
Year 6
Year 7
16% lower by year 7.
8Conclusions
Assuming a savvy investor’s goal is to maximize yield versus time, the best
windows for a sale would be:
‣ The first year after completion: one could quickly take a financial gain and
move into another investment. According to the averages, they would have
beat the HPI® growth trend for the year by 3% and realized a gross increase
in value of over 10%.
Or,
‣ Years 3-4: one could attain the maximum short-term gains from the original
purchase price (+40% or more), getting out before price appreciation
plateaus beyond year 5 and minimizing the HPI® performance gap at around
-5% to -8% before it sinks into double-digit territory.
Is it Still Worth Purchasing Presale Condos in 2020?
We did find plenty of instances where presale purchases have beat the market
in the past; however, an increasing number of developers have started
engaging in premium pricing strategies for their presale units. In some cases,
they appear to be pricing units where they believe the market will end up by
completion or occupancy, rather than offering purchasers a discount for ‘new
pricing’ in exchange for their faith and patience. Skeptical? As of the end of
2019, the average PPSF for presold condos on MLS® was $717, 45.7% higher
than the average resale PPSF of $492 — with some units even asking upwards
of $1000/sq. ft.
This isn’t to say that there aren’t still opportunities for buyers, but you’ll want a
knowledgeable, well-informed professional to take an objective look at your
purchase in the context of your short- and long-term investment goals and
advise you in making a sound decision.
Thinking about getting in on a pre-construction condo deal? Or thinking about
listing an investment unit for resale? Make an appointment today for a
complimentary analysis of your specific opportunities.
94 oppo rt u ni ti e s
sellers
‣ Early Birds: Don’t wait to get a jump on the spring market. Savvy buyers start
looking as early as January, and the Victoria market doesn’t historically wait
for the full spring bloom to appear before sales volumes take off. Not in a
rush? Book a consultation with us to start your listing prep ahead of the pack
for a spring sale.
‣ Rental Restricted Condos: Some good news for owners of rental restricted
condos, as the BC Government extended the exemption from the
Speculation & Vacancy Tax through 2021. You may have more time to keep
your unit exempt from the additional tax but if you were considering
divesting, it’s still a good time to act, as we expect values and market activity
to be higher in 2020.
‣ Newer Stratas: As per our article in this edition on condos purchased at pre-
construction pricing, if you own a recently-completed unit, or one in the
three- to four-year-old ‘sweet spot’ we discovered, it may be time to liquidate
and upgrade to a new investment.
buyers
‣ Get the Worm: Stale listing inventory held over from 2019 may be ripe for an
offer and a deal early in the new year. Falling tax assessments could work in
your favour, as currently-listed sellers who haven’t yet secured a deal receive
their wake-up calls from BC Assessment in the mail early in the year.
‣ Move-Up Buyers: Sell high — buy low? With some softening in the detached
market in the latter half of 2019 and strong pricing for strata units heading
into Q1 2020, it may be an opportune time for you to consider a move up the
property ladder.
‣ Over $1M: All of the metrics we track for our luxury segment (properties sold
over $1M) point to decreases in pricing (median sale price and average
PPSF), longer market times, lower volumes, and listing discounts of 5% or
more. If this is your price point, it’s a great time to be a buyer.
investors
‣ Time your Acquisition: The combination of low interest rates, improving
inventory, and stable pricing make it a great time to consider adding to your
portfolio in Q1 2020, before we expect conditions to tighten in the spring.
‣ Pre-Construction: Did you read our feature on presale condos? There are still
opportunities to profit in a relatively short timeframe with pre-construction,
but the product must have the right mix of factors; so, make sure you talk to
us first.
10sum ma ry
After several years of challenging market conditions and rapidly moving
property prices, we hope you have found it refreshing to read a real estate
report focused on stability. Stay with us for our next issue as we climb toward a
busy spring market and mine another mountain of real estate information.
We appreciate you reading The Q Report, and we appreciate your help in
growing our audience of Victoria’s best-informed real estate market watchers
by sharing this valuable information. Pass along your copy to someone you
think would benefit from it. Share a link to VictoriaQReport.com on your social
media accounts. And make sure to subscribe for free on our website so you
never miss an update.
Our next quarterly report will be released in April 2020 but, in the meantime,
any of the metrics we have examined can be applied for personal analysis in
the context of your unique situation. Do your real estate portfolio or housing
needs require a consultation? Take the opportunity to make an appointment
today and talk face-to-face with the city’s best-informed agents, uniquely
positioned to analyze and identify your best opportunities.
We look forward to meeting with you.
Dirk VanderWal Fergus Kyne
(250) 888-7049 (250) 216-1217
dirk@yyjhome.ca ferguskyne@gmail.com
11note s
data analysis
The Q Report’s analysis includes listing and sales data exclusively from the
Victoria Real Estate Board’s Multiple Listing Service® (MLS®) ‘Core’, ‘Westshore’,
and ‘Peninsula’ regions. Data is analyzed for unconditional and completed
sales that occurred between 2019/10/01 and 2019/12/31 except where
specifically noted otherwise.
data sources
BC Real Estate Association (BCREA) bcrea.bc.ca
Black Press Media blackpress.ca
Canada Housing & Mortgage Corporation cmhc-schl.gc.ca
(CMHC)
Financial Post financialpost.com
Office of the Superintendent of Financial osfi-bsif.gc.ca
Institutions (OSFI)
Rate SuperMarket ratesupermarket.ca
Real Estate Council of BC (RECBC) recbc.ca
Statistics Canada statcan.gc.ca
The Capital capnews.ca
Times Colonist timescolonist.com
Victoria Foundation victoriafoundation.bc.ca
Victoria Real Estate Board (VREB) vreb.org
research & writing
Fergus Kyne PREC*, B.Ed., REALTOR®
Dirk VanderWal, REALTOR®
connect with us online
/victoriaqreport
@victoriaqreport
www.victoriaqreport.com
Not intended to solicit parties already under contract.
12the
Q report
Looking Back to Successfully Move AheadYou can also read


