TCM 2020 Investment Outlook & Strategy - Trinity Capital ...
←
→
Page content transcription
If your browser does not render page correctly, please read the page content below
TCM 2020 Investment Outlook & Strategy
January 1, 2020                                                   Steve Mills, CIMA®, Managing Partner
                                                                  Brad Bays, CIMA®, Partner

Introduction – “What a difference a year can make.”
At this time last year, we were suffering through one of the worst Decembers in stock market history
which capped a three month stretch that saw the benchmark S&P 500 Index fall nearly 20% from its
September 21, 2018 high.1 A hawkish Federal Reserve, which had raised interest rates eight times since
December, 2015,2 coupled with an escalation of the trade war with China, we believe caused investors
to sell stocks in the fourth quarter of 2018 in fear of a recession in 2019.
What a difference a year can make! One year later, global stock markets are surging with many of the
major stock market averages hitting new all-time highs seemingly on a daily basis. As indicated in Chart
1, the S&P 500 Index had a one of its best years since 2013 recording a gain of 28.8% for 2019 not
including dividends.1
Chart 1 – S&P 500 Index

Past performance is no guarantee of future results

Positive developments in the trade negotiations with China since September have helped turn investors
more optimistic on economic growth and the outlook for corporate earnings. In addition, the Federal
Reserve has lowered interest rates three times since June 2019 creating a more accommodative
monetary environment for the economy and stock market. We believe these two factors are fueling
the current stock market rally as investors move cash out of low yielding investments into equities. We
see this trend continuing into 2020.

                                                                                                      1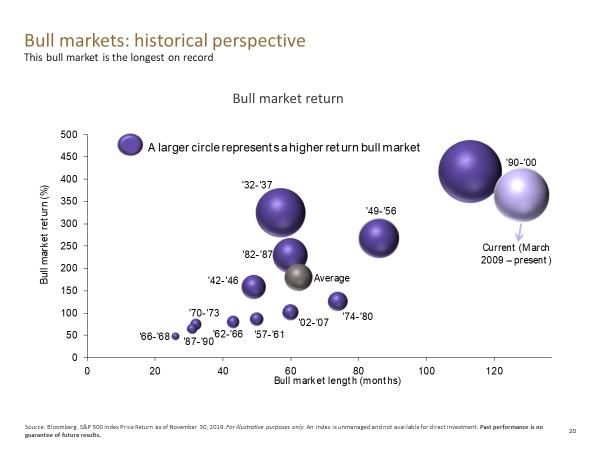
The U.S Economy – “Slow and steady often wins the race.”
The strong U.S. stock was supported by an economy that grew at moderate pace in 2019. The unemployment rate
fell to a 50-year low at 3.5% in November.3 U.S. employment has continued to steadily improve since the end of
the 2008-09 Great Recession as you can see in Chart 2.
Chart 2 – U.S. Unemployment Rate

We believe this robust employment picture has been one of the key components to U.S. economic growth and will
continue to bolster our economy in 2020. Strong employment has helped support household spending and
personal consumption which accounts for two-thirds of U.S. economic activity. We believe robust consumer
spending is the main reason the GDP growth rate has been in a healthy 2% to 3% range over the past two years. In
the last decade, consumers have paid down debt and increased savings putting them in a much better financial
position. In addition, workers have enjoyed wage gains of about 3% annually over the past two years after years of
stagnant wages. This improved consumer financial health bodes well for future economic growth. In addition,
consumers also are feeling better about the economy according to the University of Michigan consumer sentiment
index as shown in Chart 3. The index showed an uptick from 96.8 this past November to 99.3 in December, the
highest level since May.
Chart 3 – University of Michigan Consumer Sentiment Index

                                                                                                              2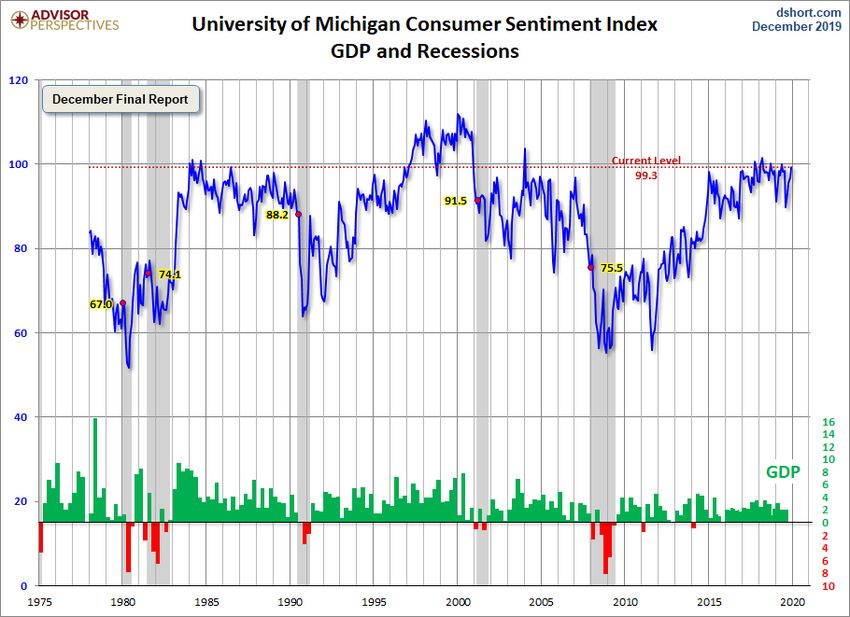
The other key component and major contributor to U.S. economic activity is manufacturing which has
been in a slump for the past year after a strong 2017-18. In September, U.S. manufacturing activity
tumbled to a 10-year low as China trade tensions dampened U.S. exports.4 Two popular manufacturing
indicators, the Institute for Supply Management (ISM) survey and the Purchasing Managers Index (PMI)
showed slowing manufacturing activity in September which we believe can be attributed to the Trump
administration’s 15-month trade war with China. The manufacturing segment has borne the brunt of the
trade tariffs which has hurt business confidence and undermined capital spending.
However, the recent announcement of the “Phase One” trade deal with China has led to optimism that
the manufacturing sector may see a recovery in 2020. The U.S. has agreed to delay new tariffs while
China has indicated it will cut import tariffs for all trading partners. We believe this sets up a better global
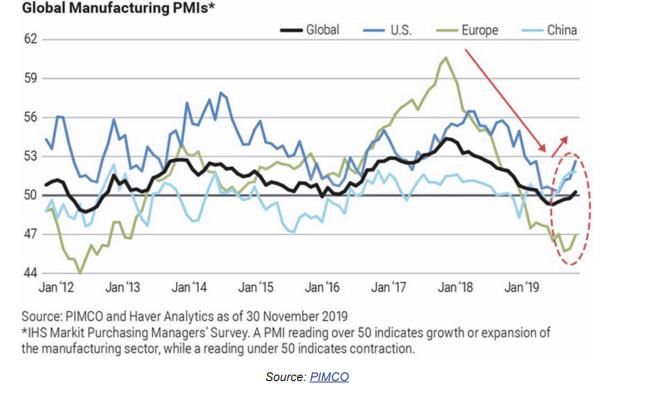
trading environment in 2020 which we feel could give a boost global growth. The global economy had
been slowing for two years but seems to have steadied in recent months. The International Monetary
Fund (IMF) in its October 2019 World Economic Outlook, forecast global growth for 2019 at 3.2%
increasing to 3.5% in 2020. This is starting to show up in recent global manufacturing PMI numbers as
indicated in Chart 4 which shows manufacturing expansion in three out of four PMI measurements. We
believe any uptick in growth overseas will help boost U.S. domestic growth.
Chart 4 – Global Manufacturing Purchasing Managers’ Survey
As mentioned earlier, this time last year many investors and economic prognosticators were looking for a
recession in 2019. Instead, the U.S. economy sailed along at a moderate and sustainable growth pace.
We expect similar growth for 2020, however, it will probably not be without a few bumps in the road.
Possible pot holes include a rise in geopolitical tensions with rogue countries like Iran and North Korea.
In addition, we think hostilities will continue to rise in the Middle East as the U.S. military presence
continues to be curtailed. The attack on a Saudi Arabia largest oil refinery in September of last year is one
example of the type of hostility we see.
Another pot hole could be a continued deterioration in the Eurozone economy as many countries struggle
to achieve economic growth. The outlook for the Eurozone appears bleak as most countries suffer from
high taxes, oppressive debt and political uncertainty. The one bright spot could be a pick-up in trade and
manufacturing activity which would be most helpful for the German economy. However, we will have to
see it to believe it. Our base case forecast is for continued stagnation for the Eurozone economy.
3Global Stock Markets – “The longest bull market on record.”
Stocks have been on an extraordinary run of late as investors put sidelined cash to work in hopes of capturing
whatever is left of this bull market. The current bull market in stocks hit its ten-year anniversary on March 10,
2019.1 According to chart 5 below, it is now the longest bull market on record although not quite the largest.
Chart 5 - Bull Markets: Historical Perspective
Source: Bloomberg Finance LLP, S&P 500 Index Price Return as of 11/30/19. Past performance is no guarantee of future results.
As we mentioned earlier, we believe the progress in the trade war with China and the recent more
accommodative Federal Reserve monetary policy, has led investors to become much more optimistic about the
prospects for the U.S. economy and corporate earnings growth. Although 2019 saw a very little growth in
corporate earnings after two strong years, 2020 is shaping up to potentially see earnings reaccelerate to the
upside. Rising earnings are one of the key components to stock prices.
The recent rise in stocks has triggered valuation concerns on the part of some market strategists. Currently, the
S&P 500 Index is trading at about 20 times Wells Fargo Investment Institute’s (WFII) estimated 2019 earnings of
$1645 which is considerably above the long-term price to earnings ratio (P/E ratio) of 16.8 dating back to 1870,
according to Advisors Perspectives.6 However, the stock market often trades on expected future earnings which
using WFII’s 2020 earnings projection of $175 for the S&P 500, gives us a P/E ratio of 18.5.5 Although this P/E
ratio is still above the historical average, we believe given the current fundamentals of low interest rates, low
inflation, and moderate economic growth, the S&P is not overvalued at this time.
We believe there is still reasonable upside in stock prices if the economic fundamentals remain as they are or
even improve. In fact, we could be in the early stages of a period of time when conditions are ideal for stocks
much like we saw in the mid to late 1990’s when stocks reached much higher valuation levels than today.
Although we don’t expect stocks to reach significantly higher valuation levels any time soon, we do feel there is
further room for stocks to advance before this bull market comes to an end, especially if corporate earnings
growth kicks back into gear. According to FactSet, analysts across Wall Street are predicting corporate profits will
grow in the 5% to 10% range next year.7 We believe such earnings gains would be very beneficial for the overall
equity markets. One caveat, stocks will likely remain volatile and corrections are surely to occur. That’s why it is
so important to properly assess one’s risk tolerance and have the appropriate asset allocation strategy.
4Fixed Income – “An anchor in stormy seas.”
Fixed income investors enjoyed one of their best years in a long time in 2019 after a difficult year in 2018 as you
can see in Chart 6. Interest rates across most fixed income classes fell during the year pushing bond prices
higher. Intermediate, high quality bonds like U.S. treasuries, high-grade corporate bonds and municipal bonds
gained on average 8-10% during the year, not counting the interest coupon.1 The 10-year Treasury note yield,
often cited as a benchmark for interest rates, fell from 3.2% in early November, 2018 to 1.9% at the end of 2019.1
Yields for other high-grade fixed income instruments traded much the same way as U.S. treasuries. Yields on
money market funds and short-term instruments like CD’s also moved lower ending the year yielding under the
2% level.1 Interest rates across the spectrum were impacted by the Federal Reserve’s reduction of the fed funds
rate in the second half of 2019. The Fed lowered rates three times by .25% to help offset the negative impact of
the trade war and a slowing manufacturing sector.
Chart 6 – Fixed income market returns
Source: FactSet. Total return as of November 31, 2019. Past performance is no guarantee of future results. 2019. Definitions of the indices and
descriptions of the risks associated with investment in these asset classes are provided at the end of the presentation.
Looking ahead, we believe fixed income performance could be more challenging in 2020, especially if economic
growth accelerates. Stronger economic growth could push inflation higher and, as inflation rises, interest rates
tend to rise putting downward pressure on bond prices. Since the Fed’s last rate cut in September, bond yields
have risen. We feel this trend could continue in 2020, however, we are not anticipating a significant increase in
bond yields. We think the Fed will be on hold throughout 2020. However, at some point in the current cycle,
the Fed may begin hiking rates if the economy kicks into a higher gear and inflation begins to pick up significantly.
With the current low interest rates on quality bonds, many investors are tempted to move into the high yield
bond sector. High yield bonds are lower rated bonds of corporations and municipalities and carry a higher risk of
default than high grade bonds. On average, high yield bond prices increased by about 10% in 2019.1 We don’t
expect a repeat performance in 2020. We feel the risk in this sector is not worth the potential reward at this
time so we are underweighting the high yield sector in our portfolios. A small allocation is fine based on risk and
return objectives but we would not have more that about 5-10% of a portfolio in this riskier fixed income sector.
These types of bonds act more like equities and can drop significantly in value in a recession and bear market.
We would rather own stocks, which in our opinion, have significant more upside potential.
We recommend the fixed income portion of one’s portfolio emphasize high quality bonds and short-term cash
instruments. We believe this type of high-quality fixed income is like an anchor in stormy seas when things get
rough in the stock market. We believe it is very important when volatility increases in the financial markets to
have a very conservative fixed income component in a portfolio to offset the risk in the equity component.
5Where We See Opportunities
As a typical bull market progresses, it can become harder to find opportunities and undervalued sectors. This
time last year we felt U.S. stocks were significantly undervalued after a 20% correction in prices (as measured by
the S&P 500 Index) from the September 2018 highs.1 With the S&P 500 Index up nearly 30% in 2019, bargains
are much harder to find. However, we believe there are still sectors that present good upside opportunity. In
particular, we think sectors and stocks exposed to trade and manufacturing look attractive. These types of stocks
generally underperformed in 2019 as investors tended to migrate more toward traditional growth stocks. In
addition, although it is an election year and the political rhetoric could be negative toward the healthcare sector,
we feel there are a number of quality stocks that could do very well as the population continues to age and
healthcare needs rise. We still like good quality growth stocks in the technology, consumer, and financial
services sectors that consistently growth earnings and dividends. Many of these stocks have seen significant
price increases but we believe there is still more upside potential as the continues to economy grow.
Of course, 2020 is a presidential election year. Typically, stocks do very well during the last year of the
presidential cycle especially when an incumbent is running again and wins as you can see in chart 7. Incumbent
presidents stand a very good chance of getting reelected if the economy is strong and voters are feeling good
about their pocketbooks. If employment trends continue to be strong and the economy continues to grow, we
would anticipate a Trump reelection. In that event, we think stocks will do very well this year. Of course, all bets
are off in the event that the Trump impeachment leads to his removal from office. If that case, we believe stocks
could fall significantly. However, we think a Trump removal from office is unlikely since it will take a two-thirds
vote in favor of conviction in the Republican controlled Senate.
Chart 7 – How stocks perform in presidential election years.
Bloomberg, Wells Fargo Investment Institute. Past performance is no guarantee of future results.
The Bottom Line
We believe equity investors will continue to be rewarded for risk taking in 2020. However, with equity valuations
above historical averages, we feel stock market volatility will increase especially considering it is a presidential
election year and the political environment in Washington is perhaps as divisive as it was during the Civil War.
The direction of stocks may hinge on the outcome of the election. If Trump is reelected, we believe the equity
markets will move higher in anticipation of continued market friendly policies coming out of the White House
and Congress. This would be especially true if the Republicans retain control of the Senate and can somehow can
6retake the House of Representatives. Our base case is for President Trump to be reelected, the Republicans
maintain control of the Senate and the Democrats maintain control of the House. In that event, we would likely
see mostly gridlock and very few market impacting policies coming out of Washington. However, we feel the
2016 Trump tax cuts and his business deregulation efforts will continue to benefit U.S. economic growth for
several more years.
In addition, President Trump is appointing a record number of federal judges to the U.S. judiciary. As of
December 31, 2019, Trump has nominated 187 federal judges which have been confirmed by the U.S. Senate
including two Supreme Court judges.8 There are 33 more nominations awaiting Senate action. President Trump
is on pace to appoint approximately 25% of all Article III judgeships by the end of his first term. Trump is making
good on his promise to appoint conservative men and women who pledge to uphold the Constitution and rule of
law. We firmly believe that our Constitution and the rule of law provide the foundation for our capitalistic
economic system. We feel it is one of the important reasons why investors all over the world bring their capital
to the United States. Capital tends to go where it is treated best. Protection of individual freedoms and property
rights is paramount to investors. By reshaping the federal judiciary to support Constitutional rights, we believe
President Trump will leave a lasting legacy that will help keep America in a strong position of leadership in the
world. To be clear, this is not a political statement in support of Donald Trump but a statement in support of
free markets and free enterprise. We see President Trump’s efforts to reshape the U.S. federal judiciary as
supportive of economic growth for our country for many years to come.
In summary, we see moderate growth, stable interest rates, and low inflation for the U.S. economy in 2020.
Although we continue to be optimistic about the U.S. economy and financial markets for 2020, we understand
that fundamentals can change quickly so we will continue to closely monitor global economic and political
developments. We encourage each of our clients to evaluate their current asset allocation in light of the sharp
run up in stocks prices in 2019. This could be a good time to rebalance portfolios back to long-term target
allocations and take some profits off the table. For example, if your desired maximum equity of exposure is 60%
and with the market increase it has moved up to a 70%, you may want to consider rebalancing your portfolio in
order to bring the equity component back down to 60%. We believe this is prudent portfolio management and
not market timing.
Lastly, Trinity Capital Management celebrated its 8th year in business in October. We would like to take this
opportunity to thank you once again for your business and the trust and confidence you place in us to work with
your wealth management needs. We look forward to serving you in the future.
May you and your family have a very Happy and Prosperous New Year!
The Trinity Capital Management Team
Footnotes
1
Thompson Charts
2 Wikipedia, “History of Federal Open Market Committee Actions,”
3 U.S. Bureau of Labor Statistics News Release, December 6, 2019.
4 Reuters.com, “U.S. Manufacturing Dives to 10-year low as trade tensions weigh.” October 1, 2019.
5 Wells Fargo Investment Institute, “2020 Outlook,” December 16, 2019
6 Macrotrends, S&P 500 PE Ratio – 90 Year Historical Chart.
7 The Wall Street Journal, “Stocks Are Climbing Faster Than Profits, but, Investors Aren’t Worried, December 24, 2019.
8 https://en.wikipedia.org/wiki/List_of_federal_judges_appointed_by_Donald_Trump
Trinity Capital Management, 821 ESE Loop 323, Suite 100, Tyler, Texas 75701. 903-747-3960. www.tcmtx.com
Investment products and services are offered through Wells Fargo Advisors Financial Network, LLC (WFAFN), Member SIPC, a
registered broker-dealer and separate non-bank affiliate of Wells Fargo and Company. Trinity Capital Management, LLC is
separate entity from WFAFN.
7The indices presented in this material are to provide you with an understanding of their historic performance and are not presented to illustrate
the performance of any security. Investors cannot directly purchase any index.
Wells Fargo Advisors Financial Network did not assist in the preparation of this report, and its accuracy and completeness are not
guaranteed. The opinions expressed in this report are those of Trinity Capital Management, LLC and are not necessarily those of Wells Fargo
Advisors Financial Network or its affiliates. The material has been prepared or is distributed solely for information purposes and is not a
solicitation or an offer to buy any security or instrument or to participate in any trading strategy. Additional information is available upon
request.
Stocks offer long-term growth potential, but may fluctuate more and provide less current income than other investments. An investment in the
stock market should be made with an understanding of the risks associated with common stocks, including market fluctuations. Investing in
foreign securities presents certain risks not associated with domestic investments, such as currency fluctuation, political and economic
instability, and different accounting standards. This may result in greater share price volatility.
Wells Fargo Advisors Financial Network is not a legal or tax advisor. Consult your tax advisor or accountant for more details
regarding your specific circumstance.
Investing in fixed income securities involves certain risks such as market risk if sold prior to maturity and credit risk especially if investing in
high yield bonds, which have lower ratings and are subject to greater volatility. All fixed income securities may be worth less than the original
cost upon redemption or maturity. Yields and market value will fluctuate so that your investment, if sold prior to maturity, may be worth more
or less than its original cost. Bond prices fluctuate inversely to changes in interest rates. Therefore, a general rise in interest rates can result in
the decline of the value of your investment.
Bond laddering does not assure a profit or protect against loss in a declining market.
Asset allocation cannot eliminate the risk of fluctuating prices and uncertain returns nor can diversification guarantee profits in a declining
market.
Diversification does not guarantee profit or protect against loss in declining markets.
Wells Fargo Investment Institute, Inc. is a registered investment adviser and wholly-owned subsidiary of Wells Fargo &
Company and provides investment advice to Wells Fargo Bank, N.A., Wells Fargo Advisors and other Wells Fargo affiliates.
Wells Fargo Bank, N.A. is a bank affiliate of Wells Fargo & Company.
Investment Grade Securitized: Bloomberg Barclays Mortgage Backed Securities Index; Developed Market ex U.S: JPMorgan Global ex-U.S. Government
Bond Index; U.S. Treasurys: Bloomberg Barclays Global U.S. Treasury Index; U.S. Municipals: Bloomberg Barclays U.S. Municipal Index; U.S. TIPS: Bloomberg
Barclays U.S. TIPS Index; U.S. Corporates: Bloomberg Barclays U.S. Aggregate Corporate Bond Index; U.S. High Yield: Bloomberg Barclays U.S. Corporate
High Yield Index; Emerging Market: JPMorgan Emerging Markets Bond Index. Index return information is provided for illustrative purposes only. Index
returns do not represent investment performance or the results of actual trading. Index returns reflect general market results, assume the reinvestment of
dividends and other distributions and do not reflect deduction for fees, expenses or taxes applicable to an actual investment. An index is unmanaged and
not available for direct investment.
P/E Ratio is a valuation of a company or an index’s current value compared to it’s earnings per share. It is calculated by dividing the market
value per share by earnings per share. S&P 500 Index: The S&P 500 Index consists of 500 stocks chosen for market size, liquidity, and
industry group representation. It is a market value weighted index with each stock's weight in the Index proportionate to its market value.
Dow Jones Industrial Average: The Dow Jones Industrial Average is an unweighted index of 30 "blue-chip" industrial U.S. stocks.
The Russell 1000® Value Index measures the performance of those Russell 1000 companies with lower price-to-book ratios and lower
forecasted growth values.
The Russell 1000® Growth Index measures the performance of those Russell 1000 companies with higher price-to-book ratios and higher
forecasted growth values.
S&P 500 Index: The S&P 500 Index consists of 500 stocks chosen for market size, liquidity, and industry group representation. It is a market
value weighted index with each stock's weight in the Index proportionate to its market value.
Past performance is no guarantee of future results and there is no guarantee that any forward looking statements made in this communication
will be attained.
CAR- 0120-00051
8You can also read


