GA-MSSR: Genetic Algorithm Maximizing Sharpe and Sterling Ratio Method for RoboTrading - arXiv
←
→
Page content transcription
If your browser does not render page correctly, please read the page content below
GA-MSSR: Genetic Algorithm Maximizing Sharpe
     and Sterling Ratio Method for RoboTrading
                                            Zezheng Zhang                     Matloob Khushi
                                      School of Computer Science         School of Computer Science
                                        The University of Sydney          The University of Sydney
                                           Sydney, Australia                 Sydney, Australia
                                       zaczhang1994@gmail.com            mkhushi@uni.sydney.edu.au

    Abstract— Foreign exchange is the largest financial market in       Memory (LSTM) is the state-of-art sequence learning network
the world, and it is also one of the most volatile markets. Technical   to forecast the stock price [2], and it could also be used to
analysis plays an important role in the forex market and trading        identify some common patterns in traded stocks as proposed by
algorithms are designed utilizing machine learning techniques.          Fischer et al. [3]. Multi-task recurrent neural networks were used
Most literature used historical price information and technical         for stock price forecasting [4] which had better performance
indicators for training. However, the noisy nature of the market        than LSTM on selected datasets. Selvin et al. [5] compared
affects the consistency and profitability of the algorithms. To         Convolutional Neural Networks (CNN) and LSTM
address this problem, we designed trading rule features that are        architectures for predicting the stock price. Zeng and Khushi
derived from technical indicators and trading rules. The
                                                                        combined wavelet denoising and Attention-based RNN-
parameters of technical indicators are optimized to maximize
trading performance. We also proposed a novel cost function that
                                                                        ARIMA Model to predict USDJPY prices [6]. Bao et al. [7] used
computes the risk-adjusted return, Sharpe and Sterling Ratio            stacked autoencoder to extract high-level features of the price
(SSR), in an effort to reduce the variance and the magnitude of         pattern for next day close price prediction. Gao [8] used LSTM
drawdowns. An automatic robotic trading (RoboTrading)                   and hourly stock prices to predict the trend. Support Vector
strategy is designed with the proposed Genetic Algorithm                Regressor is another common approach used for stock price
Maximizing Sharpe and Sterling Ratio model (GA-MSSR) model.             prediction [9]. A combination of statistical models and deep
The experiment was conducted on intraday data of 6 major                learning models was proved to perform well on short term trend
currency pairs from 2018 to 2019. The results consistently showed       forecasting [10]. Zhang et al. [11] implemented a novel network,
significant positive returns and the performance of the trading         State Frequency Memory (SFM) to capture the multi-frequency
system is superior using the optimized rule-based features. The         trading patterns by utilizing Fourier Transform. However,
highest return obtained was 320% annually using 5-minute                simply predicting the next day price is not enough to consistently
AUDUSD currency pair. Besides, the proposed model achieves the          make profits unless the prediction is accurate enough when
best performance on risk factors, including maximum drawdowns           predicting multiple timesteps. To the best of our knowledge, a
and variance in return, comparing to benchmark models. The              model with such adequate predictive power in the foreign
code can be accessed at https://github.com/zzzac/rule-based-forex-      exchange market has not been found.
trading-system
                                                                            CNN was also commonly used for classification tasks to
   Keywords—feature engineering, technical analysis, genetic            identify the historical patterns on the chart and classify the trend.
algorithm, machine learning                                             Tsai [12] classified the market into uptrend, sideways and
                                                                        downtrend and used CNN to classify the trend direction. The
                        I.    INTRODUCTION                              accuracy they achieved was not ideal possibly because of the
    Foreign exchange, abbreviated as forex, is the largest              lack of training data. Kusuma et al. [13] claimed they achieved
financial market in the world with over $5 trillion dollars             90% bi-directional accuracy using CNN with candlestick charts
transactions each day and it runs continuously from Monday to           on a small dataset. Sezer et al. [14] combined 15 technical
Friday, 24 hours a day. Forex is the most liquid financial market       indicators in 15 timesteps into 2-D images and used CNN for
where little transaction fees are applied depending on brokers.         classification. The model outperformed LSTM, MLP over a
The role of technical analysis had long been regarded as more           long period. The classification problem approach presents more
than important in the field of foreign exchange [1]. It is widely       value comparing to time series prediction problem since it would
believed that the pattern of price movement would repeat itself.        give signals when the trend changes. Nevertheless, the high
Many algorithms are based on technical indicators with                  volatility nature of the forex market sets a high barrier for
carefully selected parameters according to professional                 machine learning models to outperform professional traders. A
experience.                                                             complete trading system needs to consider both prediction and
                                                                        risk management to maximize performance.
    Many papers focused on the time series prediction problem.
Under the growing influence of artificial intelligence, deep                There are a few attempts to design an intelligent trading
learning techniques were used to predict future price movements         system that focus on strategies that optimize the overall trading
with carefully designed neural networks. Long Short-Term                performance. The applicability and efficiency of genetic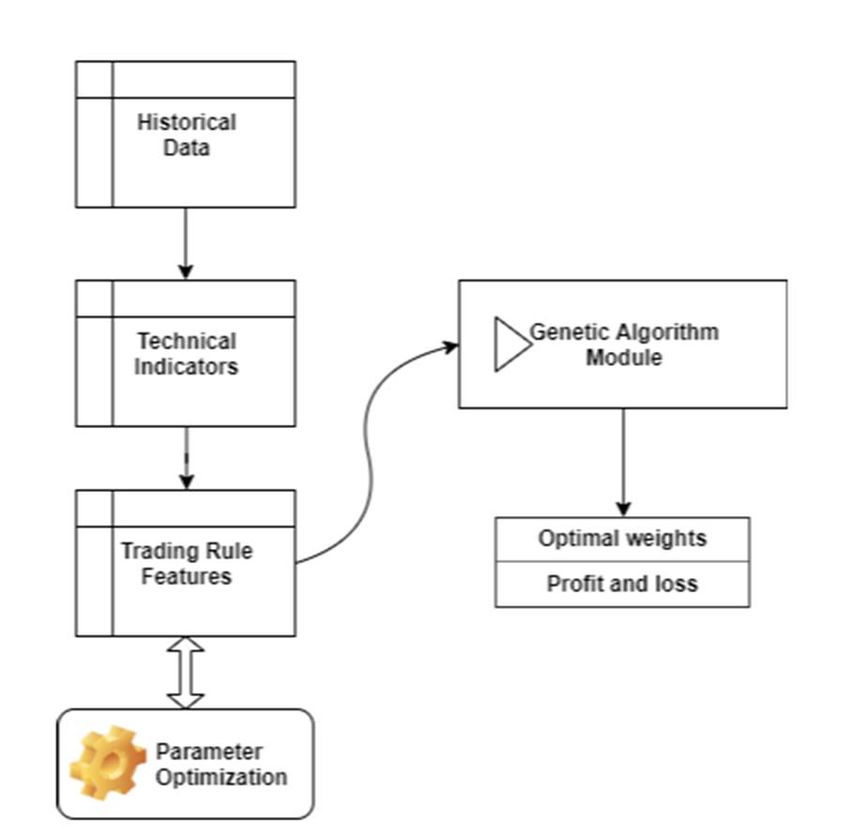
algorithm in portfolio optimization was illustrated by Sefiane, et    ratio measures the risk-adjusted return that attempt to address
al. [15]. Mendes et al. [16] proposed a trading system using          the deficiency of the original ratios. We also propose a
genetic algorithm and technical indicators to maximize the            RoboTrading system, the Genetic Algorithm Maximizing SSR
Stirling ratio but the performance on testing data struggle to        (GA-MSSR) model to build a trading strategy with trading rule
make profits. Ozturk et al. [17] used heuristic based trading rules   features.
together with genetic algorithm which showed genetic algorithm
could be used to select the best trading rules. Evans et al. [18]
introduced decision making model using artificial neural
networks and genetic algorithms and achieved 23.3%
annualized net return. Maknickienė et al. [19] used LSTM-based
neural networks with genetic algorithm as learning algorithm
which resulted in significant increase of the reliability of
prediction. Pawel et al. [20] developed decision trees using
evolutionary algorithms and technical indicators to identify buy
or sell signals. Rodrigo et al. [21] showed that genetic algorithm
could also be used to optimize the parameters in technical
indicators used for SVR+GHSOM model based trading system
and the results outperformed the market. Bernardo et al. [22]
categorized the market into three different types and used a
hybrid system with SVM and genetic algorithm to classify the
trend. The claimed annualized return is 83% with high leverage.
Genetic algorithm is an example of an evolutionary computation
method, which is capable of finding the near-global optimal
solution of a non-linear non-convex function without getting          Fig. 1. Overview of the workflow
trapped in local minima[23]. Petropoulos et al. [24] proposed
using correlations between currency pairs as additional trading
                                                                                        II.   PROPOSED METHODOLOGY
signals which were aggregated using the genetic algorithm and
constrained optimization methods. The results showed claimed          A. Overview of process
17% annualized return with low leverage.                                  The overall workflow of the forex trading system proposed
    Technical indicators could reveal underlying information          in this paper is demonstrated in Fig. 2. The trading system starts
regarding the historical price movements. Hence, it is widely         with historical data feed and generates technical indicators using
used for algorithm trading. However, given there are thousands        historical open, high, low and close prices. Feature engineering
of indicators do not always work since it is publicly available to    using trading rules are computed and the parameters for the rule-
everyone. The study attempts to design feature engineering            based features optimized using a cost function that computes the
process using trading rules, which are combinations of technical      risk-adjusted return. The new features are fed to the genetic
indicators. The features utilize crossover rules to models the        algorithm module to compute the weighting of the features that
relationship between technical indicators. The parameters for         maximize the overall risk-adjusted return using the designed
the technical indicators are selected using optimization methods      cost function.
with a focus on trading performance.                                  B. Technical indicators
    It is noted that many of the research papers only included            Technical indicators are defined to represent the higher-level
annualized returns in their results. However, in any financial        interpretation of past price movements. Each technical indicator
market, risk management is the crucial factor to successful and       is computed from the open, high, low and close prices with user-
consistent returns. According to Capital Market Line (CML)            defined parameters. Three types of technical indicators are
theory, the excess return and the standard deviation of the return    introduced.
should be proportional as in Fig. 1 and the slope of the curve is
also called the Sharpe ratio. Ideally, the best strategy is the one     1) Trend indicators
with the highest Sharpe ratio because it will have the highest            a) Moving average
expected return at a given risk level. Given the high volatility of       b) Exponential moving average
forex market, the unexpected drawdown should also be
                                                                          c) Double exponential moving average
considered. Some papers focused on the risk-adjusted returns
using the Sharpe ratio or the Sterling ratio. Sharpe ratio                d) Triple exponential moving average
penalizes negative returns less when the average return is                e) Vortex indicators
generally low, and it would also penalize occasional high               2) Momentum indicators
returns. Sterling ratio penalizes the maximum drawdown which
                                                                          a) Relative strength index
could be experienced when market changes suddenly and
unexpectedly, which is very common in forex market.                       b) Stochastic oscillators
                                                                        3) Volatility indicators
   Due to the above deficiency of the performance measure, we
propose a novel ratio which is essentially a combination of               a) Bollinger bands
modified Sharpe Ratio and Stirling Ratio (SSR). The proposed              b) Ichimoku indicators
c) Keltner channel
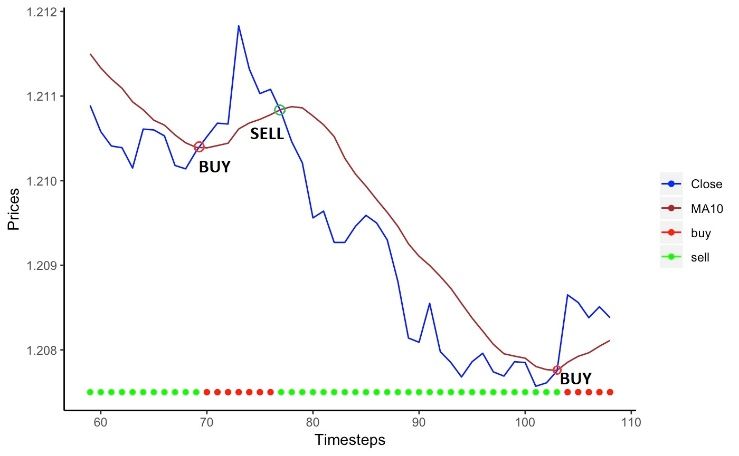
Fig. 3. Example of simple moving averages crossover rule
1) Two time series crossing
When two time series cross each other, the trading signal is
inverted depending on the direction of the intersection. For
example, if a slow moving average crosses above a fast moving
average, the signal will be inverted from 1 to -1. Boolean
Fig. 2. Overview of the workflow
operation is used to compare the values of the moving averages
of the close price. In the two series crossing category, no neutral
position or 0 value will occur.
Volume is another important category of technical
indicators. However, due to the decentralization nature of forex > (1)
=
market, we cannot obtain accurate volume data. Therefore,
volume indicators are not used. An example of two time series crossing rule is the simple
Each technical indicator is essentially a time series with no moving average crossing rule. Two simple moving average time
future information. The technical indicators are essential for series need to be created where typically one moving average
building the trading rules. It is inferred that trend, momentum has a longer period and another one has a shorter period. A
and volatility information regarding to the past price movements simple moving average on close price of period 10 (MA10) and
could be used to predict the future price movement directions a simple moving average of 1, which is the close price itself are
and the embedding risks. shown in Fig. 3. When MA10 crosses close price from above, a
buy signal is generated, and a sell signal is generated when close
C. Trading rule derived feature engineering price cross MA10 from above. Between those intersections, the
Crossover is one of the most important and common trading previous signal would persist representing no change in the
rules that are used by traders. Crossover rules refers to price position when there is no crossover. Therefore, using this
sensitive movements when there is a crossing between technical strategy results in 100% of the capital invested all the time
indicators, open or close prices or a threshold of a constant throughout the simulation.
value. Such events could indicate a change in the trend, Besides the simple moving average crossover rule,
momentum or volatility that would reveal important information exponential moving average, stochastic oscillator and other
for trading performance optimisation. Logical conditional technical indicators could be useful under category 1.
operations will be used to generate features therefore the created
feature only has 3 values, where 1 represents long indication, 0 2) One time series and a threshold crossing
represents a neutral indication and -1 indicates a short indication. Crossovers between a time series and a threshold has similar
The benefit of using simple representations as features is to settings with two time series crossover rules. The only
remove noisy short-term fluctuations and yield higher-level difference is that one of the time series is comprised of a constant
interpretation that could potentially improve the performance of value representing a threshold. Typical technical indicators will
the machine learning algorithms for the trading system. The fall into this category if it has a certain range of values. One
possible combination set of technical indicators is infinity. example of the application is relative strength index (RSI) which
Hence, only 16 trading rules based on technical indicators were is bounded between 0 and 100 which is interpreted as the
formulated and each of the 16 trading rules falls into one of the momentum strength of the recent price change. When the RSI is
following 4 categories. over a threshold, a buy signal of 1 is created and a short signal
of -1 will occur when the RSI is lower than the threshold.
> (2)
=3) One time series and two threshold crossing ∑ × (7)
=
Category 3 rules is a slight modification to the rules in ( × ) × |∑ × , ∀ × < |
category 2 where two thresholds were supplied to generate the
The new ratio penalizes higher standard deviation as well as
trade signal. One of the thresholds is greater than the other. The
higher occurrence and values of drawdowns. The numerical
typical setup of the trading rule is that when the time series of
value of the ratio could be interpreted as the proposed measure
interest moves above the upper threshold, a buy or sell signal is
of risk-adjusted return. The reason for using the sum of
generated, and a reverse signal would be generated when the
drawdowns instead of maximum drawdown is to reduce the
time series moves below the lower threshold. When the time
outlier effect that is unavoidable in a volatile market. Reducing
series is in between the higher and lower thresholds, a neutral
the sum of drawdown experienced would also force the strategy
signal, representing no money should be kept in the market,
to find a better strategy to minimize loss. The standard deviation
would be generated. The neutral position allows capital to be
of the returns would force the strategy to find a consistent
safely sitting on cash and stay away from excessive risks.
trading strategy.
> (3)
− <
E. Grid search for trading rule parameters
Each trading rule would require parameters for associated
technical indicators such as the moving average period size and
4) Three time series crossing
thresholds for buy or sell limits. The parameters need to be tuned
Category 4 rules have three time series, like category 3 rules,
to achieve better performance on the trading system. A grid-
with upper and lower thresholds replaced by upper and lower
search method is implemented and the search space for each
time series. One typical example is Bollinger bands where the
individual rule contains at most 3 parameters which could be
upper band is always greater than the lower band at any time. A
completed in polynomial time. An example is that the moving
moving average, high or low prices could be used as the free
average window size must be integers and a range from 1 to 100
moving time series. Category 4 rules also allows neutral position
is selected for searching that indicates up to 100 previous price
indication.
information could be incorporated into the trading rule. The
> (4) scores are calculated by the SS ratio on the training dataset if the
− < trading rule is implemented. The best scores and the
corresponding parameters are found using the algorithm.
D. Sharpe and Stirling ratio (SSR) Algorithm 1 Grid search parameter optimization
For optimisation of the trading rule parameters, the scoring START
algorithm and assumptions need to be stated. The metric used to
compare the performance of each trading rule when applied to Setup trading rule functions
the training dataset. Without taking transaction costs into Initialize parameter list for each rule
consideration, the currency pair is assumed to be purchased or
sold at the close price of the latest candle. The overall return For each rule do
could be calculated as in (5) (6).
For each parameter in parameter list do
= × ( / ) (5)
Compute the SS ratio over data with parameter
= × (6) Save results to list
End for
Where s represents signals and r represents log returns.
Find the highest SS ratio and its parameter
However, using the return as the performance measure is
inadequate. To adjust for the risk factors, conventional methods End for
use Sharpe ratio, which penalizes high standard deviation of the Fig. 4. Pseudocode for grid search algorithm
return, or Sterling ratio, which penalizes higher maximum of
drawdown. Sharpe ratio penalizes negative returns less when the As a result of parameter optimization, 16 new features are
average return is generally low, and it would also penalize generated that represents the trading signal based on each single
occasional high returns. Sterling ratio penalizes the maximum trading rule. A sample of the engineered is shown in Fig. 5. A
drawdown which could be experienced when the market dataframe contains those 16 features will be optimized using
changes suddenly and unexpectedly, which is very common in machine learning algorithms to improve the performance of the
forex market. Hence, we propose a new ratio which incorporates overall trading system. The number of features is relatively low
the variance and drawdown factors in a single equation as in (7) providing reasonable representation of the historical prices since
and the name of the ratio is Sharpe and Stirling ratio (SSR) since the rules are based on technical indicators. The performance of
it is derived from Sharpe ratio and Stirling ratio. In (7), the dot the abstraction of the features will be tested using genetic
operator represents dot product and the cross operator represents algorithm.
multiplication between two scalars.value of 0 means sitting on cash away from the market and
values of 1 and -1 means long position and short position with
100% of the capital respectively. The output vector v represents
Fig. 5. One sample of the 16 engineering features
a time series of positions in the market. The changing volume
mechanism allows better risk control as the algorithm could
achieve lower standard deviation by placing lower positions at
volatile markets.
1) Benchmark model: maximizing the return (GA-MR)
To achieve profit maximization, the conventional method is
to compute the accumulated returns over the entire training
period. Maximizing the overall return of the trading strategy will
yield the solution. Equation (10) (11) is used as fitness function
to maximize the overall return of the trading system. The
maximizing return approach is used for comparison with the
proposed fitness function.
Maximize
Fig. 6. Parameter optimization process (10)
= ×
F. Genetic algorithm module
Genetic algorithm mimics the natural selection process Subject to
where the fittest individual will be selected and is usually | | (11)
applied to optimization problems. The steps in genetic algorithm
involve selection, crossover and mutation stages. The pseudo- 2) Proposed model: maximising the SSR (GA-MSSR)
code for the genetic algorithm is included below. Minimizing the risk without consideration for profit will not
lead to good trading results. Hence, we propose using SSR as
Algorithm 2 Genetic algorithm the proxy for the risk-adjusted return as shown in (12) (13). The
use of SSR as the fitness score enables profit maximization with
START a certain level of risk management. The proposed method using
Generate the initial population randomly the fitness function is named Genetic Algorithm Maximizing SS
Ratio (GA-MSSR).
Compute the fitness score
Maximize
For each epoch do ∑ × (12)
Select 2k parents in the population =
( × ) × |∑ × , ∀ × < |
Generate k offspring by crossover operation Where is volume, is rate of return and is standard
Select m highest score solutions as new deviation; subject to:
population
| | (13)
Mutate n offspring in the new population
Compute fitness score III. EXPERIMENT SETUP
End for A. Data Collection
Historical data of 6 major currency pairs are tested including
Fig. 7. Pseudocode for genetic algorithm EURUSD, GBPUSD, AUDUSD, USDJPY, USDCAD and
USDCHF. The timeframe and period used are 5 minutes data.
The problem setup is to use genetic algorithm to find a from January 2018 to December 2019 which includes around
trading strategy that maximizes the performance. We will find a 200,000 timesteps. The period of data is selected to only include
mapping of features S to the position of volume in the market v. the recent years that prevents potential regime changes in the
The chromosomes for the genetic algorithm is a vector w that market over time. 2018 data was used for training and 2019 data
represents the weight for all features. Using linear mapping, the was used for testing.
return over the trading period can be calculated as (9).
B. Cross-validation
= ( , , , ,…, , ) (8)
The entire data is split with a ratio of 50% to obtain the
(9) training dataset and test dataset. To prevent data leaks, the first
= × , half of the entire period is used for training and the rest is
retained for testing without random shuffling. This ensures that
The vector v is adjusted to have a maximum absolute value no future information would be used in the training data thus
of 1 to represent the position as a percentage of the capital. A affecting the validity of the results on test data.C. Evaluation metrics Number of generation = 200
ROI: Return on investment is calculated as the annualized Mutation probability = 0.5
return of the trading system on the data. Higher returns are
preferable. Crossover probability = 0.4
E. Benchmark model
(10)
= −1 The simple buy and hold (B&H) and simple sell and hold
(S&H) strategies are used as the benchmark system in the
SR: Sharpe ratio is calculated as the mean excess return over trading system. The genetic algorithm maximizing the return
the standard deviation of the excess returns. Higher Sharpe ratio model (GA-MR) will also be compared with the proposed GA-
represents better return when the risk is adjusted. Therefore a MSSR model.
higher Sharpe ratio represents a superior trading strategy.
F. Trading simulations
= (11)
( ) A 1:1 leverage is used for all models. We assume the forex
MD: Maximum drawdown is the lowest level of capital security will only be bought or sold at the close price of the latest
during the backtesting stage in percentage. A lower maximum candle. We also assumed 0 transaction fees.
drawdown also represents lower risks and uncertainties IV. RESULTS AND DISCUSSION
associated with the trading strategy.
A. Results
= min( ) (12)
The model performance evaluation results are shown in
AP: Average position is the average amount of capital Table 1. It is observed in training dataset, naïve buy and hold
invested in the market of the entire capital in percentage. A value (B&H) or sell and hold (S&H) strategies have the worst
of 1 represents 100% of capital is invested in the market all the performance. Results indicate that randomly buy or sell a
time whereas 0.1 means 10% of the capital is invested in the currency pair in forex market is equivalent to gambling which
market on average and the other 90% of capital is held as cash no one could make profits in the long term.
in the account without risks. Lower AP with high return could
mean that the trading strategy implies that only a portion of The other models GA-MR and GA-MSSR are all tested with
capital is needed to generate a good return and the other portion positive results for all currency pairs. The performance differs
of the capital is available to be invested on other assets. for different pairs but on general, the model proved it works for
different currency pairs. The proposed GA-MSSR model
= (13) outperformed benchmarks in Sharpe ratio, maximum drawdown
and average position metrics for all pairs. The return value is
lower than GAMR which is as expected, but the different margin
D. Parameter settings is very small. The return after adjusted for risk for GAMR would
The hyperparameters for the genetic algorithm are set as be smaller than GA-MSSR which has a higher Sharpe ratio and
following: significantly lower drawdowns.
Solution per population = 10 The pair that has the best performance is USDCAD where
Number of parents mating = 4 the return for GA-MSSR is higher than GA-MR. Empirical
evidence suggests that the model generalizes better on the test
TABLE I. PERFORMANCE OF 6 MAJOR CURRENCY PAIRS ON 2019 5-MINUTE DATA WITH NO LEVERAGE
EURUSD GBPUSD AUDUSD
ROI SR MD AP ROI SR MD AP ROI SR MD AP
B&H -0.48% -0.16 -3.62% 1 4.27% 0.76 -4.27% 1 0.69% 0.17 -4.34% 1
S&H 0.48% 0.159 -0.23% 1 -4.27% -0.8 -5.53% 1 -0.69% -0.17 -1.57% 1
GA-MR 10.75% 6.09 -0.16% 0.93 13.01% 4.32 -0.13% 0.55 17.56% 4.58 -0.32% 0.92
GA-MSSR 9.68% 6.68 -0.03% 0.35 12.98% 4.85 -0.08% 0.37 15.95% 5.97 -0.13% 0.45
USDCAD USDCHF USDJPY
ROI SR MD AP ROI SR MD AP ROI SR MD AP
B&H -0.97% -0.32 -0.99% 1 -2.21% -0.6 -2.21% 1 1.03% 0.21 -3.41% 1
S&H 0.97% 0.32 -1.84% 1 2.21% 0.59 -1.53% 1 -1.03% -0.21 -1.69% 1
GA-MR 14.20% 8.21 -0.03% 0.61 12.05% 7.29 -0.12% 0.46 5.12% 2.67 -0.14% 0.56
GA-MSSR 14.98% 8.85 -0.01% 0.42 11.74% 7.53 -0.09% 0.31 5.04% 2.91 -0.12% 0.32data for this specific pair. However, the worst performing pair is Sharpe ratio is one of the most important metrics to be
USDJPY which obtained a much lower annualized return and considered when it comes to evaluating a trading strategy.
relatively high drawdowns. Sharpe ratio measures the return over the standard deviation in
the return. It is commonly known that with higher risks we could
The average position for GA-MSSR has significantly lower have higher returns. The Sharpe ratio stands for the gradient
values than other benchmarks. It shows that the GA-MSSR can here. Therefore, the Sharpe ratio could also be interpreted as the
achieve similar level of returns with much less capital invested “value for money” strength. Generally, the trading system with
in the market. With a lower position in the market, the the higher the Sharpe ratio is a better choice. In a volatile market,
underlying risks is also reduced. such as forex, managing the risk is crucial to the long term
The table results have a leverage of 1:1 where the common management of a portfolio.
leverage used in forex could range from 1:20 to 1:300. A 1:20 Leverage is a common method used in the forex market. It
leverage is applied to the GA-MSSR results and the accumulated allows multiple amounts of capital to be invested whereas
returns over time is plotted in Fig. 8. All currency pairs are multiple loss or return would be experienced. The experiment
shown and the USDJPY has the worst performance. All other implemented has no leverage which is 1:1 ratio and the Fig. 8
pairs showed a stable and consistent upward trend with minor showed the simulated return using a 1:20 ratio. In practice,
drawdowns. The bad performance of USDJPY could be due to
higher leverage means higher risks which is rewarded with
regime changes and undetected news events. multiplied returns. The limitation of using very high leverages
B. Discussion is the chance of losing lots of money in one trade and the account
We propose the GA-MSSR model that can generate a would be blown. The GA-MSSR limited the maximum
superior trading strategy for 5-minute intraday data. The high drawdown to low levels and it allowed moderate leverage to be
ROI and Sharpe ratio indicates that the features derived using applied.
trading rules are good proxies to measure the trend of the price V. CONCLUSION, LIMITATIONS AND FUTURE WORK
movement in the long term. The size of the feature space could
grow infinitely large and the effect of feature space size is not The proposed feature engineering process provided quality
covered in the paper. However, the mechanism of the proposed features that are optimized based on the performance of the
model differs from other researches. Most of the papers strategy. The work showed how the technical indicators could
reviewed utilized directional prediction with machine learning be combined and optimized for trading purposes. The proposed
or next day price prediction. The proposed model does not GA-MSSR RoboTrading system uses 16 features as a higher-
perform any prediction on the future market. Instead, it finds a level interpretation of the market. The proposed model used
set of rules and formulate strategies only according to the novel risk-adjusted return measure, SSR, as the fitness function
technical indicators rules to optimize the overall performance of and generated consistent and superior results compared to other
the trading strategy. The directional prediction may only reveal benchmarks. The performance on the risk side is consistently
the short-term trend and offer no information on the risk good and the return achieved is outstanding. The best
management side. With regression networks, accurately performing currency pair on the testing dataset is AUDUSD
predicting the price at the next bar is very hard and longer which obtained an annual return of 320% with a 1:20 leverage.
timestep prediction has much higher variances. Trading rules are However, the proposed trading system has not taken the
designed and optimized to ignore the short-term fluctuations and transaction fees into account due to different pricing policies by
focus on the systematic practice to avoid risks and generate each broker and the time-variant nature of the spread cost.
stable returns. Therefore, accurately incorporating the transaction fee is a
challenge to be conquered in the future. Other methods such as
deep reinforcement learning [25] may be implemented to work
with rule-based features to optimize portfolio performance for
future works.
REFERENCES
[1] M. P. Taylor and H. Allen, "The use of technical analysis in the
foreign exchange market," Journal of international Money and
Finance, vol. 11, no. 3, pp. 304-314, 1992.
[2] M. Roondiwala, H. Patel, and S. Varma, "Predicting stock prices
using LSTM," International Journal of Science and Research
(IJSR), vol. 6, no. 4, pp. 1754-1756, 2017.
[3] T. Fischer and C. Krauss, "Deep learning with long short-term
memory networks for financial market predictions," European
Journal of Operational Research, vol. 270, no. 2, pp. 654-669,
2018.
[4] C. Li, D. Song, and D. Tao, "Multi-task recurrent neural networks
Fig. 8. Testing results accumulated return over time (2019) for all pairs tested and higher-order Markov random fields for stock price movement
with 1:20 leverage. prediction: Multi-task RNN and higer-order MRFs for stock price
classification," in Proceedings of the 25th ACM SIGKDDInternational Conference on Knowledge Discovery & Data Mining, [19] N. Maknickienė and A. Maknickas, "Application of neural network
2019, pp. 1141-1151. for forecasting of exchange rates and forex trading," in The 7th
[5] S. Selvin, R. Vinayakumar, E. Gopalakrishnan, V. K. Menon, and international scientific conference" Business and Management,
K. Soman, "Stock price prediction using LSTM, RNN and CNN- 2012, pp. 10-11.
sliding window model," in 2017 international conference on [20] P. B. Myszkowski and A. Bicz, "Evolutionary algorithm in forex
advances in computing, communications and informatics (icacci), trade strategy generation," in Proceedings of the International
2017: IEEE, pp. 1643-1647. Multiconference on Computer Science and Information Technology,
[6] Z. Zeng and M. Khushi, "Wavelet Denoising and Attention-based 2010: IEEE, pp. 81-88.
RNN-ARIMA Model to Predict Forex Price," in 2020 International [21] R. F. de Brito and A. L. Oliveira, "Comparative study of FOREX
Joint Conference on Neural Networks (IJCNN), 19-24 July 2020. trading systems built with SVR+ GHSOM and genetic algorithms
[7] W. Bao, J. Yue, and Y. Rao, "A deep learning framework for optimization of technical indicators," in 2012 IEEE 24th
financial time series using stacked autoencoders and long-short term international conference on tools with artificial intelligence, 2012,
memory," PloS one, vol. 12, no. 7, 2017. vol. 1: IEEE, pp. 351-358.
[8] Q. Gao, "Stock market forecasting using recurrent neural network," [22] B. J. de Almeida, R. F. Neves, and N. Horta, "Combining Support
University of Missouri--Columbia, 2016. Vector Machine with Genetic Algorithms to optimize investments
[9] B. M. Henrique, V. A. Sobreiro, and H. Kimura, "Stock price in Forex markets with high leverage," Applied Soft Computing, vol.
prediction using support vector regression on daily and up to the 64, pp. 596-613, 2018.
minute prices," The Journal of finance and data science, vol. 4, no. [23] D. Pradeepkumar and V. Ravi, "Soft computing hybrids for FOREX
3, pp. 183-201, 2018. rate prediction: A comprehensive review," Computers &
[10] H. Weerathunga and A. Silva, "DRNN-ARIMA Approach to Short- Operations Research, vol. 99, pp. 262-284, 2018.
term Trend Forecasting in Forex Market," in 2018 18th [24] A. Petropoulos, S. P. Chatzis, V. Siakoulis, and N. Vlachogiannakis,
International Conference on Advances in ICT for Emerging Regions "A stacked generalization system for automated FOREX portfolio
(ICTer), 2018: IEEE, pp. 287-293. trading," Expert Syst. Appl., vol. 90, no. C, pp. 290-302, 2017, doi:
[11] L. Zhang, C. Aggarwal, and G.-J. Qi, "Stock price prediction via 10.1016/j.eswa.2017.08.011.
discovering multi-frequency trading patterns," in Proceedings of the [25] T. L. Meng and M. Khushi, "Reinforcement Learning in Financial
23rd ACM SIGKDD international conference on knowledge Markets," Data, vol. 4, no. 3, 2019.
discovery and data mining, 2017, pp. 2141-2149.
[12] Y.-C. Tsai, J.-H. Chen, and J.-J. Wang, "Predict forex trend via
convolutional neural networks," Journal of Intelligent Systems,
2018.
[13] R. M. I. Kusuma, T.-T. Ho, W.-C. Kao, Y.-Y. Ou, and K.-L. Hua,
"Using Deep Learning Neural Networks and Candlestick Chart
Representation to Predict Stock Market," arXiv preprint
arXiv:1903.12258, 2019.
[14] O. B. Sezer and A. M. Ozbayoglu, "Algorithmic financial trading
with deep convolutional neural networks: Time series to image
conversion approach," Applied Soft Computing, vol. 70, pp. 525-
538, 2018.
[15] S. Sefiane and M. Benbouziane, "Portfolio selection using genetic
algorithm," 2012.
[16] L. Mendes, P. Godinho, and J. Dias, "A Forex trading system based
on a genetic algorithm," Journal of Heuristics, vol. 18, no. 4, pp.
627-656, 2012.
[17] M. Ozturk, I. H. Toroslu, and G. Fidan, "Heuristic based trading
system on Forex data using technical indicator rules," Applied Soft
Computing, vol. 43, pp. 170-186, 2016.
[18] C. Evans, K. Pappas, and F. Xhafa, "Utilizing artificial neural
networks and genetic algorithms to build an algo-trading model for
intra-day foreign exchange speculation," Mathematical and
Computer Modelling, vol. 58, no. 5-6, pp. 1249-1266, 2013.You can also read