Presenting and Evaluating the Banks Rating Model Using TOPSIS Technique
←
→
Page content transcription
If your browser does not render page correctly, please read the page content below
Int. J. Nonlinear Anal. Appl.
Volume 11, Special Issue, Winter and Spring 2020, 195-209
ISSN: 2008-6822 (electronic)
http://dx.doi.org/10.22075/ijnaa.2020.4593

Presenting and Evaluating the Banks Rating Model
Using TOPSIS Technique
Shoeib Abbasia , Amin Nazemib∗
a
 PhD Student, International Branch, Shiraz University, Shiraz, Iran.
b
 Assistant Professor, Department of Accounting, Economics, Management and Social Sciences college, Shiraz University,
Shiraz, Iran.

Abstract
An appropriate rating system in banks can clarify the status and performance of banks for its users.
Although many national and international rating institutions have been established, its absence
is felt in our country. In a rating system, it is necessary to take into account the economic and
environmental conditions of the country in order to evaluate the banks. For this purpose, in this
research, 35 criteria are selected according to the opinion of 34 banking and academic experts, and
using them, 15 banks in the 5-year period of 2014-2018 are ranked by the TOPSIS method. The
findings show that the indicators related to financial dimensions (liquidity, profitability, capital and
asset risk), qualitative dimensions (complexity and behavior of banks) and environmental dimensions
(economic variables, government support and industry characteristics) are effective in the indigenous
model of bank rating; In this regard, the financial health system and stock prices of banks are used
to evaluate the indigenous model; The results show that the indigenous model has a positive and
significant correlation with the financial health system; so that by identifying the position of the
bank in the indigenous model, its position can be relatively described within the financial health
system; Also, the results of the indigenous model show a positive and significant relationship with
the stock prices of banks. This evidence draws attention to the proposed indicators for evaluating
and rating banks.
Keywords: Banking Industry, Indigenous Criteria, Indigenous Rating, Financial Health, Market
Reaction.

    ∗
        Corresponding Author: Amin Nazemi
        Email address: aminnazemi@gmail.com, abbasishoeib@gmail.com (Shoeib Abbasia , Amin Nazemib∗ )

Received: February 2020      Revised: May 2020
196 Sh. Abbasi, A. Nazemi
1. Introduction
The rating system is a necessity for banks evaluation and comparison; as it can pave the way for an
oriented competition in an efficient performance so that it can meet the needs of stakeholders and
provide the way for economic stability and growth. In this way, it can protect banks from high-risk
and non-operational activities which could be a problem for a healthy economy. The lack of an
efficient rating system means ignoring the differences between banks, which might have numerous
devastating consequences along with the most issues caused by unauthorized financial institutions
for the country’s economy.
On the other hand, attracting foreign investors into the country which is necessary for economic
growth and prosperity, requires transparency and the required legal frameworks to satisfy banking
health; these reasons have made the existence of a desired accreditation system necessary which can
provide a comprehensive and logical assessment within country situation and satisfy the national
and international requirements and concerns of banks. In this research, the main goal is to propose
a suitable framework for creating a rating system in banks.
Banks typically use the banking health system to determine the strength of financial affordance
in order to evaluate flexibility and fulfillment of financial obligations, which can result in better
performance and higher transparency in banks to provide better decision-making for stakeholders.
In this regard, applying various financial criteria in this system has led to considering their possible
relationship with the indigenous model of rating in this research.
2. Theoretical Basics and Background
The existence of different types of loans, default risk, interference of external factors such as
government, high liquidity and intrinsic risk are among the factors that increase and diversify the
risk and decrease the transparency of banks’ information over the other economic sectors, which
causes challenges and differences in the results of ranked institutions; therefore, determining the
rating model of banks requires the identification of effective factors. Hu et al. [14] and Mashayekh et
al. [21] have shown that the structure of countries including the economic, legal, cultural, property
and managerial issues, as well as the type and aim of rating affect the rating of banks. For this reason,
countries usually design a condition-based appropriate model according to their pivotal structure and
purpose.
In general, the rating institutions have two approaches in facing banks rating; financial strength
or stand-alone rating and all-in-rating or credit rating. In financial strength rating, the rating
institutions seek to assess the intrinsic value and performance of the bank without considering the
external factors, while in the all-in-rating, in addition to the intrinsic value and performance of the
bank, the impact of external factors affecting the performance of the bank is also measured; and as
a result, a comprehensive assessment can be presented. This study tries to provide a comprehensive
assessment for the evaluation of banks.
Despite the lack of an independent credit rating institute and indigenous rating system of banks in
Iran, many national and international credit rating institutes have been established. There are three
well-known international rating institutes, namely Standard & Poor’s, Moody’s and Fitch. Also, at
the national level, we can refer to Capital Standards Rating (CSR), Investment Information & Credit
Rating Agency of India Ltd (ICRA), European Rating Agency (ERA) in Slovakia and Rating Agency
Malaysia (RAM). The quantitative and qualitative criteria have been used in all these national and
international institutions [21].
Therefore, in this study, we try to identify the indigenous rating model based on quantitative
and qualitative criteria by covering the effective factors on the structure of the country’s banks inPresenting and Evaluating the Banks Rating Model Using TOPSIS Technique
Volume 11, Special Issue, Winter and Spring 2020, 195-209 197
economic, cultural and managerial aspects in order to provide an efficient and indigenous model with
an applicability at the national level and compares with other international institutions.
The financial health means profitability and the activity continuation of economic unit [11]. This
is very important for stakeholders; this issue is much more important in Iran due to the sanctions
and managers’ inefficiency which has led to economic disorder and financial crises as well as the
bankruptcy of companies at the micro and macro levels [12]. The financial health of banks represents
the state of economic development in a country [4]. In fact, the financial health is related to the
activity continuation, bankruptcy, financial distress and the qualitative characteristics of accounting
information (relevance and reliability) [3]. Therefore, the financial health has significant importance,
as it improves the performance of investment and lending as well as identification of future problems
in addition to helping policymakers in order to prevent and reduce the probability of sudden shocks
and finally improve the financial resources allocation flow [11].
Therefore, considering the factors forming the proposed indigenous rating model, including the
quantitative and qualitative criteria of performance and governing structure of banks, and on the
other hand, regarding the performance and components of the financial health system, we can expect
that the proposed indigenous model has a relative correlation with this system; The indigenous
model can assess the performance of banks better according to the performance range and having
more constituents than the financial health system, as the financial health is a part of the rating
performance; Therefore, predicting the financial health of banks by the proposed rating model can be
considered as a tool to measure the indigenous pattern. Furthermore, the rate of correlation between
the results of the proposed model and the stock price, which can be due to the market reaction to
the bank status, can be used as another tool to evaluate the proposed model.
MahdaviParsa et al. [6] have studied the rating of Iran banks based on corporate governance
and considered the board of directors as one of the most important effective aspects of corporate
governance. The results have shown that the private banks have a better status than state-owned
banks.
Parsafard et al [17] have studied the independent credit rating of banks used by depositors.
They have identified criteria by the CAMELS system (the most well-known system for evaluating
banking and credit institutions based on six areas, capital adequacy, asset quality, management
quality, profitability, liquidity, and market risk sensitivity), so 32 criteria with equal weights have
been determined by Fuzzy Delphi method and they have performed rating during the period of 2012-
2016 in 21 banks. The obtained results have shown that the Middle East Bank is at the first rank
and Ayandeh Bank is at the last rank.
Ramezani et al. [18] have evaluated and predicted the health of selected banks in Iran using
CAMELS indicators. In this respect, 20 public and private banks in the period of 2009-2013 have
been studied. 17 financial ratios have been tested as independent variables by panel data regression
model and stepping method; then their relation with bank health has been evaluated. The results
have shown that 6 ratios with 75.2% strength are able to evaluate and predict the health of banks.
Arza et al. [2] have studied the rating of Iranian private banks using an analytic hierarchy
process. To this end, they have identified criteria based on the CAMELS system. Then, the criteria’s
coefficient of importance has been determined by Delphi method. The results have shown that the
banks of the Middle East, Pasargad, Ghavamin, Karafarin and Sina outperformed over other banks
based on five-year data.
Beheshtinia et al. [13] have studied the rating model of banks in Iran. For this purpose, they
have considered the balanced score card indicators and social responsibility. They have determined
6 dimensions and 25 components using Delphi method and ranked the banks using the TOPSIS
method. The results have shown that the financial and social indicators are 22% and 16% effective198 Sh. Abbasi, A. Nazemi
in rating, respectively.
Choy et al. [22] has stated that the applied criteria in rating agencies have small and large
differences in terms of goals and sensitivities, which in turn has led to differences in rating results as
well as differences among rating agencies; For this reason, it is recommended to have common goals
for important decisions; The results also show that rating requires a broad view that it is better to
include indirect factors in addition to direct ones.
Mustari et al. [10] have studied and analyzed the performance of Canara Bank in India by
CAMELS method. They have tried to use the capability of CAMELS model to measure the financial
satisfaction as a financial intermediary. The results have shown that Canara Bank should enhance its
asset quality and consider the sustainable procedure and management stability to increase revenue.
Rahman et al. [23] have studied and evaluated the performance of selected private banks in
Bangladesh using the CAMELS rating. The data of 2010-2016 have been used for analysis. The
result of this analysis has shown the rating of banks based on CAMELS.
Karminsky et al. [5] have studied the design of banks rating model over a 15-year period; there-
fore, they have tested sustainability, capital market, market power, market structure, market order,
geographical diversity, profit stability, income diversity, corporate governance, risk management,
legal environment and operational environment such as stability in economic, efficiency, liquidity,
capital adequacy, asset quality and the quality of management. The results have shown that the
macro variables improve the explanatory power. In addition, the rating is influenced by the business
cycle of the economy.
3. Research Questions
The questions that can be raised in this research are as follow:
1) What are the effective indicators in measuring the rating of banks in Iran?
2) What is the impact of their indicators and components on the indigenous model of banks’
rating?
3) How is the rating of selected banks in the indigenous model?
4) How is the predictive power of the financial health system by the indigenous model of rating?
5) How is the relationship between indigenous model and stock prices?
4. Research Conceptual Models
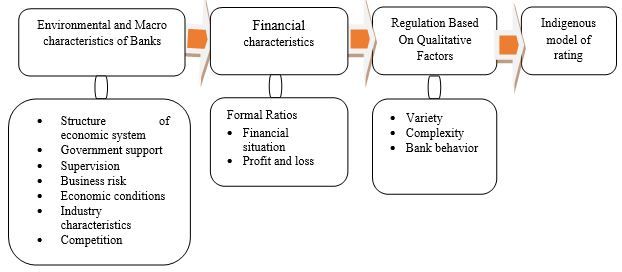
4.1. Indigenous Rating Model
In this research, we try to provide a comprehensive and regulated framework by comparing the
models of reliable rating institutions at an international level such as Moody’s, S & P and Fitch.
Figure 1 shows the schematic of this model.Presenting and Evaluating the Banks Rating Model Using TOPSIS Technique
Volume 11, Special Issue, Winter and Spring 2020, 195-209 199
Figure 1: Indigenous model of rating
4.2. Financial Health System Model
Ahmadian [1], MirbageriHir et al. [7], Salimi et al. [19] and Arza et al. [2] have used CAMELS
as a basis for measuring bank health in Iran banks. Table 1 represents the applied criteria in bank
health analysis.
Table 1: The criteria applied in bank health evaluation
Criterion Operational Definition (How to Calculate) Effect
The result of dividing the base capital by the sum of the +
Capital weighted assets to the risk coefficients in percentage
adequacy The ratio of legal deposits to total deposits +
Property to capital ratio -
Debt ratio to equity -
The ratio of non-current facilities to the total of granted facilities -
The ratio of fixed tangible and intangible assets to equity -
after deductible accumulated profits
Asset The ratio of total granted facilities to total assets +
quality The ratio of the cost of bad debt to the total granted facilities -
The ratio of bad debt reserves to the total of granted facilities +
The ratio of non-performing loans to total assets -
The ratio of obligation cost and ownership documents to +
non-performing loans
The ratio of the cost bad debt to the total costs -
The ratio of net profit to the number of employees +
Management The ratio of total common and non-common income of the bank +
quality to the total costs
Growth rate of granted facilities +
Net profit growth rate +
Deposit growth rate +200 Sh. Abbasi, A. Nazemi
The ratio of net profit to total common and non-common income +
The difference between the interest received from the granted +
facilities and the interest paid to the deposits
The ratio of net profit to total assets +
Profitability The ratio of total fee and interest received from granted facilities +
to total common and non-common income
The ratio of net profit to total equity +
The ratio of the obligation cost to the granted facilities income -
The ratio of cash and quasi-cash to the total deposits +
The ratio of cash and quasi-cash to the demand deposits +
Liquidity The ratio of fast-marketable investments to total investments +
The ratio of cash and quasi-cash to short-term liabilities and debts +
The ratio of total granted facilities to total deposits -
The ratio of the net absolute value of currency assets to equity -
Market risk The ratio of the total investments and corporate bond to the total assets -
sensitivity Beta bank stocks in Tehran Stock Exchange Market -
The ratio of sight deposits to total deposits -
5. Methodology
The aim of this research is practical-developmental and it has survey-based data collection method
due to applying a questionnaire. It can also be considered experimental by launching it within the
selected banks.
5.1. Research Statistical Population and Samples
In this research, the banking experts are used to collect questionnaire data. In order to improve
the quality and validity of this research, experts are selected with the following characteristics:
1. Having master or higher degrees in banking, accounting, finance, economy or management,
2. Having more than 10 years of management experience in the banking system or 5 years of
banking industry analysis in brokerage, investment and financing companies, or
3. Be a well-known university professor with relevant work experience.
Due to the specialization of the subject and the limitation of experts, a judicial and available sampling
is used to select the samples;
Therefore, by examining the experts’ histories, 34 eligible experts have been selected. On the
other hand, to empirically test the rating criteria, sampling has not been used due to the limited
statistical population of stock exchange and off-exchange banks. For this, all the banks listed on the
stock exchange and off-exchange with the following conditions in 2014-2018 have been selected:
• Their required information is available.
• The have been listed in the exchange (bourse) before 2014.
• Their financial statements have been audited.
In this case, 15 eligible banks have been selected.Presenting and Evaluating the Banks Rating Model Using TOPSIS Technique
Volume 11, Special Issue, Winter and Spring 2020, 195-209 201
5.2. Data Collection Tools and Methods and Research Data Analysis
To collect data related to theoretical basics and related works, websites and professional Persian
and English publications are used. Also, the results of questionnaire are used to identify the indicators
and relevant components as well as determine their influence on the rating model. To specify the
positions of the given components, the experts are asked to give their opinion on the proposed rating
components based on 7-point Likert Scale by Delphi method. The Delphi technique is a regular
and repetitive method for public survey which uses the opinion of experts so that it minimizes the
inconsistencies and has more accurate results [16]. The minimum number of 10 experts has been
reported in literature [8]. As the rating criteria are determined, the data of the selected components
are extracted from the audited financial statements at Codal site.
In this research, the weight of each component is obtained by the geometric mean method of
the questionnaire answers to each component and TOPSIS method is used for rating. The TOPSIS
method (sorting of priorities upon similarity to the ideal solution) is one of the widely used methods;
This method is based on this fact that each selected factor must have the minimum distance from
the ideal positive factor (most significant) and the maximum distance from the ideal negative factor
(least significant), which is considered as the criterion of factors prioritization [15]. Following the
pre-requisite steps, the TOPSIS method is obtained by [9]:
rij
nij = qP (5.1)
m 2
i=1 rij
where,
nij : Unscaled matrix components
rij : The components of the decision matrix
In the next step, the weighed scale matrix is formed by assuming the W vector:
W = {W1 , W2 , · · · , Wn } (5.2)
V11 · · · V1j · · · V1n
ND · Wn∗n = ... ..
.
..
.
..
.
..
. (5.3)
Vm1 · · · Vmj · · · Vmn
where,
W : Weight of variables
ND : Unscaled matrix
Thus, ND is a matrix in which the scores of the indices are unscaled and comparable, and Wn∗n is a
diameter matrix in which only the elements of the main diameter are non-zero.
In the next step, the positive ideal solution (A+ ) and the negative ideal solution (A− ) are obtained
as follows:
n o
′
+
A = max Vij |j ∈ J , min Vij |j ∈ J i = 1, 2, · · · , m = {V1+ , V2+ , · · · , Vj+ , · · · , Vn+ }
i i
(5.4)
n o
−
A = min Vij |j ∈ J , max Vij |j ∈ J ′
i = 1, 2, · · · , m = {V1− , V2− , · · · , Vj− , · · · , Vn− }
i i
(5.5)202 Sh. Abbasi, A. Nazemi
So that, J = {j = 1, 2, · · · , n|j} is desirable indicators
J ′ = {j = 1, 2, · · · , n|j} is undesirable indicators
Vij− : Negative ideal
Vij+ : Positive ideal
In the next step, the distances of each item from the ideals are calculated by the Euclidean method:
( n )0.5
X
di+ = (Vij − Vj )
+ 2
, i = 1, 2, · · · , m (5.6)
j=1
( n )0.5
X
di− = (Vij − Vj− )2 , i = 1, 2, · · · , m (5.7)
j=1
Finally, the relative proximity of Ai to the ideal solution is calculated as follows:
di−
Cli+ = , 0 ≤ cli+ ≤ 1, i = 1, 2, · · · , m (5.8)
(di+ + di− )
where, Cli+ is the distance of each variable from the positive ideal.
As shown in (5.5), if Ai = A+ , then di+ = 0 and Cli+ = 1, if Ai = A− , then di− = 0 and Cli+ = 0,
So, the closer the Ai to the ideal positive (A+ ), the closer the value of Cli+ will be to 1 and the
farther the Ai to the positive ideal (A− ), the closer the value of Cli+ will be to zero. Therefore, the
available components can be rated in descending order of Cli+ .
Next, in order to compare the rating results of indigenous components with rating based on
banking health indicators, the regression equation and variance analysis are used to determine the
correlation. Regression refers to the prediction of the value of a dependent variable on the values of
one or more independent variables. To measure the predictive power of financial health using the
indigenous model, the following simple linear regression model is used.
F ABi,t = β0 + β1 IRM B + ϵi,t (5.9)
where,
F ABi,t : Bank financial health criteria
IRM Bi,t : Criterion of indigenous rating model
ϵi,t : Regression model
Finally, the Spearman correlation test is used to examine the relationship between the indigenous
rating model and the market stock prices.
6. Research Findings
6.1. Research Reliability
The reliability of the variables means that the variance and mean of the variables over time and
the covariance of the variables during different ages are constant. Therefore, using these factors in
the model does not cause false regression. For this purpose, the methods of Levin, Lin & Chu, Im,
Pesaran & Shin W-stat and Hardi have been used for reliability of research variables [20].Presenting and Evaluating the Banks Rating Model Using TOPSIS Technique
Volume 11, Special Issue, Winter and Spring 2020, 195-209 203
Table 2: Reliability test of indigenous model variables
Test Value Probability
Levin, Lin & Chu - 36.8366 0.000
Im, Pesaran & Shin 39.648 0.000
Hardi 5.86896 0.000
The probability is at a significant level of 0.000, so it can be said that the reliability of the data
is acceptable and the results of data analysis are reliable.
6.2. Proposed Indigenous Rating Components
By analyzing the questionnaires filled by bank experts on the existence and importance of each
component in the structure of the Indigenous model in the form of the proposed components and
studying the existence of required data for each component in Tehran Stock Exchange, finally the
indicators and components of financial instruments, Islamic banking, political conditions of the bank
and the observance of the rules have eliminated; therefore, 35 of the 52 components have been
identified and determined; Then, by extracting the questionnaire data and using the geometric mean
method, the weight of each component in the model has been determined. Table 3 shows the results
of this process.
Table 3: Indicators and weights associated with indigenous model rating components
Aspects Components Sub-components Measurement Way Effect Weight
Government Extent of ownership in
Government ownership ratio - 0.017
Environmental and macro characteristics of banks
support the government
Gross domestic product GNP = C + I + G +(X – I)
+ 0.029
Growth (GDP) + NFP
Credit terms Bank share ratio of GDP + 0.030
Economic Exchange growth rate / △ ê = / △ p − / △ p∗ . - 0.013
variables Guaranteed interest rate
Guaranteed interest rate announced by the + 0.029
Central Bank
Inflation rate announced
Inflation rate - 0.030
by Statistics Center
Competition rate Herfindahl-Hirschman Index + 0.031
Duggan Herfindahl-
Concentration + 0.030
Hirschman Index
Banking The ratio of bank asset to
+ 0.033
industry total bank asset
features Market share The ratio of bank deposits to
+ 0.033
total bank deposits
Ratio of shares divided by
+ 0.033
total shares of banks204 Sh. Abbasi, A. Nazemi
Capital to assets ratio + 0.035
capital Capital adequacy ratios
Debt to equity ratio - 0.013
Non-current facilities to
- 0.018
total granted facilities ratio
Asset risk Asset Quality Ratios
Total granted facilities to
+ 0.035
Quantitative characteristics
total assets ratio
The difference between the
ed interest on the granted
Profitability Profitability ratios facility and the interest paid + 0.033
on the deposits
Net profit to total equity ratio + 0.032
Cash and cash equivalent to
+ 0.034
total deposits ratio
Cash and cash equivalent to
Liquidity Liquidity ratios short-term liabilities and + 0.035
debts ratio
Total granted facilities to
- 0.033
total deposits ratio
Other financial Bank risk Absolute value of foreign
- 0.029
characteristics assessment ratios currency assets to equity ratio
Variety of Banks Percentage of revenue to the Revenue of services to
+ 0.032
Activities type of provided service total revenue ratio
Geographical
Number of branches + 0.032
distribution
Institutional
Ownership of legal entities ratio - 0.033
Ownership
structure
owners
Complexity of Real owners Ownership of real entities ratio + 0.011
Banking ownership Total shares of real or legal
Activities Concentration persons with more than - 0.031
5% shares
Qualitative characteristics
Consistency of Compliance of the Bank’s
accounting methods with Financial Statements with
+ 0.031
international standards International Financial
Reporting Standards
audit quality + 0.005
Banking governance Transparency and information
+ 0.033
criteria disclosure
Independence of the Board + 0.032
Management Ownership + 0.032
profits and rewards Dividend interest per share + 0.032
Banks behavior
division policies Bonus paid + 0.031
-ting information
Reduce agency
Quality of accoun
Over-investment - 0.029
costs
Reduce
information Reporting delay - 0.029
asymmetryPresenting and Evaluating the Banks Rating Model Using TOPSIS Technique
Volume 11, Special Issue, Winter and Spring 2020, 195-209 205
6.3. Banks Rating in Designed Indigenous Model
After identifying the effective components and their weight in the indigenous model structure,
the data related to the components have been extracted; Then, the banks rating has been performed
by TOPSIS method for the consecutive years of 2014-2018; The mean 5-year period has also been
used to create more explanatory power and have a longer-term view and a more accurate prediction
of the banks’ status.
Table 4: Banks rating by the proposed indigenous model
2014 2015 2016 2017 2018 5-year period
Bank
CL R CL R CL R CL R CL R Average Rank
Eghtesad Novin 0.418 11 0.497 7 0.473 4 0.442 6 0.477 9 0.46 6
Ansar 0.439 7 0.472 11 0.464 6 0.416 12 0.529 2 0.462 5
Parsian 0.439 6 0.525 2 0.471 5 0.424 10 0.49 7 0.468 3
Pasargad 0.502 1 0.602 1 0.521 1 0.45 5 0.506 5 0.514 1
Tejarat 0.336 15 0.48 8 0.473 3 0.458 3 0.498 6 0.445 11
Middle East 0.426 9 0.478 9 0.445 11 0.431 8 0.507 4 0.456 8
Sina 0.429 8 0.521 3 0.452 8 0.458 2 0.477 10 0.467 4
Saderat Iran 0.426 10 0.437 14 0.461 7 0.441 7 0.49 8 0.451 10
Mellat 0.483 2 0.503 6 0.448 10 0.397 14 0.434 14 0.451 9
Karafarin 0.453 5 0.503 5 0.478 2 0.429 9 0.534 1 0.478 2
Post Bank of Iran 0.383 14 0.426 15 0.361 15 0.4 13 0.458 12 0.404 15
Ayandeh 0.48 3 0.509 4 0.405 13 0.388 15 0.44 13 0.442 12
Hekmat Iranian 0.408 12 0.442 13 0.452 9 0.469 1 0.521 3 0.457 7
Day 0.402 13 0.476 10 0.437 12 0.451 4 0.415 15 0.435 13
Saman 0.453 4 0.458 12 0.394 14 0.418 11 0.459 11 0.435 14
The ratings show that the banks of the Pasargad, Karafarin and Parsian are the closest to the
positive ideal and, as a result, they have the higher rates in the mean 5-year period. And banks of
Day, Saman and Postbank are the most distant from the positive ideal and therefore have a lower
rank.
6.4. Banks Rating with Financial Health System
The financial health system consists of 32 financial criteria, where table 5 shows the ratings of
banks by selected and average years with these criteria.
Table 5: Banks rating based on financial health system
2014 2015 2016 2017 2018 5-year period
Bank
CL R CL R CL R CL R CL R Average Rank
Eghtesad Novin 0.445 10 0.476 8 0.484 8 0.582 4 0.576 5 0.51 5
Ansar 0.450 9 0.484 6 0.475 11 0.504 10 0.543 9 0.490 10
Parsian 0.439 11 0.570 1 0.604 1 0.542 8 0.587 2 0.545 1
Pasargad 0.488 2 0.490 3 0.488 6 0.544 7 0.543 8 0.510 4
Tejarat 0.430 12 0.405 14 0.491 4 0.599 2 0.611 1 0.50 6
Middle East 0.459 6 0.487 5 0.471 12 0.584 3 0.486 14 0.495 9
Sina 0.402 15 0.453 12 0.448 13 0.551 6 0.534 11 0.474 12206 Sh. Abbasi, A. Nazemi
Saderat Iran 0.429 13 0.447 13 0.484 9 0.570 5 0.584 3 0.499 7
Mellat 0.472 3 0.374 15 0.317 15 0.464 15 0.549 6 0.427 15
Karafarin 0.469 4 0.497 2 0.512 2 0.538 9 0.580 4 0.518 2
Post Bank of Iran 0.469 5 0.490 4 0.507 3 0.610 1 0.512 13 0.515 3
Ayandeh 0.458 7 0.473 9 0.484 7 0.486 11 0.546 7 0.489 11
Hekmat Iranian 0.453 8 0.483 7 0.476 10 0.482 12 0.448 15 0.468 14
Day 0.568 1 0.473 10 0.441 14 0.476 14 0.539 10 0.497 8
Saman 0.414 14 0.453 11 0.488 5 0.479 13 0.518 12 0.469 13
According to the geometric mean column, Parsian, Karafarin and Postbank banks are ranked at
first to third ranks, respectively.
6.5. Correlation and Predictive Power of Results
In this research, the data panel method is used to fit the regression model. In order to measure
the panel data versus pooling data, F-Limer test (determination of heterogeneity) is used; Then, the
relationship between indigenous rating model and financial health system is evaluated by Hausman
test (determination of fixed or random effects), t-test, F-Fisher and determination coefficient. A
simple linear regression model is used to measure the predictive power of financial health using the
indigenous model.
Table 6: F-Limer test to determine panel or pooling method
Test statistics Degrees of freedom Significance level
2.255127 13.35 0.0279
The results of F-Limer test indicate that the data panel method is suitable for estimating the
model; therefore, the Hausman test is used to determine the fixed or random effects in Table 6.
Table 7: Hausman test
Test statistics Degrees of freedom Significance level
0.065624 1 0.7978
The results show that the random effects are suitable for estimating the model; so, the regression
model is fitted by the data panel method with random effects where the results are given in Table 7.
Table 8: Results of regression model fitting and coefficient estimation
Symbol standard Significance
Variables Coefficients test t Result
coefficient error level
Fixed
β0 0.325473 0.1058855 3.073825 0.0041
coefficient
Indigenous Direct and
β1 0.332888 0.162493 2.04863 0.0404
rating model significant
General Significance
Coefficient of determination Durbin-Watson Test F-Statistics
results of level
the model 0.457871 0.013455 2.111452 0.03664Presenting and Evaluating the Banks Rating Model Using TOPSIS Technique
Volume 11, Special Issue, Winter and Spring 2020, 195-209 207
The results show that Fisher’s statistic with 2.111, is higher than the corresponding statistic;
therefore, the fitted model is significant and has acceptable performance. The coefficient of determi-
nation indicates that 45.78% of the changes in the financial health criterion can be explained based on
the indigenous rating model. Also, the value of the Durbin–Watson statistic is 2.013, which indicates
that there is no correlation between the error terms. The regression coefficient with 0.95 confidence
shows that the criteria of the indigenous model have a direct and significant effect on the financial
health of banks; And as the bank’s rank increases in the indigenous model criteria, the bank’s rank
in the financial health criterion also increases.
6.6. Comparison of Indigenous Model Ratings with Market Stock Prices
First, the Kolmogorov–Smirnov test is used to identify the normality of data distribution, which
is shown in Table 9.
Table 9: Kolmogorov–Smirnov normalization test
Variable Average Standard deviation Kolmogorov-Smirnov test Significance
Indigenous rating model 0.49267 0.101049 0.189 0.000
According to the obtained results and the significance of the test, Spearman’s non-parametric
test is used to investigate the correlation between rank and market price, shown in Table 10.
Table 10: Rating correlation with stock price by Spearman test
Spearman test Coefficient of variation Rank
Correlation coefficient with price changes -0.231
1.000
Significance 0.037
Number 82
Correlation coefficient with rank changes -0.231
Significance 0.037 0.000
Number 82
The findings indicate that the higher the rank (closer to one), the higher the price.
7. Discussion, Conclusion and Future Works
The findings show that in addition to the financial dimensions, it is necessary to consider the
qualitative and environmental dimensions in the evaluation and rating of banks; It is also recom-
mended to consider the impact of the components on the model for better evaluation, since assuming
the importance of the components as the same means ignoring the economic, political and banking
system differences that can lead to misleading results. These results are consistent with the rating
of the well-known institutions such as Moody’s, S&P and Fitch, as well as the national ratings of
countries such as Pakra in Pakistan and Ram in Malaysia.
The rating results have shown that among the selected banks, Pasargad and Karafarin have the
first and second ranks and the post bank has the last rank which has almost the same results as the
researches of Parsafard et al. [17] and Salimi et al. [19] (the rating of banks is the same in some
cases and close to each other in the other ones, compared to the existing researches).
According to the research findings, the ratings obtained from the indigenous model with the
financial health system are relatively close, so that by determining the bank’s rating in the indigenous208 Sh. Abbasi, A. Nazemi
model, its position within the financial health system can be predicted relatively; therefore, it can be
said that there is a good correlation between them. These results are reasonable and expected. Given
that in addition to the criteria of financial health, other criteria have been used in the indigenous
model, it can be expected that the results of this model are more logical and real and can be used
by decision makers for various purposes.
Along with another test of the effectiveness of the designed indigenous model in this study, the
possible relationship between the obtained ratings and the market share price has been examined.
The findings have shown that there is a positive and significant relationship between them, so it can
be concluded that a bank with better rank in the indigenous model also has a higher price in the
market, which can indicate better bank performance. Therefore, it can be expected that the results
of the rating are reasonable and reliable.
The lack of reliable data about some factors have led to their exclusion, which could have led to
better results in the rating model. The components of Islamic banking, political conditions, financial
tools as well as laws observance are among the items that have been excluded due to the lack of
data in this research. Therefore, it is recommended that reliable data are used along with other
criteria in banks evaluation, given the great importance of the impact of these components on the
rating of banks in developing countries such as Iran. Furthermore, it is recommended that the rating
is performed in other industries, such as insurance and competing industries in order to meet the
increasing requirements of customers for decision making.
References
[1] A. Ahmadian, Evaluation of Banking Health Indicators in Iranian Banks (2012-2013), Monetary and Banking
Research Institute of the Central Bank of the Islamic Republic of Iran, 2013.
[2] A. Erza, S. Qasempour, Rating of Private Banks of Iran Based on CAMLES Model Using Hybrid Approach of
Analytic Hierarchy Process and ARAS, Financial Management Strategy, 5.18 (2017): 99-118.
[3] A. Kritsonis, Assessing a Firm’s Future Financial Health, Int J Scholarey Acad Interlectual Divers, 9.1 (2005):
2004-5.
[4] A. Kumar, S. Abirami, Aspect-based Opinion Ranking Framework for Product Reviews Using a Spearman’s
Rank Correlation Coefficient Method, Information Sciences, 460 (2018): 23-41.
[5] A.M. Karminsky, E. Khromova, Extended Modeling of Banks’ Credit Ratings, Procedia Computer Science 91
(2016): 201-210.
[6] A. MahdaviParsa and M. NoorAhmadi, Ranking of Iranian Banks Based on Corporate Governance Consideration
in Upstream Bank Documents, Journal of Investment Knowledge Research, 7.6 (2019): 199-220.
[7] B. MirbagheriHir, M.R.N. Amirkhiz, S. ShokouhiFard, Assessing Financial Stability and Explaining the Effective
Factors on Financial Stability of the Country’s Banks, Quarterly Journal of Financial and Economic Policy, 4.15
(2016): 23-42.
[8] F. Ahmadi, K. Nasiryani, P. Abazari, The Delphi Technique: A Tool for Research, Journal of Medical Sciences,
8.1 (2008): 175-185.
[9] F. Soheili, H. SeyyedTajjar, M. Hosseini, H. Ahmadi, Ranking Central Libraries of Comprehensive and Industrial
Universities by TOPSIS Method, Academic Librarianship and Information Research, 52.3 (2018): 13-37.
[10] H. Mustari, W. Shivaji, An Analysis of the Performance of Canara Bank Using CAMEL Approach, An Interna-
tional Journal of Scientific Research 7.1 (2018): 599-602.
[11] International Monetary Fund, 2018. [Online]. Available: http://data.imf.org/?sk=51B096FA-2CD2-40C2-8D09-
0699CC1764DA.
[12] J. Nikkar, M. Hemmatfar, M. Assami, The Impact of Investment on Intangible Assets in Explaining the Effect
of Financial Health and Agency Problems on Company Market Value, Asset Management and Financing, 1.20
(2018): 11-27.
[13] M. Beheshtinia, S. Omidi, Presenting a New Approach for Banks Ranking with New World Criteria, Strategic
and macro policies, 5.17 (2017): 27-53.
[14] M. Haq, D. Hu, R. Faff and S. Pathan, New Evidence on National Culture and Bank Capital Structure, Pacific-
Basin Finance Journal 50 (2018): 41-64.Presenting and Evaluating the Banks Rating Model Using TOPSIS Technique
Volume 11, Special Issue, Winter and Spring 2020, 195-209 209
[15] M. Kanaani, Z. Babazadeh, Development Analysis Based on Ecological Capacity with TOPSIS Model (Case
Study: Amol City of Mazandaran Province, Iranian Natural Ecosystem, 1.4 (2011): 22-31.
[16] M. Namazi, H. Rajabdari, Test of ”Applied Model for Sustainable Development of Professional Accounting Ethics”
using Confirmatory Factor Analysis, Financial Accounting and Auditing Research, 11.43 (2019): 1-26.
[17] M. Parsafard, S. Shirkund, R. Tehrani and M. Mirlohi, Independent Credit Ranking of Country Banks, Journal
of Industrial Management, 10.4 (2018): 575-606.
[18] M. Ramezani, M. Kharashadizadeh, E. MohammadiYoshu, Provide a Model for Assessing and Predicting the
Health of Selected Iranian Banks Using CAMELS Indicators, Economic Research and Policy, 25.82 (2017): 43-
78.
[19] M. Salimi, H. Sarolia, S. Qasempour, Designing an Indigenous Banking Ranking Model for Iranian Banks based
on Banking Health, Financial Research, 4.18 (2016): 653-674.
[20] R. Abdi, M. Zeinali, V. Taghizadeh, The Effect of Managerial Ownership on the Relationship Between Free Cash
Flows and Investment Inefficiency, Research in Financial Accounting and Auditing, 9.35 (2017): 157-191.
[21] S. Mashaykh and S. Shahrokhi, Corporate Credit Rating System in World, Accounting Research, 4.4 (2015):
131-148.
[22] S.Y. Choy, M.M. Chit, W.L. Teo, Sovereign Credit Ratings: Discovering Unorthodox Factors and Variables,
Global Finance Journal, (2020): 100548.
[23] Z. Rahman, S. Islam, Use of CAMEL Rating Framework: A Comparative Performance Evaluation of Selected
Bangladeshi Private Commercial Banks, International Journal of Economics and Finance, 10.1 (2018): 1916-9728.You can also read