Preparation of Activated Carbon from Durian Rind with Difference Activations and Its Optimization
←
→
Page content transcription
If your browser does not render page correctly, please read the page content below
Tech Science Press

DOI: 10.32604/jrm.2021.012560

ARTICLE

Preparation of Activated Carbon from Durian Rind with Difference Activations
and Its Optimization

Pongsert Sriprom1, Warawut Krusong2 and Pornsawan Assawasaengrat3,*
1
    Program of Food Process Engineering, Faculty of Agro-Industry, King Mongkut’s Institute of Technology Ladkrabang, 10520,
    Bangkok, Thailand
2
    Program of Fermentation in Food industry, Faculty of Agro-Industry, King Mongkut’s Institute of Technology Ladkrabang, 10520,
    Bangkok, Thailand
3
    Department of Chemical Engineering, Faculty of Engineering, King Mongkut’s Institute of Technology Ladkrabang, 10520,
    Bangkok, Thailand
*
    Corresponding Author: Pornsawan Assawasaengrat. Email: pornsawan.as@kmitl.ac.th
Received: 04 July 2020 Accepted: 23 September 2020

     ABSTRACT
     Durian rind wastes are an important raw material for activated carbon production due to their renewable
     sources and low-cost materials. The efficiency of increasing surface area and the quantity of oxygen groups
     on the surface of activated carbon were studied for the preparation of activated carbon. The preparation of
     activated carbon has been studied with the different methods as follows: activation by acid, activation by base,
     hydrothermal and activation by acid, and hydrothermal and activation by base. The results showed that hydro-
     thermal and activation by acid had high iodine number which was chosen to determine the optimum condition
     for activated carbon preparation. The optimum condition for preparation of durian rind activated carbon was
     studied by Box-Behnken design. Solid/water ratio, solid/acid ratio and temperature were chosen as the impor-
     tant parameters for achieving the optimum reaction condition. The reaction products were analyzed by iodine
     number. Based on the results, the optimum condition for preparation of durian rind activated carbon was pre-
     dicted using RSM. The maximum iodine number of 626.47 mg/g was expected at the optimum condition: solid/
     water ratio (1:175, g/mL), solid/acid ratio (1:23, g/mL) and temperature (500°C). The preparation of durian
     rind activated carbon at the optimal condition was carried; the percentages of iodine number achieved
     (666.73 ± 6 mg/g) were close to the maximum predicted value (666.73 mg/g), thus verifying the model. At
     the optimum condition, the functional group on surface of durian rind activated carbon was characterized
     by FT-IR. The result showed that the oxygen content on surface was increased in the form of carbonyl and
     sulfonyl group.

     KEYWORDS
     Durian rind; activated carbon; hydrothermal; iodine number

                                This work is licensed under a Creative Commons Attribution 4.0 International License, which
                                permits unrestricted use, distribution, and reproduction in any medium, provided the original
                                work is properly cited.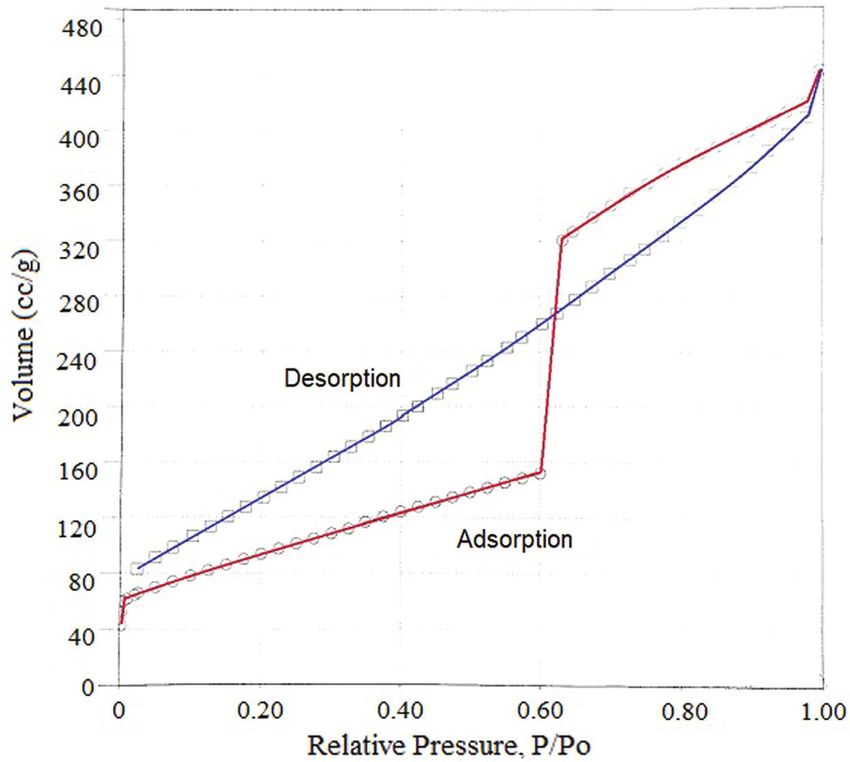
312                                                                                    JRM, 2021, vol.9, no.2

1 Introduction
     Durian rind is the waste from durian fruit consumption. In durian season, a lot of durian rind waste is
produced in Thailand every day. Direct disposal of durian peel will increase the amount of agricultural waste.
Therefore, it would be economically attractive if durian peel can be utilized as a raw material to produce an
effective activated carbon [1].
     Activated carbons are widely used for adsorbing gaseous- and liquid-phase pollutants. In the processing
units, they are used for several industrial sectors, such as chemical industries, food- and beverage-processing
industries, pharmaceuticals, petroleum, and many manufacturing industries [2–5]. Some of these
applications utilize these carbon adsorbents because of their characteristics and surface area.
    The high surface area, large porosity, well-developed internal pore structure, and a functional group
appear on the surface of AC make it a useful material which has a lot of applications in many areas, but
mostly in the environmental area [6,7].
     There are two main steps for preparing an activated carbon including carbonization of the raw materials
in an inert atmosphere and activation of char in the presence of the appropriate oxidizing agents. By pyrolytic
decomposition, most of the non-carbon elements, such as H2 and O2, are removed as the gaseous form in
carbonization, giving a carbon with the fixed mass and the structure of rudimentary pore. To increase the
diameter of particle pores and to create new pores, the activation step is then used for developing the
adsorptive power of the carbonization product [8].
     Activation can be conducted by either chemical or physical method. Commonly within the process of
chemical activation, carbonization and activation occur at the same time as accommodated by the chemical
activating agents, that is, dehydrating agents and oxidants. On the contrary, for physical activation, the
precursor carbonization takes place in priority, followed by the activation at high temperatures in the
presence of the suitable activating agents such as CO2 or steam. It has been found that the physical
activation process usually emerges at a temperature higher than the chemical activation process [9].
     The precursor-material impregnation using chemical agents such as FeCl3, ZnCl2, H3PO4, and KOH can
restrain the formation of tar and reduce the amount of the volatile-matter evolution also, achieving the high
precursor-to-carbon conversion [10–14]. So, the chemical activation process can adjust the evolution of a
porous structure. Zinc chloride (ZnCl2), among the chemical activating agents, is the chemical which is
the most often applied in the preparation of activated carbon; however, it causes the environmental
problems. Furthermore, activated carbons using zinc chloride are not proper in pharmaceutical and food
industries due to its feasibility to contaminate products. Another more likeable agent, KOH has been
claimed to be the most effective alkali salt for activated carbons production [9]. Nevertheless, acidic
activation of activated carbon has been associated with oxide structures, which are part of the
chemisorbed oxygen found on carbon surfaces, which have been exposed to air or other oxidizing media
[15]. In addition to apply of strong acid oxidizers such as phosphoric acid [16] and sulfuric acid [17],
other oxidization agents such as hydrogen peroxide, oxygen, and acetic acid are also used to increase the
acidic functional groups [12].
     This study aimed to determine the good durian rind activated carbon preparation method and the
physical and chemical activation processes of activated carbon derived from durian peel. The response
surface methodology (RSM) was used for optimization of durian rind activated carbon preparation
parameters including solid/water ratio, solid/acid ratio and temperature.
2 Materials and Methods
2.1 Materials
    Durian rinds were collected from local markets in Bangkok, Thailand, washed many times with distilled
water in order to remove the dust and other inorganic impurities. After that, it was cut into approximately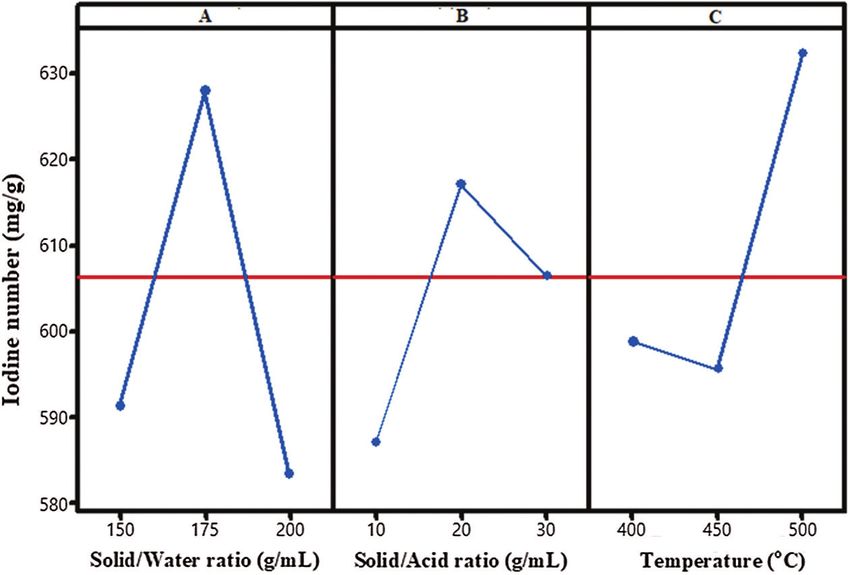
JRM, 2021, vol.9, no.2                                                                                    313

1 cm × 1 cm size and dried at 60–80°C for 24 hrs to reduce its moisture content. The dried durian rind was
grounded in the hammer mill and then stored in desiccators to prevent it from moisture. Potassium hydroxide
(KOH; ACS reagent) and sulfuric acid (H2SO4; ACS reagent) were purchased from UNILAB (Thailand) and
LAB SCAN (Thailand), respectively. The proximate analysis of durian rind which was conducted according
to ASTM standard E 870-82 was given in Tab. 1.

                              Table 1: Proximate analysis of the durian rind
                                  Proximate                     Results, %
                                  Moisture content              7.00
                                  Ash content                   3.00
                                  Volatile content              89.50
                                  Fixed carbon content          0.50

2.2 Activated Carbon Preparation
     Firstly, the durian rind biochar was prepared, which was put into the furnace, then was heat at 400°C for
1 hr. Secondly, the durian rind biochar was activated by the four different methods including activation by
acid (A1), activation by base (A2), hydrothermal and activation by acid (A3), and hydrothermal and
activation by base (A4).
    For the activation by acid and base, the charcoal was chemically activated by H2SO4 or KOH at the
several ratios, then washed with DI water until the pH value was 5.5–6.0. The washed charcoal was
carbonized in the furnace at the several temperatures for 1 hr.
    For hydrothermal and activation by acid and base, the charcoal was immersed in DI water with the
several ratios and then transferred to the thermal reactor, which was heated at 110°C for 24 hr. After that,
it was activated by H2SO4 or KOH at the several ratios, then washed with DI water until the pH value
was 5.5–6.0. The washed charcoal was carbonized in the furnace at the several temperatures for 1 hr.

2.3 Experimental Design
     In this study, the optimization of the preparation of durian rind activated carbon was applied by Box-
Behnken design (BBD) technique under response surface methodology (RSM), which is a collection of
mathematical and statistical techniques for designing experiments, building models, and evaluating the
effects of factors. This method allows evaluating not only the main factors affecting the preparation of
durian rind activated carbon, but also the interaction between these factors. The complete model is based
on the simultaneous variation of 3 factors at 3 levels with 30 experiments. The independent variables
reaction, i.e., solid/water ratio, solid/acid ratio, and temperature, were coded with the low level as –1 and
the high levels as +1 in BBD and the results with the experimental conditions were shown in Tab. 2. The
response measured was the lignin degradation%. The software MINITAB version 16.0 was used for the
experimental design, data analysis, quadratic model buildings, and graph plotting.

2.4 Characterization
     The surface area, pore volume and average pore diameter of the activated carbon were determined by
nitrogen adsorption-desorption measurements (Autosorb IQ, Quantachrome). The crystalline structure of
the durian rind and the activated carbon were characterized by X-ray diffraction (XRD 6100, Shimadzu)
using Cu Kα radiation ( ¼ 15406 nmÞ with an anode current of 30 mA and an accelerating voltage of
40 kV. The functional group of the durian rind and the activated carbon were analyzed by Fourier-
transform infrared spectroscopy (IRPrestige-21, Shimadzu). The morphological structure of the durian
314 JRM, 2021, vol.9, no.2
rind and the activated carbon were determined using scanning electron microscopy (Quanta 250,
ThermoFisher).
Table 2: Box-Benhken design of activated carbon preparation using hydrothermal and activation by acid
method
RunOrder Solid/water Solid/acid Temperature Iodine number Predicted value
ratio (g/mL) ratio (g/mL) (°C) (mg/g)
1 1:150 1:10 450 549.43 556.09
2 1:200 1:10 450 549.20 561.67
3 1:150 1:30 450 589.49 588.91
4 1:200 1:30 450 558.10 567.65
5 1:150 1:20 400 597.42 596.64
6 1:200 1:20 400 590.76 582.06
7 1:150 1:20 500 627.88 623.41
8 1:200 1:20 500 620.26 622.31
9 1:175 1:10 400 607.57 604.59
10 1:175 1:30 400 607.57 611.94
11 1:175 1:10 500 627.88 626.05
12 1:175 1:30 500 665.96 657.51
13 1:175 1:20 450 630.42 631.69
14 1:175 1:20 450 632.96 631.69
15 1:175 1:20 450 630.42 631.69
16 1:150 1:10 450 560.30 556.09
17 1:200 1:10 450 572.03 561.67
18 1:150 1:30 450 590.43 588.91
19 1:200 1:30 450 579.65 567.65
20 1:150 1:20 400 605.03 596.64
21 1:200 1:20 400 582.19 582.06
22 1:150 1:20 500 610.11 623.41
23 1:200 1:20 500 615.19 622.31
24 1:175 1:10 400 594.88 604.59
25 1:175 1:30 400 605.03 611.94
26 1:175 1:10 500 635.50 626.05
27 1:175 1:30 500 655.81 657.51
28 1:175 1:20 450 632.96 631.69
29 1:175 1:20 450 632.96 631.69
30 1:175 1:20 450 630.42 631.69JRM, 2021, vol.9, no.2 315
3 Results and Discussion
3.1 Activation Preparation Screening
The durian rind biochar was activated by the different methods which were divided into 4 methods
including activation by acid (A1), activation by base (A2), hydrothermal and activation by acid (A3), and
hydrothermal and activation by base (A4). The iodine number is targeted as to choose the activation
method for optimization as shown in Tab. 3. The results showed that the highest values obtained from
iodine number for A3 is 198.21 mg/g which reflects the iodine adsorption capacity of A3 in microporous.
Slightly lower value of 162.78 mg/g was obtained for A4. Thus, hydrothermal and activation by acid was
chosen to optimization.
Table 3: Iodine number of durian rind activated carbon with the different preparation methods
Raw material Activation method Iodine adsorption number (mg/g)
Durian rind Activation by acid 146.73
Activation by base 118.81
Hydrothermal and activation by base 162.78
Hydrothermal and activation by acid 198.21
3.2 Response Surface Methodology for the Preparation of Durian Rind Activated Carbon Optimization
The Box-Behnken design (BBD) with three factors at three levels, as well as the results of the
preparation of durian rind activated carbon were shown in Tab. 2. An approximate regression model of
the preparation of durian rind activated carbon based on the experimental results was evaluated and
expressed by the following polynomial equation:
Y ¼631:69 3:92X1 þ 9:70X2 þ 16:76X3 41:01X1 X1 22:10X2 X2 þ 15:43X3 X3
(1)
6:71X1 X2 þ 6:03X2 X3 ; R2 ¼ 95:04%; R2adj ¼ 92:80%
In Eq. (1), Y is the lignin degradation efficiency; X1, X2, and X3 are the corresponding coded variables of
solid/water ratio (g/mL), solid/acid ratio (g/mL), and temperature (°C), respectively.
One of the purposes of the experimental design was to allow a simple and reliable model efficient of
relating to directly response to the most significant variables. In Eq. (1), a factor was considered
significant if the p-value was lower than 0.05, meaning that the probability of noise causing the
correlation between a factor and the response is lower than 0.05. The insignificant factors were eliminated
using backward elimination, and the significant factors were kept modelling the data.
The accuracy of model fit was verified by the coefficient of determination R2, which was 0.9504,
indicating that 0.9504 of the variability in the response could be described by the model. The statistical
significance of this model equation was assessed by the F-test for ANOVA (Tab. 4). The F-value of
2.03 for the model indicated that the model was significant. There is only a 0.01% chance that the model
F-value could take place due to noise. The p-value is also very low (p < 0.05), indicating the significance
of the model. Values of “Prob > F” less than 0.05 showed that model terms were significant. The lack of
fit p-value of 0.148 is higher than 0.05, indicating that there is no lack of fit in the model at 95% level of
significance [18,19].
Adequacy check of the presented model is an important part of the analysis. Good adequacy can endorse
that the approximating model allows an adequate estimation to the real system; however, it may give poor or
misleading results [20–23]. The diagnostic plots were applied to approximate the adequacy of regression316 JRM, 2021, vol.9, no.2
model fitted as shown in Fig. 1. The actual and the predicted of the preparation of durian rind activated
carbon plots are shown in Fig. 1. The actual preparation of durian rind activated carbon is the assessed
value for a run, and the predicted value is assessed from the model. In experiment designs, R2 is a
measure of the amount of reduction in the variability of the response achieved by using the independent
variables in the model. A large value of R2 does not always indicate that the regression model is a good
one. On the other hand, R2adj was selected to determine the fit of a regression model as it does not
always increase when variables are added. A good agreement was achieved between the predicted
preparation of durian rind activated carbon and the experimental values with R2 and R2adj of 0.9504, and
0.9280, respectively, as shown in Fig. 1, which suggested that the proposed model had adequate
approximation to the actual value.
Table 4: ANOVA of the regression model for durian rind activated carbon preparation using hydrothermal
and activation by acid method
Source DF Adj SS Adj MS F-value p-value
Model 9 25043.2 2782.6 42.55 0.000
Linear 3 6245.7 2081.9 31.83 0.000
Water ratio 1 245.8 245.8 3.76 0.067
Acid ratio 1 1506.4 1506.4 23.03 0.000
Temperatute 1 4493.5 4493.5 68.71 0.000
Square 3 18055.8 6018.6 92.03 0.000
Water ratio × water ratio 1 12422.5 12422.5 189.96 0.000
Acid ratio × acid ratio 1 3605.1 3605.1 55.13 0.000
Temperatute × temperatute 1 1758.4 1758.4 26.89 0.000
2-Way Interaction 3 741.8 247.3 3.78 0.027
Water ratio × acid ratio 1 360.1 360.1 5.51 0.029
Water ratio × temperatute 1 90.9 90.9 1.39 0.252
Acid ratio × temperatute 1 290.8 290.8 4.45 0.048
Error 20 1307.9 65.4
Lack-of-Fit 3 345.1 115.0 2.03 0.148
Pure Error 17 962.8 56.6
Total 29 26351.2
As shown in Fig. 2, the residual plots were applied to assess that the model satisfied the hypothesis made
for ANOVA, which in the response model was examined against four analyses. The normal probability plot
(Fig. 2a) demonstrates that the experiments data was distributed on the strength line, implying that the
normality hypothesis was satisfied. In Fig. 2b, the residual versus the fit plot scattered randomly. It can be
seen that the data appeared to show the relatively constant variance across the predicted values. The
histogram chart was exhibited in Fig. 2c suggest that the histogram has structure as the bell overturn. It is
suggested that there was no apparent problem of the data with the normal curve. Fig. 2d shows the
residual versus order plot suggesting the random scatters fluctuated around the center line (in the range of
± 2). These results indicate that the experiment data was distributed very well. It can be considered that
the data has the good accuracy and reliability [23–27].JRM, 2021, vol.9, no.2 317
675
650
Experimental Value
625
600
575
550
550 575 600 625 650
Predicted Value
Figure 1: The experimental values (%) plotted against the predicted values (%) derived from model of
durian rind activated carbon preparation using hydrothermal and activation by acid method
Normal Probability Plot Versus Fits
99
10
90
5
Residual
Percent
50 0
-5
10
-10
1
-20 -10 0 10 20 550 575 600 625 650
Residual Fitted Value
Histogram Versus Order
10
8
5
Frequency
Residual
6
0
4
-5
2
-10
0
-12 -6 0 6 12 2 4 6 8 10 12 14 16 18 20 22 24 26 28 30
Residual Observation Order
Figure 2: Internal standardized residual plots versus (a) normal probability, (b) fits, (c) histogram, and (d)
observation order for iodine number of durian rind activated carbon preparation using hydrothermal and
activation by acid method
3.3 Factors Affecting the of the Preparation of Durian Rind Activated Carbon
As shown in Fig. 3a, the effects of solid/water ratio for hydrothermal durian rind biochar at 1:150, 1:175,
and 1:200 g/mL on iodine number showed that solid/water ratio effect was insignificant. The efficiency of318 JRM, 2021, vol.9, no.2
iodine number increased from 590 to 629 mg/g when the solid/water ratio increased from 1:150 g/mL to
1:175 g/mL, respectively. The iodine number could be enhanced by increasing the solid/water ratio. The
carbonized biomass appeared to have been carbonized into the spherical particles. Cui et al. also showed
that the hydrothermal treatment did not destroy the underlying morphologies. However, Roman et al.
showed that the underlying morphologies of biomass largely remained unaffected by a hydrothermal
treatment [16].
Figure 3: Plot of main effects (a) Solid/Water ratio (b) Solid/Acid ratio and (c) Temperature for iodine
number of durian rind activated carbon preparation using hydrothermal and activation by acid method
As shown in Fig. 3b, the solid/acid ratio is another important operating parameter affecting the iodine
number in the activated durian rind biochar. The solid/acid ratio was exhibited significant as the main effect
in ANOVA analysis, it influenced other parameters. The solid/acid ratio directly affected the surface area and
the oxygen content on durian rind activated carbon, which related to the porosity development due to the
formation of sulfate linkages such as sulfate and poly-sulfate esters which can help to connect and
crosslink the biopolymers. These linkages expand the structure of the durian rind and sulfate compounds
retained in the expanded structure and hinder the shrinkage at high-temperature treatment [15]. The solid/
acid ratio on iodine number was measured at the different initial solid/acid ratios (1:10, 1:20, and 1:30 g/
mL), which demonstrations the mentioned effect on the iodine number (Fig. 3b). When solid/acid ratio
was increased from 1:10 to 1:20 g/mL, the iodine number increased from 590 to 620 g/mL. Thus, the
oxygen content can be showed in the carbonyl and sulfonyl form. In a study, the highest iodine number
was obtained at the solid/acid ratio of 1:20 by hydrothermal and activation by acid method.
The effects of temperature on iodine number of activated carbon preparation are shown in Fig. 3(c).
When the temperature was increased from 450 to 500°C, the iodine number was increased between
595 to 630 g/mg. These results related to the increase of heating duration which proved to enhance the
development of micropores and the total volume because longer duration has the possibility for
generation of sample average pore diameter micropore surface area micropore volume. With the
increasing activation temperatures, the total volume of new micropores and mesopores in the carbon was
more obtained. When the activation temperature was increased to 500°C, a larger total volume and the
micropore volume is observed as compared to activated carbons prepared from 400°C [28].JRM, 2021, vol.9, no.2 319
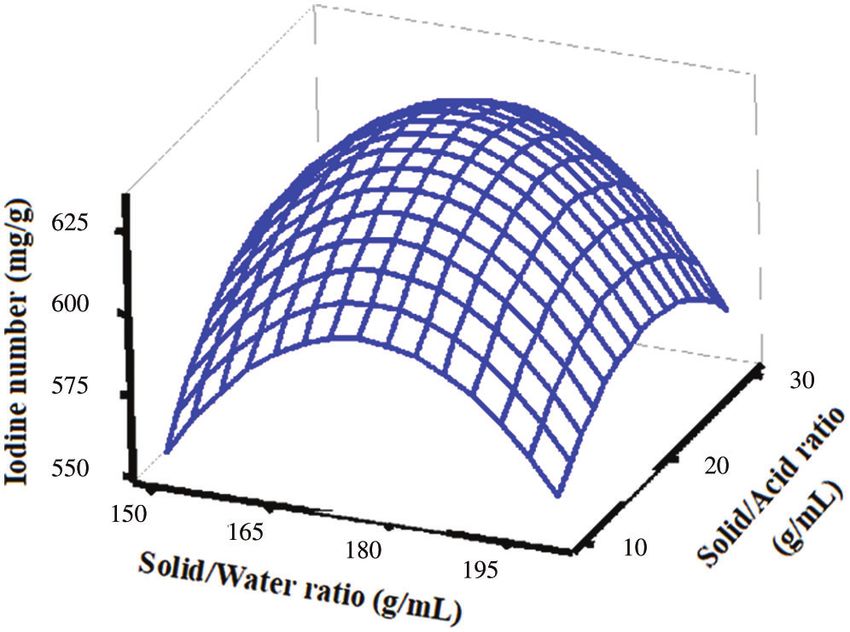
Fig. 4 presents the response surface modeling in a three-dimensional (3D) representation reflecting the
interactive effects of the solid/water ratio and the solid/acid ratio on the iodine number of activated carbons.
As can be seen, water possesses a high ionization constant at high temperatures and is responsible for
hydrolysis of organics which can further be catalyzed by acids [29–32]. However, the activated carbons
synthesized under the same carbonization condition (either N2 atmospheric or vacuum pyrolysis), those
treated with HCl solution had greater BET surface areas and pore volumes than those treated with H2O.
An increase in these properties of activated carbons treated with HCl solution is likely to be due to the
removal of impurities on the surface and/or in the pores. Acid solution is generally used to purify
activated carbon after the synthesis [33].
Figure 4: Interaction effects of solid/water ratio and solid/acid ratio for iodine number of durian rind
activated carbon preparation using hydrothermal and activation by acid method
3.4 The Optimum Condition and Model Verification
The performance of activated carbon preparation using hydrothermal and activation by acid technique
can be evaluated in term of iodine number efficiency, which largely varies with the change and the
interactions in variables. Thus, the accommodations between the variables were created and optimized
depending on the response from the model for economic motivation. Accordingly, if the iodine number
was set at the assumed high iodine number (666.73 mg/g) as the target criteria, the optimum condition of
activated carbon preparation was 1:175 g/mL of solid/water ratio 1:23, g/mL of solid/acid ratio and 500°
C of temperature. At the optimum condition, the iodine number could be obtained as 666.73 ± 6 mg/g in
triplicate actual experiments. The optimum condition showed that the predicted values were closer to the
experimental values. Thus, the results confirmed the suitability of prediction model for the iodine number
of activated carbons.
3.5 Characterization of Durian Rind Activated Carbon
The A1, A2, A3, and A4 were prepared by the different techniques from Section 3.1. The iodine
adsorption method was investigated for studying the microporous in activated carbon [34]. The iodine
adsorption capacity of different activated carbons was shown in Tab. 3. The highest values obtained from
iodine number for A3 is 198.21 mg/g which reflects the iodine adsorption capacity of A3 in microporous.
Slightly lower value of 162.78 mg/g was obtained for A4 since the presence of sulfuric acid promotes the
hydrolysis and decomposition of oligomer and monomer to smaller fragments [35].320 JRM, 2021, vol.9, no.2
The BET surface area of the activated carbon (A4) was 331.02 m2/g while the commercial activated
carbon (CarboTech) was 900 m2/g [36]. The total pore volumes and pore diameter of the activated carbon
(A4) were 0.685 cm3/g and 0.008 µm respectively. The adsorption isotherm of the activated carbon was
shown in Fig. 5.
Figure 5: The adsorption isotherm of the activated carbon
The crystallinity of durian rind raw material and activated carbon were studied by XRD. As shown in the
Figs. 6a and 6b, both samples are the same pattern. The XRD pattern showed two broad peaks at approximate
24° and 42° attributed to turbostratic carbon or disorder carbon (amorphous carbon) [37].
The most characteristic vibrations were selected by the FTIR spectra of durian rind and activated carbon.
As shown in Figs. 6c and 6d, the strong bands at 3300, 1600 and 1125 cm−1 were assigned to the stretching
vibration of the hydroxyl group, carbonyl group and sulfonyl group, respectively. However the FTIR spectra
of activated carbon located at 2270–2280 cm−1 which was corresponding to isocyanate group of vibration
(N=C=O) [38]. The isocyanate group may be occurred from calcination at high temperature in N2
atmosphere.
The morphology of durian rind and activated carbon was shown in Figs. 6e and 6f. After activation, the
activated carbon was more porous than durian rind. It can be seen from the SEM images that the external
surface of the activated carbon has the various sizes about 20–30 µm.JRM, 2021, vol.9, no.2 321
Figure 6: The characterization of durian rind and activated carbon (a) XRD pattern of durian rind, (b) XRD
pattern of activated carbon, (c) FTIR spectra of durian rind, (d) FTIR spectra of activated carbon, (e) SEM
images of durian rind and (f) SEM images of activated carbon
4 Conclusion
Durian rind is a good precursor to produce activated carbons with well-developed surface area and
functional group. The durian rind biochar was activated by the different methods which were divided into
4 methods including activation by acid, activation by base, hydrothermal and activation by acid, and322 JRM, 2021, vol.9, no.2
hydrothermal and activation by base. The hydrothermal and activation by acid was chosen to optimization
which is the highest values obtained from iodine number (198.21 mg/g). The response surface methodology
based on 3 variables Box-Behnken design was applied to determine the effects of solid/water ratio (ranging
1:150–1:120 mg/g), solid/acid ratio (ranging 1:10–1:30 mg/g) and temperature (ranging 400–600°C). For
each response, the coefficients of the hypothesized model were analyzed based on the experimental
responses. The analysis of the responses characterizing the surface area development shows, on one hand,
the positive effects of solid/acid ratio and temperature on the iodine number and a negative effect of
solid/water ratio on these responses. The R2 values of all factors showed a good fit of the models with
the experimental data. Based on the four models obtained, the numerical optimization was performed.
The optimum condition was confirmed and fitted the experimental data well. In this optimum condition,
the activated carbon shown that the functional group on activated carbon surface are oxygen content
including the hydroxyl group, carbonyl group and sulfonyl group, respectively.
Funding Statement: The authors gratefully acknowledgement funding of this research (KREF116101) by
King Mongkut’s Institute of Technology Ladkrabang Research Fund, Thailand.
Conflicts of Interest: The authors declare that they have no conflicts of interest to report regarding the
present study.
References
1. Srikhun, S., Hirunpraditkun, S., Nuithitikul, K. (2009). Adsorption of malachite green dye onto activated carbon
derived from durian peel. Proceedings of the 7th IASME/WSEAS International Conference on Heat Transfer,
Thermal Engineering and Environment, Moscow, Russia, 106–111. DOI 10.1007/s11270-014-2057-z.
2. Sariol, H. C., Peacok, T. M., Yperman, J., Sauvanell, A. B., Carleer, R. et al. (2016). Characterization of granular
activated carbons used in rum production by immersion ‘Bubblemetry’ in a pure liquid. Journal of Food
Processing & Beverages, 4(2), 10.
3. Nunes, A. A., Franca, A. S., Oliveira, L. S. (2009). Activated carbons from waste biomass: An alternative use for
biodiesel production solid residues. Bioresource Technology, 100(5), 1786–1792. DOI 10.1016/j.
biortech.2008.09.032.
4. Haw, K. G., Bakar, W. A. W. A., Ali, R., Chong, J. F., Kadir, A. A. A. (2010). Catalytic oxidative desulfurization of
diesel utilizing hydrogen peroxide and functionalized-activated carbon in a biphasic diesel–acetonitrile system.
Fuel Processing Technology, 91(9), 1105–1112. DOI 10.1016/j.fuproc.2010.03.021.
5. Roy, G. M. (1994). Activated carbon applications in the food and pharmaceutical industries. CRC Press. Technomic
Publishing Company, Inc. 851 New Holland Avenue, Box 3535 Lancaster, Pennsylvania 17604 U.S.A.
6. Figueiredo, J. L., Pereira, M. F. R., Freitas, M. M. A., Orfao, J. J. M. (1999). Modification of the surface chemistry
of activated carbons. Carbon, 37(9), 1379–1389. DOI 10.1016/S0008-6223(98)00333-9.
7. Stavropoulos, G. G., Samaras, P., Sakellaropoulos, G. P. (2008). Effect of activated carbons modification on
porosity, surface structure and phenol adsorption. Journal of Hazardous Materials, 151(2–3), 414–421. DOI
10.1016/j.jhazmat.2007.06.005.
8. Hu, Z., Srinivasan, M. P., Ni, Y. (2001). Novel activation process for preparing highly microporous and
mesoporous activated carbons. Carbon, 39(6), 877–886. DOI 10.1016/S0008-6223(00)00198-6.
9. Ahmadpour, A., Do, D. D. (1997). The preparation of activated carbon from macadamia nutshell by chemical
activation. Carbon, 35(12), 1723–1732. DOI 10.1016/S0008-6223(97)00127-9.
10. Girgis, B. S., El-Hendawy, A. N. A. (2002). Porosity development in activated carbons obtained from date pits
under chemical activation with phosphoric acid. Microporous and Mesoporous Materials, 52(2), 105–117. DOI
10.1016/S1387-1811(01)00481-4.
11. Tsai, W. T., Chang, C. Y., Lin, M. C., Chien, S. F., Sun, H. F. et al. (2001). Adsorption of acid dye onto activated
carbons prepared from agricultural waste bagasse by ZnCl2 activation. Chemosphere, 45(1), 51–58. DOI 10.1016/
S0045-6535(01)00016-9.JRM, 2021, vol.9, no.2 323
12. Toles, C. A., Marshall, W. E., Johns, M. M. (1999). Surface functional groups on acid-activated nutshell carbons.
Carbon, 37(8), 1207–1214. DOI 10.1016/S0008-6223(98)00315-7.
13. Njoku, V. O., Foo, K. Y., Asif, M., Hameed, B. H. (2014). Preparation of activated carbons from rambutan
(Nephelium lappaceum) peel by microwave-induced KOH activation for acid yellow 17 dye adsorption.
Chemical Engineering Journal, 250, 198–204. DOI 10.1016/j.cej.2014.03.115.
14. Rashid, R. A., Jawad, A. H., Ishak, M. A. B. M., Kasim, N. N. (2018). FeCl3-activated carbon developed from
coconut leaves: Characterization and application for methylene blue removal. Sains Malaysiana, 47(3), 603–
610. DOI 10.17576/jsm-2018-4703-22.
15. Ismail, A., Sudrajat, H., Jumbianti, D. (2010). Activated carbon from durian seed by H3PO4 activation: Preparation
and pore structure characterization. Indonesian Journal of Chemistry, 10(1), 36–40. DOI 10.22146/ijc.21495.
16. Hao, W., Björkman, E., Lilliestrale, M., Hedin, N. (2014). Activated carbons for water treatment prepared by
phosphoric acid activation of hydrothermally treated beer waste. Industrial & Engineering Chemistry Research,
53(40), 15389–15397. DOI 10.1021/ie5004569.
17. Karagöz, S., Tay, T., Ucar, S., Erdem, M. (2008). Activated carbons from waste biomass by sulfuric acid activation
and their use on methylene blue adsorption. Bioresource Technology, 99(14), 6214–6222. DOI 10.1016/j.
biortech.2007.12.019.
18. Sriprom, P., Neramittagapong, S., Lin, C., Wantala, K., Neramittagapong, A. et al. (2015). Optimizing chemical
oxygen demand removal from synthesized wastewater containing lignin by catalytic wet-air oxidation over
CuO/Al2O3 catalysts. Journal of the Air & Waste Management Association, 65(7), 828–836. DOI 10.1080/
10962247.2015.1023908.
19. Sriprom, P., Lin, C., Neramittagapong, A., Neramittagapong, S. (2016). Investigation of important parameters for
lignin degradation using fenton-like reaction via Cu doped on bagasses-MCM-41. In: Parinov, I., Chang, S. H.,
Topolov, V. (eds.), Springer Proceedings in Physics: Vol 175. Advanced Materials. Springer, Azov, Russia,
115–127. DOI 10.1007/978-3-319-26324-3_9.
20. Khataee, A. R., Dehghan, G. (2011). Optimization of biological treatment of a dye solution by macroalgae
Cladophora sp. using response surface methodology. Journal of the Taiwan Institute of Chemical Engineers, 42
(1), 26–33. DOI 10.1016/j.jtice.2010.03.007.
21. Papadopoulou, K., Kalagona, I. M., Philippoussis, A., Rigas, F. (2013). Optimization of fungal decolorization of
azo and anthraquinone dyes via Box-Behnken design. International Biodeterioration & Biodegradation, 77, 31–
38. DOI 10.1016/j.ibiod.2012.10.008.
22. Salman, J. M. (2014). Optimization of preparation conditions for activated carbon from palm oil fronds using
response surface methodology on removal of pesticides from aqueous solution. Arabian Journal of Chemistry,
7(1), 101–108. DOI 10.1016/j.arabjc.2013.05.033.
23. Sriprom, P., Champa, V., Kitchaiya, P., Assawasaengrat, P. (2018). Optimizing decolorization efficiency of
methylene blue by photo-fenton process over fe-diatomite using central composite design. In: Friedl, A.,
Klemeš, J. J., Radl, S., Varbanov, P. S., Wallek, T. (eds.), Computer Aided Chemical Engineering. Elsevier,
Graz, Austria, vol. 43, 409–414. DOI 10.1016/B978-0-444-64235-6.50074-7.
24. Sivalingam, S., Sen, S. (2018). Optimization of synthesis parameters and characterization of coal fly ash derived
microporous zeolite X. Applied Surface Science, 455, 903–910. DOI 10.1016/j.apsusc.2018.05.222.
25. Ismail, M. N., Aziz, H. A., Ahmad, M. A., Yusoff, N. A. (2015). Optimization of areca catechu fronds as adsorbent
for decolorization and cod removal of wastewater through the adsorption process. Sains Malaysiana, 44(11),
1609–1614.
26. Uma, D. B., Ho, C. W., Wan Aida, W. M. (2010). Optimization of extraction parameters of total phenolic
compounds from henna (Lawsonia Inermis) leaves. Sains Malaysiana, 39(1), 119–128.
27. Yap, C. F., Ho, C. W., Wan Aida, W. M., Chan, S. W., Lee, C. Y. et al. (2009). Optimization of extraction conditions
of total phenolic compounds from star fruit (Averrhoa Carambola L.) residues. Sains Malaysiana, 38(4), 511–520.
28. Jun, T. Y., Arumugam, S. D., Latip, N. H. A., Abdullah, A. M., Latif, P. A. (2010). Effect of activation temperature
and heating duration on physical characteristics of activated carbon prepared from agriculture waste. Environment
Asia, 3, 143–148.324 JRM, 2021, vol.9, no.2
29. Titirici, M. M., White, R. J., Falco, C., Sevilla, M. (2012). Black perspectives for a green future: Hydrothermal
carbons for environment protection and energy storage. Energy & Environmental Science, 5(5), 6796–6822.
DOI 10.1039/c2ee21166a.
30. Libra, J. A., Ro, K. S., Kammann, C., Funke, A., Berge, N. D. et al. (2011). Hydrothermal carbonization of
biomass residuals: A comparative review of the chemistry, processes and applications of wet and dry pyrolysis.
Biofuels, 2(1), 71–106. DOI 10.4155/bfs.10.81.
31. Bobleter, O. (1994). Hydrothermal degradation of polymers derived from plants. Progress in Polymer Science, 19
(5), 797–841. DOI 10.1016/0079-6700(94)90033-7.
32. Titirici, M. M., Thomas, A., Yu, S. H., Müller, J. O., Antonietti, M. (2007). A direct synthesis of mesoporous
carbons with bicontinuous pore morphology from crude plant material by hydrothermal carbonization.
Chemistry of Materials, 19(17), 4205–4212. DOI 10.1021/cm0707408.
33. Nuithitikul, K., Srikhun, S., Hirunpraditkoon, S. (2010). Influences of pyrolysis condition and acid treatment on
properties of durian peel-based activated carbon. Bioresource Technology, 101(1), 426–429. DOI 10.1016/j.
biortech.2009.07.040.
34. Bestani, B., Benderdouche, N., Benstaali, B., Belhakem, M., Addou, A. (2008). Methylene blue and iodine
adsorption onto an activated desert plant. Bioresource Technology, 99(17), 8441–8444. DOI 10.1016/j.
biortech.2008.02.053.
35. Jain, A., Balasubramanian, R., Srinivasan, M. P. (2016). Hydrothermal conversion of biomass waste to activated
carbon with high porosity: A review. Chemical Engineering Journal, 283, 789–805. DOI 10.1016/j.
cej.2015.08.014.
36. Abdulsalam J., Mulopo J., Oboirien B., Bada S., Falcon R. (2019). Experimental evaluation of activated carbon
derived from South Africa discard coal for natural gas storage. International Journal of Coal Science &
Technology, 6(3), 459–477. DOI 10.1007/s40789-019-0262-5.
37. Tsubouchi, N., Xu, C., Ohtsuka, Y. (2003). Carbon crystallization during high-temperature pyrolysis of coals and
the enhancement by calcium. Energy & Fuels, 17(5), 1119–1125. DOI 10.1021/ef020265u.
38. Zhang, J., Hori, N., Takemura, A. (2020). Influence of NCO/OH ratio on preparation of four agricultural wastes
liquefied polyols based polyurethane foams. Polymer Degradation and Stability, 179, 109256. DOI 10.1016/j.
polymdegradstab.2020.109256.You can also read