PHOTOCATALYSIS OF DICARBOXYLIC ACIDS OVER TIO2: AN IN SITU ATR-IR STUDY
←
→
Page content transcription
If your browser does not render page correctly, please read the page content below
Journal of Catalysis 248 (2007) 268–276
                                                                                                                                 www.elsevier.com/locate/jcat

                               Photocatalysis of dicarboxylic acids over TiO2:
                                          An in situ ATR-IR study
                                                        Igor Dolamic, Thomas Bürgi ∗
                             Institut de Microtechnique, Université de Neuchâtel, Rue Emile-Argand 11, 2009 Neuchâtel, Switzerland
                                            Received 9 January 2007; revised 5 March 2007; accepted 22 March 2007
                                                                  Available online 27 April 2007

Abstract
   Attenuated total reflection infrared (ATR-IR) spectroscopy in a flow-through cell was used to study the photocatalytic mineralization of malonic
acid and succinic acid over P25 TiO2 in situ. The experiments were performed in water at concentrations of 1.5 × 10⁻⁴ mol/L and pH 3.5 at
room temperature. Changes on the catalyst surface were observed within a few minutes. The first step in the mineralization of malonic acid is
a photo-Kolbe reaction of adsorbed malonate. Part of the resulting C2 species is converted into oxalate and finally into carbon dioxide, and part
desorbs from the surface. The branching ratio for the two pathways is 50:50. The mineralization reaction was also observed in the absence of
dissolved oxygen, but at a slower rate. In the presence of dissolved 18 O2 , labeled oxygen was incorporated into the adsorbed oxalate. A dominant
pathway in the mineralization of succinic acid involves the transformation to oxalate via malonate. Thus, it is proposed that a favored pathway
for dicarboxylic acid mineralization is a photo-Kolbe reaction, followed by oxidation of the carbon-centered radical to a carboxylate, which
corresponds to the overall formal shortening of the alkyl chain by one CH2 unit.
© 2007 Elsevier Inc. All rights reserved.

Keywords: In situ spectroscopy; Photocatalysis; Attenuated total reflection; TiO2 , Malonic acid

1. Introduction                                                                      tocatalyst and the evolution of dissolved intermediate species
                                                                                     on the way to complete mineralization [3–5]. The nature of the
    The ecologically and economically driven demand for sus-                         catalytic interface during illumination has been explored much
tainable technologies has fostered interest in methods for abate-                    less extensively. Analyzing the processes occurring at the cat-
ment of pollutants in wastewater. Photocatalysis over TiO2 has                       alytic interface is perhaps the most direct way to unravel the
great advantages in this important field [1–3]. TiO2 is nontoxic                     mechanism of heterogeneous catalytic reactions. Attenuated to-
and inert, and sunlight can be used to excite the semiconduc-                        tal reflection infrared (ATR-IR) spectroscopy [6] is an ideal
tor across its band gap. This process generates an electron–hole                     tool for investigating solid–liquid interfaces of powders [7,8];
pair. Oxidation is assumed to proceed via direct attack of ad-                       it recently has been applied to study heterogeneous catalytic
sorbed species on the catalytic surface by photogenerated holes                      reactions occurring at solid–liquid interfaces [9–16]. Although
or to be indirectly mediated by radicals, such as ·OH, generated                     applications of ATR-IR to photocatalysis are still limited [17–
from adsorbed water, oxygen, and hydroxyl groups on the cata-                        25], the technique’s potential has been demonstrated.
lyst surface. In this way, hazardous organic compounds can be                            Modulation excitation spectroscopy [26] was recently com-
completely mineralized, that is, converted into water and car-                       bined with ATR-IR to study heterogeneous catalytic reactions.
bon dioxide.                                                                         The catalytic system is perturbed by periodically modulating an
    Much data are available on the disappearance of organic                          external parameter [10]. A subsequent phase-sensitive detection
molecules from the liquid phase during illumination of the pho-                      selectively highlights the species affected by the modulated pa-
                                                                                     rameter and also leads to a significant increase in sensitivity.
 * Corresponding author. Fax: +41 32 718 25 11.                                      Up to now, concentration modulation experiments in a flow-
   E-mail address: thomas.burgi@unine.ch (T. Bürgi).                                 through cell (i.e., periodically varying the concentration of one
0021-9517/$ – see front matter © 2007 Elsevier Inc. All rights reserved.
doi:10.1016/j.jcat.2007.03.020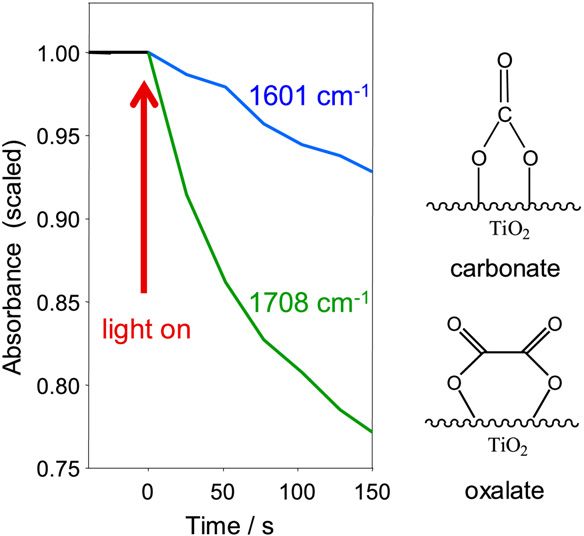
I. Dolamic, T. Bürgi / Journal of Catalysis 248 (2007) 268–276                                              269

reactant at the inlet of the flow-through ATR-IR reactor) were
used to disturb the catalytic system [10,27,28].
    Here we also use light modulation to turn the photocatalytic
reactions on and off, and we apply this strategy to study the
photocatalytic mineralization of malonic acid and succinic acid
over TiO2 (P25). We have recently shown that oxalic acid is an
important reaction intermediate on the TiO2 surface in the min-
eralization of malonic acid [24]. The modulation technique also
enables detection of the final reaction product, dissolved CO2 ,
near the interface. Selective 13 C labeling of malonic acid and
18 O labeling of dissolved oxygen gas gives additional informa-

tion about the fate of malonic acid during mineralization. The
phase-sensitive detection also provides evidence of the presence
of carbonates on the TiO2 surface during photocatalysis.

2. Experimental
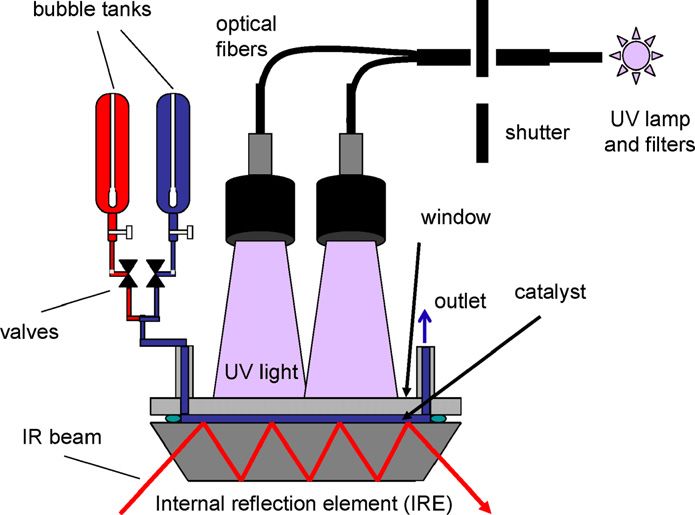
                                                                           Fig. 1. Schematic setup for in situ ATR-IR spectroscopy of photocatalytic reac-
2.1. Catalyst and chemicals                                                tions in a small volume flow-through cell.

    Degussa P25 TiO2 , containing 80% anatase and 20% rutile               of about 0.5 mL. The cell was mounted on an attachment for
with a surface area of 51 m2 /g and average primary particle size          ATR measurements (Wilks Scientific) within the sample com-
of 21 nm, was used in the photocatalysis experiments. Malonic              partment of a Bruker Equinox-55 FTIR spectrometer equipped
acid (Sigma-Aldrich, 99%), malonic-2-13 C acid (Aldrich, 99%               with a narrow-band MTC detector. Spectra were recorded at
13 C), and succinic acid (Sigma-Aldrich, 99%) were used as re-             room temperature with a resolution of 4 cm−1 .
ceived. Nitrogen (N2 , 99.995%), oxygen (O2 , 99.995%), and                   The solvent was saturated with gases in the two separate
carbon dioxide (CO2 , 99.995%), all from CarbaGas, were ap-                glass bubble tanks, then passed through the cell and over the
plied to saturate the liquids. Labeled oxygen 18 O2 was received           sample by means of a peristaltic pump (Ismatec, Reglo 100) lo-
from Isotec (99%).                                                         cated after the cell. A flow rate of 0.2 mL/min was used. Unless
                                                                           stated otherwise, the solvent was saturated with air.
2.2. Thin-film preparation                                                    For irradiation of the sample, UV light was provided by
                                                                           a 75 W Xenon arc lamp. The UV light from the source was
    A slurry of the catalyst powder was prepared from about                guided to the ATR-IR cell via two fiber bundles. The light was
20 mg of catalyst and 25 mL of water (Milli-Q, 18 M cm). Af-              passed through a 5-cm water filter to remove any infrared ra-
ter sonication (Branson 200 ultrasonic cleaner) for 30 min, TiO2           diation. A Schott UG 11 (50 × 50 × 1 mm) broadband filter
thin films were formed by dropping the slurry onto a Ge inter-             from ITOS was used to remove visible light (transmission at
nal reflection element (IRE) (52 × 20 × 1 mm; KOMLAS).                     270–380 nm). An estimate based on the supplier specifications
In contrast to ZnSe, Ge was found to be inert under the ap-                gave a power at the sample of slightly below 10 mW/cm2 . The
plied experimental conditions. The amount of the slurry used               experimental setup is shown schematically in Fig. 1.
for one coating was 0.5 mL. The solvent was allowed to evap-
orate, and the procedure was repeated twice. After drying for              2.4. Modulation experiments and data acquisition
several minutes at 40 °C in air, loose catalyst particles were re-
moved by flowing water over the IRE. After air-drying, the film                The periodic variation of an external parameter has a spe-
was ready for use. From the amount of deposited TiO2 and its               cific influence on the catalytic system. The concentration of all
density, an average film thickness of 4 µm was estimated. Fresh            of the species in the system affected by this external parame-
films were prepared every day, and results were reproducible               ter will also change periodically at the same frequency as the
on different catalyst films. It should also be noted that no ad-           stimulation. The following parameters were used for the mod-
sorption and no reaction was observed in the absence of TiO2               ulation: the UV light flux, the reactant concentration (malonic
film.                                                                      acid) and the nature of the dissolved gas, oxygen–nitrogen. Dur-
                                                                           ing one modulation period (typically 150–235 s), 60 IR spectra
2.3. In situ spectroscopy                                                  were recorded at a sampling rate of 40 or 80 kHz (4–8 scans/s)
                                                                           using the rapid scan function of the FTIR spectrometer. Typi-
   ATR spectra were recorded with a dedicated flow-through                 cally 20 scans per spectrum recorded in a single period were
cell composed of a Teflon piece and a fused silica plate (45 × 35          averaged. Two modulation periods were performed before data
× 3 mm). The cell inlet was connected to two bubble tanks, al-             acquisition was started. The IR spectra were than averaged over
lowing rapid exchange between two different fluids. The inlet–             five modulation periods.
outlet distance was 36 mm. A flat (1 mm) viton seal defined                    Modulation experiments were performed as follows. UV
the thickness of the fluid compartment, which had a volume                 light modulation was achieved using an electronic shutter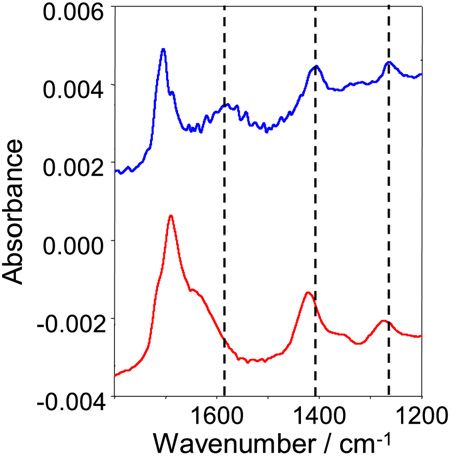
270                                          I. Dolamic, T. Bürgi / Journal of Catalysis 248 (2007) 268–276

(Newport model 71445). The light flux was modulated (on–                       here; more detailed information on the technique is available
off) in the presence of dissolved carboxylic acid or neat water                elsewhere [10,29].
over the TiO2 catalyst.
    For the gas modulation experiments, carboxylic acid solu-                  3. Results and discussion
tions were saturated by nitrogen and oxygen in two separate
glass bubble tanks. A nitrogen- or oxygen-saturated solution of                3.1. Major adsorbed species during illumination of adsorbed
the acid was than passed over the TiO2 catalyst for 15 min.                    malonate
The modulation experiments were performed by switching two
pneumatically actuated valves (Fig. 1).                                           Fig. 2 shows ATR-IR spectra of (a) normal and (b) 13 C-
    The concentration modulation experiments used two glass                    labeled malonic acid adsorbed on the TiO2 from aqueous air-
tanks, one containing neat water (pH 5.5) and the other con-                   saturated solution in the dark. Note that only the central car-
taining 1.5 × 10⁻⁴ mol/L carboxylic acid (pH 3.5). At this                     bon atom (C-2; Scheme 1) was 13 C-labeled. The most intense
concentration, the dissolved acid was not observed in the ATR-                 bands are assigned to carboxylate vibrations νas (COO) at 1625
IR spectra. Before the modulation experiments, the carboxylic                  and 1575 cm−1 and νs (COO) at 1436 and 1353 cm−1 [24].
acid solution was flowed over the sample for 30 min in the dark.               As is evident from Fig. 2, 13 C labeling of the central carbon
At this point, the signals no longer changed, indicating equi-                 atom of malonic acid has no influence on these bands, which
librium. At higher solution concentrations, the signals of the                 corroborates their assignment to the two terminal carboxylate
adsorbed species did not increase significantly, indicating satu-              groups. In contrast, the δ(CH2 ) band at 1259 cm−1 shifts down
ration of the surface.                                                         to 1250 cm−1 on 13 C labeling. The spectra provide evidence
    In all modulation experiments, data acquisition and modu-
lation were synchronized. Electrical signals generated by the
FTIR spectrometer within the data acquisition loop were used
to switch the valves (concentration or gas modulation) or the
shutter (light modulation). Note that the modulation experi-
ments performed here are square wave modulations. Under cer-
tain conditions (e.g., during light exposure and in the dark), the
demodulated spectra can be viewed as (high-quality) difference
spectra between two states of the system. However, if different
species in the system have different kinetics, then the spectra
change qualitatively with demodulation phase angle. Modula-
tion experiments are applicable only when the system response
is reversible, which was verified by performing two or more
identical modulation experiments one after the other.
    The time-resolved absorbance spectra A(ν̃, t) were trans-
formed into phase-resolved spectra using a digital phase sen-
sitive detection (PSD) according to
                  T
 φ PSD        2
Ak k (ν̃) =            A(ν̃, t) sin kωt + φkPSD dt,
              T
                  0
where k = 1, 2, 3, . . . determines the demodulation frequency
(e.g., fundamental, first harmonic), T is the modulation pe-
riod, ν̃ denotes the wavenumber, ω the stimulation frequency,
and φkPSD is the demodulation phase angle. With a set of time-                 Fig. 2. ATR-IR spectra of (a) malonic acid and (b) 13 C-labeled malonic acid
resolved spectra A(ν̃, t), the foregoing equation can be evalu-                adsorbed from aqueous solution (1.5 × 10⁻⁴ mol/L) on TiO2 in the dark
ated for different demodulation phase angles, φkPSD , resulting                and of the corresponding adsorbed reaction product ((c), unlabeled and (d)
                                                                               13 C-labeled) after illumination for 7 min and flowing neat water for 14 min.
                                              φ PSD
in a series of phase-resolved spectra, Ak k . Only spectra de-                 Malonic acid was allowed to adsorb for 30 min before recording the spectra.
modulated at the fundamental frequency (k = 1) are reported                    Note that only the central C atom of malonic acid was labeled.

                                                Scheme 1. Structure of oxalic, malonic and succinic acid.
I. Dolamic, T. Bürgi / Journal of Catalysis 248 (2007) 268–276 271
for two largely different carboxylate groups consistent with Scheme 2, is not labeled. Only in the further decomposition
one monodentate and one bidentate/chelating adsorption geom- of the resulting C2 compounds is one of the two CO2 mole-
etry [24]. cules 13 C-labeled. Complete mineralization of the selectively
Spectra (c) and (d) in Fig. 2 were obtained after illumi- 13 C-labeled malonic acid leads to three CO molecules, one
2
nating adsorbed malonate and 13 C-labeled malonate, respec- of which is labeled, and hence to a CO2 /13 CO2 ratio of 2.0.
tively, on TiO2 in the presence of dissolved (labeled) malonic The intensity of the observed signals in Fig. 3 is clearly differ-
acid and oxygen and subsequent washing with water. The lat- ent from 2.0; in fact, the ratio of the corresponding integrated
ter procedure, which removes adsorbed malonic acid within signals is 3.2. Keep in mind that the absorption coefficient
14 min, leaves behind oxalate species formed on illumination of the asymmetric stretching vibration is affected by the iso-
[24]. The two spectra are clearly different; in particular, sev- topic labeling. A density functional theory (DFT) calculation
eral bands associated with the COO vibrations shift to lower reveals that the molar absorption coefficient ε is 5% lower for
wavenumbers for oxalate formed from the 13 C-labeled mal-
onate. The two bands of partly labeled oxalate at 1689 and
1669 cm−1 are the antisymmetric and symmetric combination
of two C=O stretching vibrations, νs (C=O) and νas (C=O),
respectively. The bands at 1401 and 1272 cm−1 are associ-
ated with ν(C–O) + ν(C–C) modes [30], whereas the band at
1249 cm−1 can be assigned to δ(O–13 C=O). This clearly shows
that the central (labeled) carbon atom of the malonate ends up
in the oxalate, as expected. Strongly adsorbed carboxylic acids
are thought to undergo a photo-Kolbe reaction, initiated by a
photogenerated hole, leading to CO2 and a carbon-centered rad-
ical [31,32]. The latter ultimately leads to the oxalate. We have
previously shown that oxalate adsorbed on TiO2 is rapidly de-
composed on illumination, leading to CO2 [24].
3.2. Dissolved carbon dioxide
The enhanced sensitivity achieved by the phase-sensitive de-
tection made the observation of dissolved CO2 reaction product
possible. Fig. 3 shows a demodulated spectrum of a light modu-
lation experiment. In that experiment, a solution of 13 C-labeled
malonic acid was flowed through the ATR-IR cell. The two
bands at 2343 and 2277 cm−1 belong to dissolved CO2 and
13 CO in water. These band positions are in good agreement
2
with previous reports [33]. Note that due to the rotational enve-
lope, gas-phase CO2 has a distinctly different band shape from Fig. 3. Demodulated ATR-IR spectrum of a light modulation experiment where
that shown in Fig. 3. selectively 13 C-labeled malonic acid (1.5 × 10⁻⁴ mol/L) was flowed over the
The first CO2 molecule resulting from the photo-Kolbe TiO2 film. During one half of the modulation period (T = 155 s) the sample
reaction of selectively 13 C-labeled malonate, according to was illuminated and during the other half the sample was in the dark.
Scheme 2. Mechanism of photocatalytic mineralization of malonic acid over TiO2 .272 I. Dolamic, T. Bürgi / Journal of Catalysis 248 (2007) 268–276
labeled 13 CO2 . According to CCO2 /C13 CO2 = ACO2 /A13 CO2 ×
ε13 CO2 /εCO2 , where C stands for the concentration and A for
the integrated absorbance, a relative observed concentration of
3.2 × 0.95 = 3.04 is obtained. This demonstrates that part of the
C2 intermediate species formed during the initial photo-Kolbe
reaction are desorbing from the surface and are washed away in
the flow-through reactor before being further converted to CO2 .
The intermediates from the first photo-Kolbe reaction of
malonic acid derive from a carbon-centered radical (Scheme 2).
One of these intermediates, oxalate, is observed by ATR-IR. It
has been shown that oxalate hardly desorbs from the TiO2 (P25)
surface and that it mineralizes rapidly under the present con-
Fig. 4. Absorbance at 2343 cm−1 associated with CO2 as a function of time
ditions [24], resulting in one labeled and one unlabeled CO2 during a light modulation experiment (T = 155 s, concentration of malonic
according to Scheme 2. Other intermediate species deriving acid: 1.5 × 10⁻⁴ mol/L). The dashed line was used for the calculation of the
from the carbon-centered radical may be acetic acid (by ab- diffusion rate of CO2 out of the catalyst film (see text).
straction of a hydrogen) and glycolic acid (hydroxyacetic acid),
which are not observed on the TiO2 surface by ATR-IR. Acetic CO2 concentration decreases due to diffusion out of the evanes-
acid is known to adsorb only weakly [34] and thus desorbs from cent field. The penetration depth of the latter is estimated to be
the catalyst surface before being further mineralized. Glycolic 0.31 µm at 2343 cm−1 , as calculated from the refractive index
acid adsorbs more strongly on TiO2 than acetic acid. There is of Ge (4.0) and the estimated effective refractive index (1.82) of
no sign of it in the spectra [21], indicating that it is not formed. the TiO2 film in water. The latter is estimated from the refractive
From the observed relative concentration of labeled and un- indices of water (1.33) and TiO2 (2.2) by assuming a porosity
labeled CO2 , the branching ratio of C2 intermediates that are of 0.5 according to neff = (0.5(nH2 O )2 + 0.5(nTiO2 )2 )1/2 . Be-
converted into oxalic acid (and completely mineralized) and cause the penetration depth is considerably less than the film
acetic acid or other C2 species that are desorbing from the sur- thickness, the observed decrease of the CO2 signal in the dark
face can be determined. The limiting cases result in CO2 /13 CO2 is dominated by internal diffusion within the TiO2 film. During
ratios of 2.0 for complete mineralization (via oxalate) and in- illumination in the steady state, the diffusion of CO2 is com-
finity for no further mineralization of C2 intermediates. The pensated for by photocatalytic mineralization,
observed CO2 /13 CO2 ratio of 3.0 corresponds to a fraction of
dc dc dc
50% that is completely mineralized (mainly via oxalate, yield- =0=− + .
ing one labeled and two unlabeled CO2 molecules) and 50% dt dt diff dt reaction
that is desorbed and washed away as C2 species before be- In the dark, the term due to reaction vanishes, and the observed
ing mineralized (yielding one unlabeled CO2 molecule). In this decrease of the signal corresponds to the diffusion. A rough es-
context, it is illustrative to mention the residence time in the timate from Fig. 4 yields (dc/dt)diff = 3.4 × 10⁻⁶ mol/(L s),
flow-through reactor, which is about 2.5 min. which also corresponds to the estimated rate of production
The concentrations of dissolved CO2 observed while flow- of CO2 within the film during illumination. The reaction rate
ing a solution of 1.5 × 10⁻⁴ mol/L malonic acid over the with respect to malonic acid is about half this value (1.7 ×
TiO2 film and during illumination can be quantified. To do so, 10−6 mol/(L s)), taking into account the branching ratio dis-
the observed absorbance (5 × 10⁻⁵ at 2343 cm−1 ) was com- cussed above and thus prompting the observation that on av-
pared to that measured while a solution saturated with CO2 erage, each reacting malonic acid molecule leads to two CO2
was flowed over the TiO2 film (0.0136 at 2343 cm−1 ). At molecules under our conditions.
25 ◦ C, about 0.035 mol/L of CO2 can be dissolved in water
[35]. Only a small fraction of the dissolved CO2 (I. Dolamic, T. Bürgi / Journal of Catalysis 248 (2007) 268–276 273
Fig. 6. ATR-IR signals of carbonate (1601 cm−1 ) and oxalate (1708 cm−1 ) as
a function of time during illumination. The signals were obtained from two dif-
ferent experiments and the signal before starting illumination was scaled to one.
The surface covered by the carbonates was obtained by flowing a saturated so-
lution of CO2 over the sample followed by a flow of water. The surface covered
by the oxalate was obtained by flowing a malonic acid solution saturated with
oxygen over the sample during illumination followed by a flow of water in the
dark.
Fig. 5. Bottom: demodulated ATR-IR spectrum of a concentration modulation
experiment (T = 155 s, concentration of malonic acid: 1.5 × 10⁻⁴ mol/L).
The demodulation phase angle was chosen such that the signals of adsorbed species have different time (and phase) behavior than the other
malonate vanish. Bands marked with an asterisk are associated with oxalate. carbonates.
Top: ATR-IR spectrum of carbonate species on the TiO2 surface. The spectrum The carbonate species are stable in a flow of water at neu-
was measured after flowing a saturated aqueous CO2 solution over the sample tral pH in the dark; however, their concentration on the surface
followed by flowing water.
decreases on illumination in water. Desorption or decomposi-
tion may be initiated by capturing a photogenerated hole. Fig. 6
the digital phase-sensitive detection is that the demodulation shows the decrease of the signals at 1601 and 1708 cm−1 as-
phase angle can be chosen such that the dominant species is sociated with carbonate ions and oxalate species, respectively.
completely removed from the spectrum. In the present case, the The two signals measured before illumination were normalized
demodulation phase angle φkPSD was adjusted to 90◦ to remove to one absorbance unit. Note that the two curves were obtained
the strong signals of adsorbed malonate, uncovering weaker from two separate experiments in which the two species, car-
signals of other species with different time (and thus also phase) bonates and oxalate, were selectively prepared on the surface
behavior. For comparison, Fig. 5 (top) shows an ATR-IR spec- before illumination. Clearly, carbonate species disappear con-
siderably slower than oxalate.
trum obtained after flowing a saturated aqueous solution of CO2
The concentration of carbonate species on the TiO2 surface
over the TiO2 sample and after washing with water. This leads
is not large during illumination, and thus it is not observed in
to the formation of carbonate species on the TiO2 surface such
“normal” time-resolved experiments. The carbonate signals are
as monodentate and bidentate carbonates, bicarbonate and also
about 10 times smaller in the demodulated spectrum than in the
carboxylate [37]. Most importantly, the comparison in Fig. 5
upper spectrum shown in Fig. 5, with the latter corresponding
clearly shows the presence of carbonates on the catalyst surface to a surface saturated with carbonates. Thus, the coverage of
during the mineralization of malonic acid. The most promi- carbonates during illumination under our conditions is on the
nent bands observed at 1598 and 1317 cm−1 can be assigned order of 10% of a full coverage. Nonetheless, the carbonates
to bidentate carbonate and monodentate carbonate, respectively slow down the mineralization process due to competition for
[37]. The positive bands in the demodulated spectrum marked adsorption sites and for photogenerated holes. The comparison
with an asterisk belong to oxalate, which has a different time in Fig. 5 also shows that the relative intensity of the signals
behavior than that of malonate; therefore, the oxalate signals associated with monodentate and bidentate carbonate is differ-
do not vanish at the same demodulation phase angle as those of ent for the two experiments, indicating that the relative ratio of
malonate. The sharp band at 1053 cm−1 is assigned to a C–O monodentate and bidentate carbonates differs when formed by
stretching vibration of a carbonate species. The negative band adsorption of CO2 on a clean TiO2 surface and when formed
at 1680 cm−1 in the demodulated spectrum (partly overlapping during photocatalysis. This difference may be due to the block-
with the carbonate band at 1598 cm−1 ) may be assigned to bi- ing of specific sites by the malonate and oxalate species in the
carbonate species, which would mean that these bicarbonate latter case.274 I. Dolamic, T. Bürgi / Journal of Catalysis 248 (2007) 268–276
Fig. 8. ATR-IR spectrum obtained while flowing a solution of malonic acid
saturated with nitrogen over the TiO2 sample during illumination. The vertical
Fig. 7. ATR-IR spectra of oxalate on TiO2 . The spectra were obtained by line indicates the strongest oxalate band.
flowing a malonic acid solution saturated with oxygen over the sample during
illumination followed by a flow of water in the dark. For the bottom spectrum there was no clear sign in the spectra of 18 O-labeled CO2 (data
normal oxygen (O2 ) was used. For the top spectrum labeled oxygen (18 O2 ) was
used. Vertical lines are used to guide the eye.
not shown). We attribute this only in part to a low signal-to-
noise ratio. More importantly, oxygen exchange between CO2
and the TiO2 surface is possible [39]. Sato showed that oxy-
3.4. The role of oxygen
gen isotope exchange among water, CO2 , and surface hydroxyls
readily occurs on TiO2 even in the dark [40]. This means that
For the total mineralization of malonic acid according to
the labeled oxygen found in the oxalate (Fig. 7) can be ex-
hν changed with normal oxygen once adsorbed CO2 is formed,
C3 H4 O4 + 2O2 → 3CO2 + 2H2 O,
TiO2 and thus the dissolved CO2 is mostly unlabeled due to the large
oxygen must be provided. In this equation, this corresponds excess of normal oxygen in the system.
formally to two oxygen molecules, but the source of oxygen Fig. 8 shows an ATR-IR spectrum recorded while a solution
remains to be determined. Several possibilities are conceivable. of malonic acid saturated with nitrogen was flowed over the
The oxygen may come directly from dissolved O2 molecules. TiO2 sample during illumination. Fig. 8 reveals that oxalate also
In fact, previous reports on photocatalysis over TiO2 proposed can be formed from malonate on illumination in the absence of
reactive oxygen species deriving from O2 as important interme- oxygen. This finding shows that oxygen from a different source
diates responsible for the oxidation of organic pollutants [3,38]. than dissolved oxygen (i.e., from water or the TiO2 surface) also
In an aqueous environment, the incorporated oxygen also may can be incorporated into the oxalate.
originate from water. For example, the carbon-centered radi- Dissolved oxygen not only acts as one possible source of
cal may pick up OH from water. Finally, the TiO2 surface may oxygen atoms, but also has a pronounced influence on the reac-
serve as an oxygen source. In this case, the oxygen consumed tion rate. Fig. 9 shows the signal at 1700 cm−1 associated with
needs to be regenerated from either water or dissolved O2 . To the oxalate on the TiO2 surface as a function of time during
shed some light on the role of oxygen, labeled 18 O2 was used, one modulation period. In this experiment, the dissolved gas
and modulation experiments were performed in which the dis- was modulated between N2 and O2 . The coverage of oxalate
solved gas, O2 and N2 , served as the stimulation. is clearly modulated, showing an increase in oxygen and a de-
Fig. 7 shows ATR-IR spectra of oxalate. In these experi- crease in nitrogen. The rates of the various reaction steps can be
ments, the TiO2 sample was illuminated while solutions of mal- influenced by the dissolved oxygen mainly in two ways. Oxy-
onic acid saturated with oxygen were flowed through the cell. gen acts as an acceptor for the electron of the photogenerated
Then neat water was flowed over the sample to remove remain- electron–hole pair. The resulting reactive species can directly
ing malonic acid, leaving oxalate on the surface. The difference attack adsorbed molecules, as is suggested by the 18 O2 experi-
between the two spectra shown in Fig. 7 is the type of oxy- ments (Fig. 7). The acceptance of the electron furthermore leads
gen used in the corresponding experiment; for the top (bottom) to an increased lifetime of the photogenerated hole, and thus to
spectrum, labeled 18 O2 (unlabeled O2 ) was used. Clearly, in an increased reaction rate.
the upper spectrum, some bands are shifted to lower wavenum-
bers. The band of normal oxalate at 1421 cm−1 shifts down to 3.5. Mineralization of succinic acid
1400 cm−1 , and the broad band at 1633 cm−1 shifts down to
1590 cm−1 . These bands are associated with C–O vibrations Fig. 10 shows several ATR-IR spectra related to the mineral-
[25], and thus the shifts show that 18 O from dissolved oxygen ization of succinic acid over TiO2 . Trace (a) shows a spectrum
is incorporated into the adsorbed oxalate. Fig. 7 indicates that of succinic acid adsorbed on TiO2 in the dark. The two sub-
reactive species formed from oxygen (electron acceptor) can sequent spectra, (b) and (c), were recorded while succinic acid
react directly with the adsorbed C2 species, that is, the carbon- was flowed over the TiO2 film during illumination. Spectrum
centered radical or the species resulting from it. Interestingly, (d) represents the difference between two spectra recorded atI. Dolamic, T. Bürgi / Journal of Catalysis 248 (2007) 268–276 275
ing vibration, whereas the succinate spectrum is characterized
by only one band for the symmetric COO− stretching vibra-
tion and one for the antisymmeteric COO− stretching vibration.
This indicates that the two carboxylate groups in the succinate
are equivalent. Based on the energy difference Δ between the
two carboxylate stretching modes, an adsorption geometry can
be proposed [41]. Because Δ is smaller for the adsorbed succi-
nate than for the succinate in solution, chelating and/or bridging
coordination of both COO groups is indicated.
On illumination, a broad band centered at around 1600 cm−1
is growing in fast [Fig. 10, spectrum (b)] and later becomes
weaker again [Fig. 10, spectrum (c)]. Simultaneously, two sig-
nals are steadily growing in at 1708 and 1690 cm−1 , which
can be assigned to oxalate. Note that the oxalate bands reveal
Fig. 9. ATR-IR signal at 1700 cm−1 associated with oxalate as a function of a different kinetics from the band at 1600 cm−1 . The differ-
time during a modulation experiment (T = 232 s). In this experiment a solution ence spectrum in Fig. 10, spectrum (d) was recorded at the
of malonic acid (1.5 × 10⁻⁴ mol/L) was flowed over the TiO2 sample during very beginning of illumination. In this spectrum, the two most
illumination. The stimulation parameter was the dissolved gas, which was O2
prominent bands of succinate appear negative, due to the dis-
during the first half period and N2 during the second half period. The vertical
line indicates the time at which the dissolved gas was changed from O2 to N2 . appearance of succinate from the surface. Positive bands also
are observed associated with species appearing on the surface
on illumination. Comparison with the two spectra shown on top
in Fig. 10 reveals that these positive bands belong to malonate
and oxalate. From the kinetics of appearance and disappear-
ance of these bands, as discussed above, it can be concluded
that succinate is transformed to malonate and then to oxalate.
Thus, it seems that one dominant pathway for the photocat-
alytic mineralization of aliphatic dicarboxylic acids on TiO2 is
the consecutive shortening of the hydrocarbon chain by formal
CH2 elimination. Each of these formal steps is initiated by a
photo-Kolbe reaction, which results in the elimination of CO2 ,
and subsequent steps that lead from the carbon-centered radical
to a carboxylate.
4. Conclusion
ATR-IR spectroscopy in combination with modulation ex-
citation spectroscopy and isotope labeling was used to study
the mineralization of malonic acid over P25 TiO2 photocata-
lyst. The enhanced sensitivity achieved by the phase-sensitive
Fig. 10. ATR-IR spectra related to succinic acid mineralization. Spectrum (a) detection of periodically varying signals made the detection
was obtained while flowing succinic acid (1.5 × 10⁻⁴ mol/L) over the sample
in the dark (for 30 min). Spectra (b) and (c) were measured during illumina-
of dissolved CO2 possible. From the relative signals of CO2
tion, spectrum (b) 11 min and spectrum (c) 37 min after turning the light on. and 13 CO2 observed during the mineralization of selectively
Spectrum (d) represents the spectral differences observed during the first 83 s labeled malonic acid, it was determined that 50% of the ad-
of illumination. Spectra (e) and (f) are the spectra of adsorbed malonate and sorbed malonate was completely converted to CO2 (via ox-
oxalate for comparison. alate), whereas 50% of the C2 intermediates generated after
the first photo-Kolbe reaction were desorbed from the surface
the very beginning of illumination. Finally, the two top traces, and washed away without being oxidized. Modulation exper-
(e) and (f), represent the spectra of adsorbed malonate and ox- iments also revealed the presence of carbonates on the TiO2
alate on TiO2 for comparison. surface during illumination. Experiments in the presence of
The spectrum of succinic acid adsorbed in the dark from wa- labeled 18 O2 showed that the 18 O is incorporated into the ad-
ter is characterized by two strong bands at 1550 and 1417 cm−1 , sorbed oxalate. On the other hand, oxalate also was formed
which can be assigned to antisymmetric and symmetric COO− from malonate on illumination in the absence of dissolved oxy-
stretching vibrations, respectively. This shows that the mole- gen. This shows that at least two different pathways lead from
cule exists as succinate on the TiO2 surface. The spectrum is the carbon-centered radical to the oxalate after the first photo-
significantly different from that of malonate on TiO2 . The latter Kolbe reaction. These pathways are characterized by different
shows two distinct bands for the symmetric COO− stretching oxygen sources, dissolved oxygen and possibly oxygen from
vibration and two bands for the antisymmetric COO− stretch- water. Dissolved oxygen furthermore influences the rates of the276 I. Dolamic, T. Bürgi / Journal of Catalysis 248 (2007) 268–276
different reaction steps. It acts as an electron acceptor and accel- [18] R. Nakamura, Y. Nakato, J. Am. Chem. Soc. 126 (2004) 1290.
erates the photocatalytic reactions by preventing electron–hole [19] D.S. Warren, A.J. McQuillan, J. Phys. Chem. B 108 (2004) 19373.
recombination. [20] J.M. Kesselman-Truttmann, S.J. Hug, Environ. Sci. Technol. 33 (1999)
3171.
[21] G.N. Ekström, A.J. McQuillan, J. Phys. Chem. B 103 (1999) 10562.
Acknowledgment [22] P.Z. Araujo, C.B. Mendive, L.A.G. Rodenas, P.J. Morando, A.E. Regaz-
zoni, M.A. Blesa, D. Bahnemann, Colloids Surf. A Physicochem. Eng.
Funding was provided by the Swiss National Science Foun- Aspects 265 (2005) 73.
dation. [23] C.B. Mendive, D.W. Bahnemann, M.A. Blesa, Catal. Today 101 (2005)
237.
[24] I. Dolamic, T. Bürgi, J. Phys. Chem. B 110 (2006) 14898.
References [25] C.B. Mendive, T. Bredow, M.A. Blesa, D.W. Bahnemann, Phys. Chem.
Chem. Phys. 8 (2006) 3232.
[1] R. Wang, K. Hashimoto, M. Chikuni, E. Kojima, A. Kitamura, M. Shimo- [26] D. Baurecht, U.P. Fringeli, Rev. Sci. Instrum. 72 (2001) 3782.
higashi, T. Watanabe, Nature 388 (1997) 431. [27] A. Gisler, T. Bürgi, A. Baiker, J. Catal. 222 (2004) 461.
[2] R. Asahi, T. Morikawa, T. Ohwaki, K. Aoki, Y. Taga, Science 293 (2001) [28] T. Bürgi, M. Bieri, J. Phys. Chem. B 108 (2004) 13364.
269. [29] A. Urakawa, R. Wirz, T. Bürgi, A. Baiker, J. Phys. Chem. B 107 (2003)
[3] M.R. Hoffmann, S.T. Martin, W.Y. Choi, D.W. Bahnemann, Chem. 13061.
Rev. 95 (1995) 69. [30] S. Hug, D. Bahnemann, J. Electron Spectrosc. Relat. Phenom. 150 (2006)
[4] P. Calza, E. Pelizzetti, C. Minero, J. Appl. Electrochem. 35 (2005) 665. 208.
[5] O. Carp, C.L. Huisman, A. Reller, Prog. Solid State Chem. 32 (2004) 33. [31] T. Sakata, T. Kawai, K. Hashimoto, J. Phys. Chem. 88 (1984) 2344.
[6] N.J. Harrick, Internal Reflection Spectroscopy, Interscience Publishers, [32] B. Kraeutler, A.J. Bard, J. Am. Chem. Soc. 99 (1977) 7729.
New York, 1967. [33] M. Falk, A.G. Miller, Vib. Spectrosc. 4 (1992) 105.
[7] M.I. Tejedor-Tejedor, E.C. Yost, M.A. Anderson, Langmuir 6 (1990) 979. [34] F.P. Rotzinger, J.M. Kesselman-Truttmann, S. Hug, V. Shklover, M.
[8] S.J. Hug, B. Sulzberger, Langmuir 10 (1994) 3587. Grätzel, J. Phys. Chem. B 108 (2004) 5004.
[9] T. Bürgi, R. Wirz, A. Baiker, J. Phys. Chem. B 107 (2003) 6774. [35] Physical and Engineering Data, January 1978 ed., Shell Internationale Pe-
[10] T. Bürgi, A. Baiker, J. Phys. Chem. B 106 (2002) 10649. troleum Maatschappij BV, The Hague, 1978.
[11] S.D. Ebbesen, B.L. Mojet, L. Lefferts, Langmuir 22 (2006) 1079. [36] W. Gu, C.P. Tripp, Langmuir 22 (2006) 5748.
[12] G. Mul, G.M. Hamminga, J.A. Moulijn, Vib. Spectrosc. 34 (2004) 109. [37] A. Davidov, Molecular Spectroscopy of Oxide Catalyst Surfaces, Wiley,
[13] I. Ortiz-Hernandez, C. Williams, Langmuir 19 (2003) 2956. West Sussex, 2003.
[14] R. He, R.R. Davafa, J.A. Dumesic, J. Phys. Chem. B 109 (2005) 2810. [38] N. Serpone, Y. Nakaoka, J. Nishino, Y. Nosaka, in: D.F. Ollis, H. Al-Ekabi
[15] T. Bürgi, A. Baiker, Adv. Catal. 50 (2006) 228. (Eds.), Photocatalytic Purification and Treatment of Water and Air, Else-
[16] D. Ferri, C. Mondelli, F. Krumeich, A. Baiker, J. Phys. Chem. B 110 vier, Amsterdam, 1993.
(2006) 22982. [39] H. Hattori, Chem. Rev. 95 (1995) 537.
[17] R. Nakamura, A. Imanishi, K. Murakoshi, Y. Nakato, J. Am. Chem. [40] S. Sato, J. Chem. Phys. 91 (1987) 2895.
Soc. 125 (2003) 7443. [41] G.B. Deacon, R.J. Phillips, Coord. Chem. Rev. 33 (1980) 227.You can also read


