SIAN OURNAL OF HEMISTRY - Asian Journal of Chemistry; Vol. 32, No. 6 (2020), 1497-1504
←
→
Page content transcription
If your browser does not render page correctly, please read the page content below
Asian Journal of Chemistry; Vol. 32, No. 6 (2020), 1497-1504

                            ASIAN JOURNAL OF CHEMISTRY
                                              https://doi.org/10.14233/ajchem.2020.22625

               Synthesis of Silver Nanoparticles of Corn Silk Agrowaste and Their Bioactivities

                              S. FULORIA1, O.J. HONG1, C.B. KIM1, B.Y.S. TING1, S. KARUPIAH1, N. PALIWAL1,
                                   U. KUMARI2, K. SATHASIVAM3, S. VETRISELVAN4 and N.K. FULORIA1,*
1
  Pharmaceutical Chemistry Unit, Faculty of Pharmacy, AIMST University, Kedah 08100, Malaysia
2
  Department of Physiology, Faculty of Medicine, AIMST University, Kedah 08100, Malaysia
3
  Department of Biotechnology, Faculty of Applied Sciences, AIMST University, Kedah 08100, Malaysia
4
  Faculty of Medicine, MAHSA University, Bandar Saujana Putra, 42610, Selangor, Malaysia

*Corresponding author: Fax: +60 44 298007; Tel: +60 16 4037685; E-mail: nfuloria@gmail.com

    Received: 6 January 2020;               Accepted: 18 March 2020;                 Published online: 30 May 2020;                AJC-19903

    Present study was intended to synthesize silver nanoparticles (AgNPs) using corn silk aqueous extract (CSAE) and evaluate for antimicrobial
    and antiurolithiatic potential. The aqueous decoction of corn silk offered light yellow CSAE. Treatment of AgNO3 with CSAE offered
    AgNPs with absorbance 430 nm. Optimization study established 5 mM silver nitrate, 2.5:7.5 extract to AgNO3 ratio, pH 8, and 24 h time
    as parametric requirement for synthesis of AgNPs using CSAE. Stability study supported the AgNPs stability based on retention of SPR
    signal between 428 to 450 nm. The synthesis of AgNPs was confirmed on broad and shifted FTIR bands; XRD signals at 2θ values of
    32.27º, 40.72º, 46.20º, 65.69º, 69.31º and 76.49º indexed to 111, 200, 220 and 311 planes, respectively; particle size range from 22.05-
    36.69 nm in FESEM; and elemental silver content of 62.17% as per EDX spectrum. The synthesized AgNPs exhibited high antibacterial
    and antiurolithiatic potential. Present study recommends that synthesis of AgNPs using CSAE is a facile and eco-friendly method.

    Keywords: Silver nanoparticles, Corn silk, Urolithiasis, Antibacterial activity.

                         INTRODUCTION                                             The AgNPs suppress the drug resistance and augment the
                                                                            antimicrobial potential of chemical moieties against various
      The painful urolithiasis disorder involves formation of               pathogens like E. coli, S. aureus, K. pneumoniae and B. cereus
stones via polycrystalline concretions in the kidney, urinary               [4-9]. There are several ways to synthesize metallic nanopart-
bladder, or urethra. Renal calculi (kidney stones) mainly consist           icles, such as heat evaporation, chemical reduction, electro-
of calcium are formed when the urine is supersaturated with                 chemical reduction and microwave irradiation. But synthesis
salt and minerals such as calcium oxalate, uric acid, ammonium              of AgNPs by these methods needs surface passivators (like
magnesium phosphate (struvite) and cysteine [1]. Unavail-                   thiophenol, mercapto acetate and thiourea) that may pollute
ability of proper conventional therapeutic treatments for kidney            the environment [4,10]. The chemical synthesis of AgNPs may
stone and side effects associated with surgery motivates the                cause adsorption of toxic entities on the particles surface, which
investigators to search natural remedies that can remove larger             manifest in adverse effects on administration. Hence, search
stones [2]. The urinary tract infections caused by gram positive            for a method that presents higher environmental safety, economy,
and negative bacteria are known to enhance the chances of                   non-toxicity, and yield is a serious concern for the researchers.
stones formation [3]. Research suggests extensive adminis-                        The synthesis of nanoparticles using plant materials is
tration of conventional antibiotics offer several shortcomings,             considered as green. The nanoparticles green synthesis offers
such as: prolonged treatment, multiple drug resistance (MDR),               several benefits, such as environmental friendliness, simplicity,
and high mortality risk [4]. Current decade witnesses enormous              cost-effectiveness, stability and reproducibility [11-13]. Studies
research over metallic nanoparticles, especially over silver                report corn silk (an agrowaste of Zea mays) to possess anti-
nanoparticles (AgNPs).                                                      oxidant [14], antimicrobial [15], diuretic [16] and nephropro-

This is an open access journal, and articles are distributed under the terms of the Attribution 4.0 International (CC BY 4.0) License. This
license lets others distribute, remix, tweak, and build upon your work, even commercially, as long as they credit the author for the original
creation. You must give appropriate credit, provide a link to the license, and indicate if changes were made.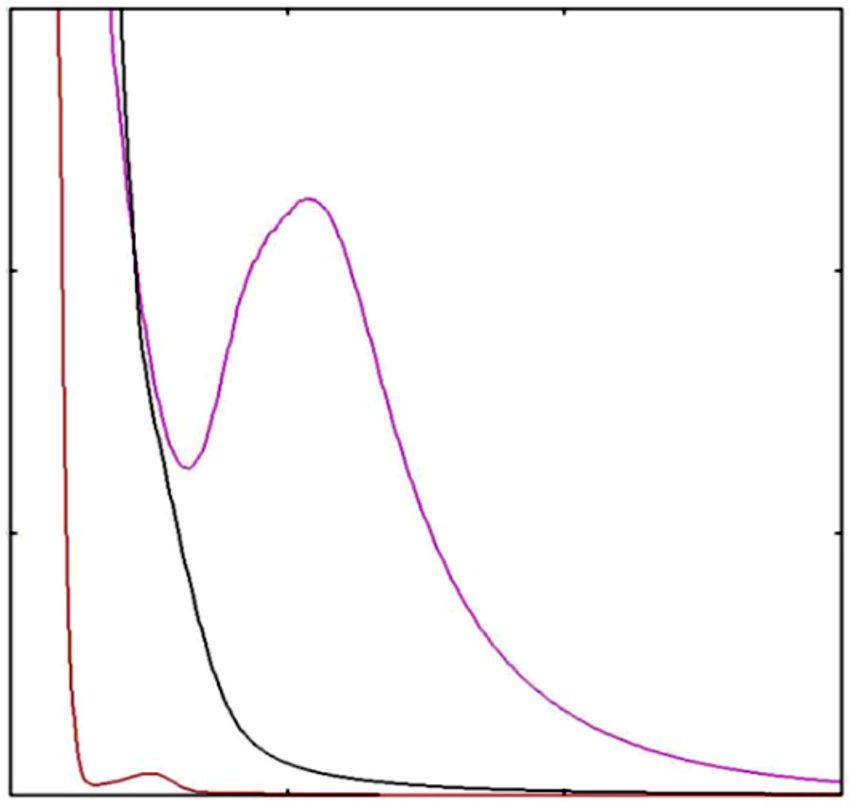
1498 Fuloria et al.                                                                                                      Asian J. Chem.

tective [17] activities. Evidences suggest that the potency of          was performed as per reported protocols with minor modi-
corn silk to inhibit bacteria and calcium oxalate crystals growth       fications [4,18].
could be augmented by blending into AgNPs. Hence, present                    Optimization based on concentration of AgNO3: The
study was intended to perform synthesis of AgNPs using corn             four different concentrations of AgNO3 (1, 2, 3 and 5 mM) were
silk and evaluate their antibacterial and antiurolithiatic potential.   used for AgNPs synthesis. The four reaction mixtures were
Present study involved corn silk aqueous extract (CSAE) prep-           subjected to visual examination (for monitoring of colour change
aration using decoction; and AgNPs synthesis (using CSAE),              from yellow to brown) and UV-visible spectrometry (for obser-
optimization (by UV-visible spectrometry), stability study              vation of SPR signal in UV-visible spectrum) to determine the
(using UV-visible spectrometry), characterization (FTIR, XRD,           ideal concentration of AgNO3 required for synthesis of pure
FESEM and EDX analysis), antimicrobial evaluation against               AgNPs.
pathogenic bacteria (well-diffusion method) and in vitro anti-               Optimization based on volumetric ratio of CSAE to
urolithiatic evaluation against crystal growth inhibition (nucleation   AgNO3: The five different volumetric ratios of CSAE to
assay).                                                                 AgNO3 (1:9, 1.5:8.5, 2:8, 2.5:7.5 and 5:5) were used for AgNPs
                                                                        synthesis. All five reaction mixtures were subjected to visual
                       EXPERIMENTAL                                     examination (to observe color change from yellow to brown)
     Preparation of corn silk aqueous extract: Whole corn               and UV-visible spectrometric analysis (to monitor SPR signal)
(Zea mays) was procured from the province of Sungai Petani,             to determine the ideal volumetric ratios of CSAE to AgNO3
Malaysia. Silky hairs (Stigma maydis) were collected from               required for synthesis of pure AgNPs.
each fruit, washed (to remove impurities/dirt), dried for 24 h               Optimization based on pH: The three solution mixtures
at 40 ºC and finally powdered. Accurately weighed 25 g of               were prepared and maintained at different pH 5, 7 and 8 for
corn silk powder was added to 400 mL of deionized water and             AgNPs synthesis. The pH of three reaction mixtures was adjusted
boiled for 15 min with continuous stirring. Mixture was cooled          by adding 0.1 N HCl and/or 0.1 N NaOH solutions. Each reaction
to room temperature, filtered and filtrate was centrifuged at           mixture with different pH was subjected to visual examination
5000 rpm for 15 min. Supernatant liquid of corn silk aqueous            (for observation of change in colour from yellow to brown)
extract (CSAE) was collected and stored in refrigerator at 4            and UV-visible analysis (for monitoring of SPR peak) to deter-
ºC for further use.                                                     mine the ideal pH required for synthesis of pure AgNPs.
     Synthesis of AgNPs: The synthesis of AgNPs was per-                     Optimization based on temperature: Three reaction
formed by following protocol with slight modification [18].             mixtures were prepared and maintained in same conditions
Briefly, in a 100 mL volumetric flask 25 mL of CSAE and 75              except for temperature 5, 25 and 60 °C. The three reaction
mL of 5 mM AgNO3 solution were added and mixed well.                    mixtures were subjected to visual examination (to monitor
The flask was wrapped with aluminium foil (to prevent photo-            colour change from yellow to brown) and UV-visible analysis
lysis). The pH of the mixture was adjusted to pH 8 by adding            (to observe the SPR signal) to determine the most suitable
0.1 N NaOH solution. The mixture was kept in dark at room               temperature required for synthesis of pure AgNPs.
temperature for 24 h. The change in colour of solution from                  Stability studies over synthesized AgNPs: Stability study
golden yellow to dark brown indicated the reduction of silver           of synthesized AgNPs was based on the reported methods with
nitrate to silver nanoparticles. The mixture was centrifuged at         minor modifications [4,18]. The AgNPs stability was deter-
5000 rpm for 90 min. The supernatant layer was discarded to             mined based on SPR signal range (340 to 540 nm) in UV-visible
offer crude AgNPs pellet. The crude AgNPs pellet was rewashed           absorption spectrum. The measurements for stability study
(repeatedly 2 to 3 times) with deionized water, re-centrifuged          were made at 0 h, 24 h, 7 days, 15 days and 30 days.
and finally air dried to yield pure AgNPs.                                   Characterization of AgNPs: Once the optimization and
     UV-visible analysis: The successful synthesis of AgNPs             stability studies of AgNPs were completed, pure AgNPs were
was confirmed by UV-visible spectrometry. The UV visible                subjected to characterization experiments mentioned earlier
analysis was conducted according to reported protocol with              [18]. Prior to characterization studies, the synthesized AgNPs
minor modifications [19]. Briefly, in a 10 mL volumetric flask,         were repeatedly washed and centrifuged using deionized water.
1 mg of dried AgNPs was dissolved in 9 mL of deionized water.           Repeated washing and centrifugation process was done to avoid
Finally, the volume was made up to 10 mL and test mixture               interference of unbound residual biochemical entities of CSAE
was subjected to UV-visible analysis at room temperature to             with characterization data of biogenic AgNPs. The character-
detect the surface plasmon resonance (SPR) signal. The measu-           ization of biogenic AgNPs was based on several analytical
rement was made at 200 to 800 nm using Shimadzu U-2800                  techniques, such as Fourier transformed infrared spectrometry
spectrophotometer running at a scanning speed of 300 nm/min.            (FTIR), field emission scanning electron microscopy (FESEM),
The UV-visible absorption spectrum of AgNPs determined the              X-ray diffraction (XRD) and energy-dispersive X-ray (EDX)
reduction of Ag+ ions.                                                  spectrometry. Formation of AgNPs was determined based on
     Optimization of AgNPs synthesis: The synthesis of                  the change in colour of solution, UV-Visible (Shimadzu U-2800)
AgNPs was optimized using UV-visible studies over CSAE                  and FTIR (PerkinElmer SLE/MSC4/29) spectrometric data.
and silver nitrate reaction mixture maintained under different          The FESEM measurement was performed to understand the
parametric conditions, such as volumetric ratio of CSAE to              morphology of AgNPs using FEI Nova NanoSEM 450. The
AgNO3, concentration of AgNO3, pH, temperature and stability            AgNPs crystal nature was determined by observing their XRD
studies with time required for synthesis of AgNPs. Optimization         pattern using PANalytical X'Pert PRO MRD PW 3040/60 X-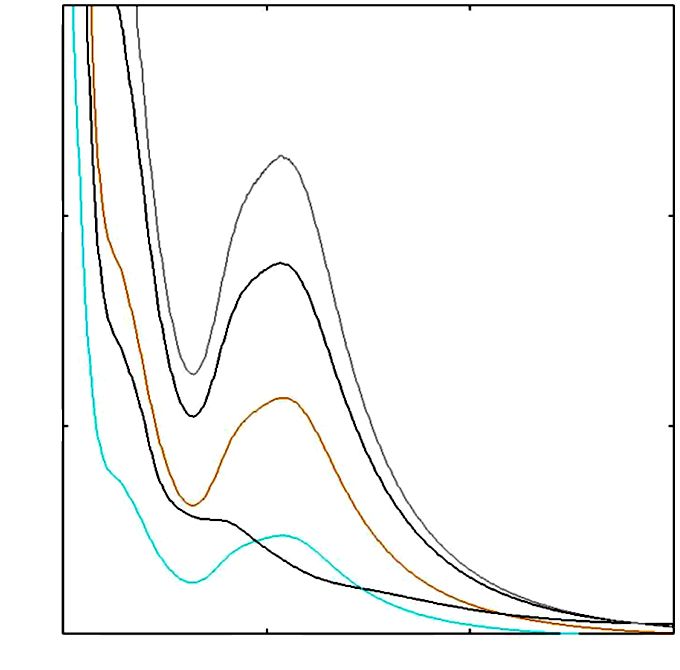
Vol. 32, No. 6 (2020)                                    Synthesis of Silver Nanoparticles of Corn Silk Agrowaste and Their Bioactivities 1499

ray diffractometer. XRD measurement was operated at 40 kV                   (CSAE) was kept aside at 25 ºC for monitoring of change in
and 40 mA and spectrum was recorded by CuKαβ radiation                      colour. After 24 h, a colour change from yellow to brown was
with a wavelength of Å in the 1.54060 2θ range of 10º-80º.                  observed. The brown colour solution, when subjected to UV-
The EDX measurement was performed using FEI Nova Nano-                      visible spectrometric analysis, resulted in a signal at 430 nm
SEM 450 with EDX unit.                                                      in the UV-visible absorption spectrum (Fig. 1) indicated the
     Antimicrobial activity: The synthesized AgNPs and corn                 formation of AgNPs.
silk aqueous extract (CSAE) were evaluated for antimicrobial
potential against K. pneumoniae (ATCC 10031), E. coli (ATCC                         0.300

8739), S. aureus (ATCC 29737) and B. cereus (ATCC 11778)
using well-diffusion method [4]. Briefly, the fresh and pure
culture of each bacterial strain was sub-cultured over nutrient
broth (NB) at 37 ºC (previously shaken on a rotary shaker at                                                           3
200 rpm). The strain of each bacterial culture was uniformly                        0.200
swabbed using sterile cotton over individual nutrient agar

                                                                            Absorbance
plates. Using gel puncture wells of 6 mm size were drilled on
nutrient agar plates. In each well of nutrient agar plate, using
micropipette were added AgNPs (100, 200, 400, 600, 800 and
1000 µg/mL), CSAE (10, 20, 40, 60, 80 and 100 mg/mL), and                                                 1
                                                                                    0.100
ciprofloxacin (50 µg/mL) each in a volume of 50 µL. Lastly,
the plates were incubated at 37 ºC for 24 h and zone of inhibitions
were measured.
     Antiurolithiatic activity: Antiurolithiatic (nucleation test)
activity of synthesized AgNPs and corn silk aqueous extract                                           2
(CSAE) against calcium oxalate crystals growth was conducted                             0
                                                                                         200                    400                     600            800
as per the procedure given in research study of Atmani and Khan                                                       Wavelength (nm)
[19] with slight modification. Briefly, the solutions of sodium                                Fig. 1. UV-visible spectra indicating AgNPs synthesis
oxalate and calcium chloride were prepared in a concentration
of 7.5 mM and 5 mM, respectively, in a buffer of Tris 0.05 M                     In Fig. 1, curve 3 exhibited signal at 430 nm for AgNPs,
and NaCl 0.15 M. The solutions were maintained at 37 ºC.                    whereas curve 1 (pure CSAE) and curve 2 (AgNO3) exhibited
Both the solutions were filtered through 0.22 µm filter. The                no signal in AgNPs UV-visible range. The results of present
CSEA solution was prepared in different concentrations, such                study were authenticated based on presence of SPR signal within
as 20, 40, 60, 80, 100 mg/mL and without CSAE (control). Into               the range of results claimed by other research studies [4,20,21].
the 200 µL of each CSAE solution was added 1800 µL of 5                     The resultant data of present study confirmed the successful
mM calcium chloride solution and mixed well. Crystallization                synthesis of silver nanoparticles using CSAE. Synthesis of
was initiated by adding 1800 µL of sodium oxalate into each                 AgNPs occurred, when AgNO3 was exposed to CSAE. Visual
CSAE solution. All the final solutions were magnetically stirred            examination of colour change from yellow to brown and absor-
at 800 rpm and visualized under the compound microscope to                  bance signal at 430 nm in UV-visible spectrum (Fig. 1) confir-
observe the formation of calcium oxalate crystals, if any. All              med formation of AgNPs and reduction of Ag+ to Ag0. UV-
the solutions were also subjected to the absorbance measure-                visible signal at 430 nm was attributed to surface plasmon
ment using UV-visible spectrometer at 620 nm for 6 min after                resonance property, conceivably a result of stimulation of
initiation of crystallization. The optical density (O.D.) of the            longitudinal plasmon vibrations [21].
solution was monitored at 620 nm. The temperature was main-                      Optimization of AgNPs synthesis: Optimization of AgNPs
tained at 37 ºC. The rate of nucleation was estimated by comp-              synthesis involved optimization of four parameters namely:
aring the induction time (delay before the appearance of crystals           AgNO3 concentration, ratio of CSAE to silver nitrate, pH and
that have reached a critical size and thus become optically                 temperature. Results were validated based on SPR peak range
detectable) in the presence of the extract with that of the control         claimed by standard investigations [4,20,21].
(no extract). The similar protocol was repeated with different                   Optimization based on AgNO3 concentration: The UV-
concentrations of synthesized AgNPs with concentrations of                  visible analysis assisted optimization over synthesis of AgNPs
1000, 800, 600, 400, 200 and 100 µg/mL. Percent inhibition                  based on four concentrations of AgNO3 (1, 2, 3 and 5 mM) as
was calculated using the following eqn. 1:                                  parameter offered a UV-visible spectrum (Fig. 2) exhibited
                                         A control − A drug                 four curves 1, 2, 3 and 4.
     Crystal growth inhibition (%) =                          × 100 (1)          According to Fig. 2, curves 1, 2, and 3 (related to 1, 2, 3
                                             A control                      mM AgNO3, respectively) did not showed any signal in the range
                                                                            of 435-450 nm. Whereas curve 4 (related to 5 mM AgNO3)
               RESULTS AND DISCUSSION                                       exhibited a signal at 430 nm representing formation of AgNPs.
     Synthesis of AgNPs: The AgNPs synthesis was confirmed                  The SPR signal at 430 nm displayed in curve 4 revealed the
based on visual examination and UV-visible analysis. Stirred                formation of AgNPs. Hence, 5 mM of AgNO3 concentration
reaction mixture of AgNO3 solution and corn silk aqueous extract            was considered as an optimum requirement for synthesis of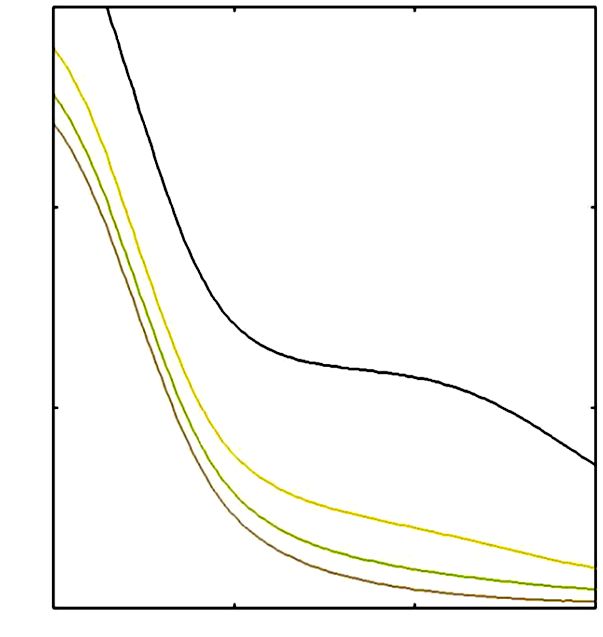
1500 Fuloria et al.                                                                                                                      Asian J. Chem.
             0.300                                                     SPR signals than curve 3. Among the 2:8 and 2.5:7.5 CSAE
                                                                       to AgNO3 ratio, the 2.5:7.5 ratio showed higher absorbance
                                                                       value at 430 nm, hence, 2.5:7.5 ratio of CSAE to AgNO3 was
                                                                       considered as optimum for synthesis of AgNPs. The optimi-
                                                                       zation study results for volumetric ratio of CSAE and AgNO3
                                                                       (2.5:7.5) to display signal at 430 nm was confirmed by obser-
             0.200                                                     ving the SPR signal range of other research studies [4,20,21].
                                                                            Optimization based on pH: The UV-visible experiment
                                                                       aided optimization study over synthesis of AgNPs based on
Absorbance

                            4                                          three pHs (pH 5, 7 and 8) yielded a UV-Visible spectrum (Fig.
                                                                       4) exhibiting three curves 1, 2 and 3. The UV-visible spectrum
                                                                       displayed no absorption signal for AgNPs in curve 1 (related
                                                                       to pH 5). The spectrum displayed SPR signal for AgNPs in
             0.100          3                                          curve 2 and 3 (related to pH 7 and pH 8) at 430 nm indicating
                           2
                                                                       the completion of synthesis of AgNPs. The UV-visible
                                                                       spectrum (Fig. 4) revealed that pH 5 (curve 1) was unsuitable
                                 1                                     to formulate AgNPs. Whereas, pH 7 and 8 (curve 2 and 3) were
                                                                       ideal to produce AgNPs displaying signal at 430 nm. Hence,
                                                                       maintaining the reaction at pH 7 and 8 was considered as opti-
                0                                                      mum for AgNPs synthesis. The absorbance of curve 3 was
                350         400                     450         500    higher indicated that pH 8 was more ideal to synthesize the
                                  Wavelength (nm)
Fig. 2. UV-visible spectra indicating AgNPs synthesis based on AgNO3   AgNPs using CSAE. The pH optimization results for synthesis
        concentration                                                  of AgNPs in present study were verified by observing the similar
                                                                       SPR signal range of other studies [4,20,21].
AgNPs using CSAE. Optimization results for AgNO3 concen-
                                                                                    0.300
tration (5 mM) in present study were confirmed by observing
the SPR signal range of other research in similar range [4,20,21].
     Optimization based on volumetric ratios of CSAE to
AgNO3: The optimization of synthesis of AgNPs based on
five volumetric ratios of CSAE to AgNO3 (1:9, 1.5:8.5, 2:8,                         1.500
2.5:7.5 and 5:5) as parameter generated UV-visible absorption
spectrum (Fig. 3) exhibited five curves 1, 2, 3, 4 and 5.                                                                3
                                                                       Absorbance

             1.200
                                                                                    1.000
                                                                                                                        2

             1.000

                                                                                    0.500

                                                                                                    1
Absorbance

                                                                                    0.014
                                                                                        300                     400                      500             550
             0.500     5                                                                                        Wavelength (nm)
                                                                                     Fig. 4. UV-visible spectra indicating AgNPs synthesis based on pH

                       4                                                    Optimization based on temperature: The UV-visible
                       3                                               study over AgNPs synthesis based on optimization of temp-
                                                                       erature (5 ºC, room temperature (25 ºC) and 60 ºC) produced
                       2
                                                                       a UV-visible spectrum (Fig. 5) exhibiting three curves 1, 2
                       1                                               and 3.
                 0
                 350            400                     450     500         The UV-visible spectrum (Fig. 5) displayed no absorption
                                      Wavelength (nm)
                                                                       signals in curve 2 (at 5 ºC). The spectrum with absorption
Fig. 3. UV-visible spectra indicating AgNPs synthesis based on CSAE/
        AgNO3 ratio                                                    signal for AgNPs in curve 1 and 3 (at 25 and 60 ºC) at 360 and
                                                                       440 nm revealed completion of synthesis of AgNPs. The
    Among the five curves, presence of SPR signal at 430 nm            absorption spectrum (Fig. 5) revealed that 5 ºC (curve 2) was
was observed in curve 3 and 4, which indicated the completion          not ideal to formulate AgNPs, whereas, 25 and 60 ºC (curve 1
of AgNPs synthesis. Curve 4 showed a higher absorbance of              and 3) were ideal temperature to produce AgNPs. Among curves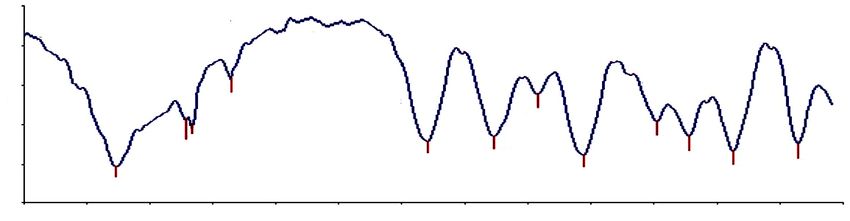
Vol. 32, No. 6 (2020)                                                                 Synthesis of Silver Nanoparticles of Corn Silk Agrowaste and Their Bioactivities 1501

                    0.300                                                                                                0.300

                                                                                                                                                           5

                    0.200                                                                                                0.200
                                1                                    3                                                                                     4

                                                                                                            Absorbance
Absorbance

                                                                                                                                                           3

                    0.100                                                                                                0.100

                                                   2
                                                                                                                                                           2
                                                                                                                                                  1

                          0                                                                                              0.014
                          200                     400                          600               800                         200                      400                        600                800
                                                        Wavelength (nm)                                                                                        Wavelength (nm)
Fig. 5. UV-visible spectra indicating AgNPs synthesis based on temperature                                                       Fig. 6. UV-visible spectrum indicating stability of AgNPs

1 and 3, curve 3 showed higher absorbance at 440 nm, hence                                                  tions), 1706 cm-1 (C=O vibrations). Resultant data indicated
the reaction at 60 ºC was considered as optimum for AgNPs                                                   the formation of AgNPs and reduction of Ag+ to Ag0. The CSAE
synthesis using CSAE. The results of optimization study over                                                was recognized as dual capping (stabilizing) and reducing agent
AgNPs synthesis were also supported by other literary                                                       based on the comparison of FTIR spectrum of CSAE and
evidences [4,20,21].                                                                                        synthesized AgNPs. The FTIR spectrum of CSAE as it retained
     Stability study for biogenic AgNPs: The UV-visible spectro-                                            majority of signals with marginal shifting and broadening. For
metry assisted in the stability study of synthesized AgNPs.                                                 example, 3467.21 cm-1 (O-H vibrations) narrow band in FTIR
The stability study was conducted for 0 h, 24 h, 7 days, 15                                                 spectrum of CSAE (Fig. 7) was shifted to 3472.33 cm-1 as a
days and 30 days. The UV-visible absorption spectrum (Fig. 6)                                               broad band in FTIR spectrum of AgNPs (Fig. 8).
of AgNPs containing 1, 2, 3, 4 and 5 curves for 0 h, 24 h, 7                                                      The literature revealed that corn silk consisted of various
days, 15 days and 30 days, respectively.                                                                    chemicals such as proteins, vitamins, alkaloids, tannins, phenolic
     Fig. 6 illustrated the retention of AgNPs signal in the range                                          compounds like anthocyanins, p-coumaric acid, vanillic acid,
of 428 to 450 nm. The spectrum exhibited increase in absor-                                                 procatechuic acid, derivatives of hisperidin and quercetin. It
bance of AgNPs with time and represented AgNPs stability                                                    is also very rich in flavonoids including maysin and rutin [22].
after 30 days due to retention of AgNPs signal in the range of                                              The FTIR spectrum of biogenic AgNPs of the present study
428 to 450 nm. The present study AgNPs signal range was                                                     revealed that an interaction of biochemical moieties of CSAE
also supported by other research studies [4].                                                               with AgNPs caused broadening and marginal shifting of IR
     FTIR analysis: The FTIR characterization aided in the                                                  band signal positions relatively. This recognized the dual role
determination of Ag+ to Ag0 reduction and AgNPs formation                                                   of CSAE both as reducing and stabilizing agent [4,23]. The
[4]. The FT-IR spectrum of CSAE (Fig. 7) displayed the                                                      resultant broadening and shifting of absorption bands in FTIR
characteristic bands at 3467 cm-1 (O-H vibrations), 2926 and                                                spectrum of AgNPs in comparison to pure CSAE was also
2877 cm-1 (C-H vibrations), 1704 cm-1 (C=O vibrations). The                                                 supported by other investigations [24,25].
FTIR spectrum for AgNPs (Fig. 8) displayed the shifted bands                                                      FESEM analysis: The FESEM micrographs (Fig. 9) indi-
3472 cm-1 (O-H vibrations), 2927 and 2879 cm-1 (C-H vibra-                                                  cated that synthesized AgNPs were well dispersed, spherical

                    100

                    80
Transmittance (%)

                    60
                                                                     2679.31
                                                                                                                                       1361.22
                    40                                                                                 1704.97
                                                           2877.53
                                                          2926.46

                                                                                                                                                                  991.38
                                                        3128.34

                                                                                                                            1498.52                                     886.91
                    20                                                                                                                                                                     547.23
                                                                                                                                                 1225.73                         741.69
                                       3467.21
                     0
                     4000           3600         3200           2800           2400     2000     1800      1600                       1400         1200           1000       800          600       400
                                                                                                              –1
                                                                                                Wavelength (cm )
                                                                                      Fig. 7. FTIR spectra of pure CSAE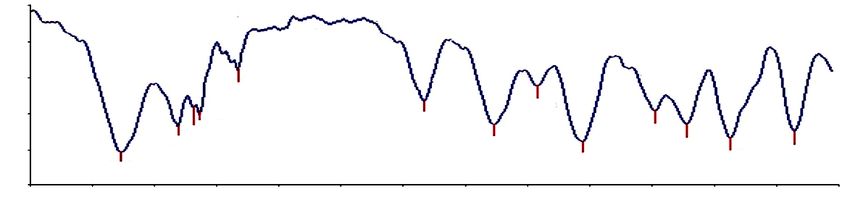
1502 Fuloria et al.                                                                                                                                                          Asian J. Chem.
                    100

                    80
Transmittance (%)

                    60
                                                               2678.91
                                                                                                                              1361.77
                    40

                                                     2879.66
                                                                                                                                                   991.93

                                                    2927.21
                                                                                                  1706.19           1498.23                              887.56
                    20                                                                                                                                              742.32        546.38
                                                                                                                                        1226.31
                                      3472.33
                     0
                     4000         3600       3200          2800          2400      2000        1800      1600              1400          1200     1000          800              600        400
                                                                                                            –1
                                                                                              Wavelength (cm )
                                                                         Fig. 8. FTIR spectra of pure biosynthesized AgNPs

                                                                                                           100

                                                                                                      Counts
                                                                                                               25

                                                                                                                0
                                                                                                                      10          20        30     40          50       60             70
                                                                                                                                                  2θ (°)
                                                                                                                                   Fig. 10. XRD spectrum of AgNPs

                                                                                                      to carbon (13.45%), oxygen (5.5%), nitrogen (4.14%), chlorine
                                      Fig. 9. FESEM image of AgNPs                                    (14.99%). Generally, metallic silver nanoparticle shows their
                                                                                                      typical optical absorption peak approximately at 3 KeV [26,27].
shaped and ranged between 22.05-36.69 nm in size and resulted                                         The EDX spectrum showed a strong signal for silver along
by complete reduction of silver from silver nitrate solution by                                       with weak oxygen peak which may be attributed to the bio-
CSAE.                                                                                                 molecules that were bound to the surface of silver nanoparticles,
     XRD analysis: The analysis of XRD pattern (Fig. 10)                                              indicating the reduction of silver ions to elemental silver.
showed the distinctive diffraction peaks at 2θ values of 32.27º,                                           Antimicrobial activity of AgNPs: The AgNPs have exten-
40.72º, 46.20º, 65.69º, 69.31º and 76.49º designated to (111),                                        sive use being an antimicrobial and registered as more potent
(200), (220) and (311) reflection planes of the face-centered                                         in comparison to silver ions [28,29]. The resultant data given
cubic structure of silver. By using the Debye-Scherrer formula,                                       in Table-1 revealed that inhibition zone of synthesized AgNPs
an average crystallite size of nanoparticles was found to be in                                       was much higher than pure CSAE. When compared to ciproflo-
the range of 31.9-55.44 nm. The XRD pattern results of present                                        xacin, newer AgNPs exhibited a maximum zone of inhibition
study were verified by other standard studies [4,23].                                                 against S. aureus (18.6 mm at 0.5 mg/mL and 22.8 mm at
     EDX analysis: The EDX spectrum of AgNPs (Fig. 11)                                                1 mg/mL) and K. pneumoniae (18.3 mm at 0.5 mg/mL and 20.0
exhibited silver (62.17%) as a major constituent element compared                                     mm at 1 mg/mL). The AgNPs displayed lesser zone of inhibition
                     6

                                                                          Ag
                     4                                              Cl
cps/eV

                              C

                     2        N
                                  O

                     0
                          0              1               2                 3              4           5                       6              7             8                 9              keV
                                                                                 Fig. 11. EDX spectrum of AgNPs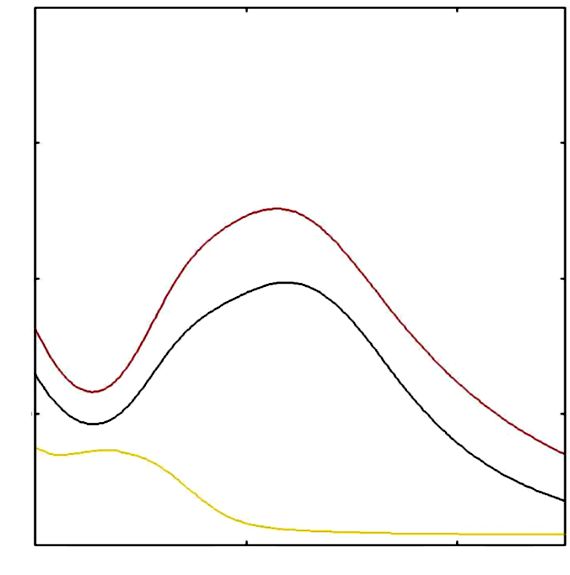
Vol. 32, No. 6 (2020)                               Synthesis of Silver Nanoparticles of Corn Silk Agrowaste and Their Bioactivities 1503

                                                             TABLE-1
                                               ZONE OF INHIBITION (EXPRESSED IN mm)
                                                                  Zone of inhibition (mm)
 Microorganism
                                 Silver nanoparticles                                 Corn silk aqueous extract                                               Ciprofloxacin
 Conc. (µg/mL)       10      20      40       60         80    100       10        20       40        60        80                                     100         50
 B. cereus          13.5     13     14.5     15.7       17.0   17.0     N/A       N/A      N/A       N/A      N/A                                      N/A         21
 S. aureus          13.6    16.5    20.1     18.6       19.9   22.8     N/A       N/A      N/A       N/A      N/A                                      N/A         21
 E. coli            13.8    15.2    16.5     18.6       18.8   18.9     N/A       N/A      N/A       N/A      N/A                                      N/A         20
 K. pneumoniae      13.1    15.2    17.5     18.3       18.3   20.0     N/A       N/A      N/A       N/A      N/A                                      N/A         21
 N/A: No activity

against E. coli (18.6 mm at 0.5 mg/mL and 18.9 mm at 1 mg/                                             100
mL) and B. cereus (15.7 mm at 0.5 mg/mL and 17.0 mm at

                                                                       Crystal growth inhibition (%)
1 mg/mL). In comparison to AgNPs, pure CSAE exhibited no
                                                                                                       75
zone of inhibition of against E. coli, S. aureus, K. pneumoniae
and B. cereus. Interestingly, a pattern was observed in the anti-
microbial activity of newer AgNPs, when the concentration                                              50
of AgNPs was increased from 0.1 mg/mL to 1 mg/mL, there
was a significant increase in the zone of inhibition. The anti-
microbial activity results indicated that capping of silver with                                       25                                                                 33
                                                                                                                                                             30
                                                                                                                                                  26
biochemical moieties of CSAE (sugars, proteins, coumarins,                                                                             22
                                                                                                                            19
anthraquinones, saponin glycosides, flavonoids, alkaloids,                                                       12
tannins and phenolic compounds) caused a marked increase
                                                                                                                 100        200      400         600      800         1000
in the antimicrobial potential of AgNPs. This pattern of incre-
                                                                                                                              Concentration of AgNPs (µg/mL)
ment in antimicrobial response due to biochemical moieties
                                                                                                             Fig. 12. Crystal growth inhibition by biosynthesized AgNPs
of plant extract (used for the synthesis of silver nanoparticles)
is also supported by other investigations [24]. Other investi-
                                                                       oxalate crystals in solution without CSAE (A), with CSAE
gations also supported that AgNPs smaller in size and higher
                                                                       100 mg/mL (B) and with 1000 µg/mL AgNPs (C).
in dose exhibits higher antimicrobial potential [30,31].
                                                                            Hence, based on the antiurolithiatic results offered by the
     As per the antimicrobial results of present study and literary
                                                                       AgNPs blended with CSAE, it can be postulated that AgNPs
evidences [32], it can be postulated that biochemical moieties
                                                                       synthesized using CSAE would be advantageous in prevention
of CSAE caused capping of silver and lead to marked increase
                                                                       of urinary stone formation by promoting the excretion of small
in antimicrobial potential of AgNPs against periodontitis causing
                                                                       particles from the kidney. Although further in vivo studies are
pathogenic microbiota.
                                                                       yet to be done, but present study provides the basis over
     Antiurolithiatic activity of synthesized AgNPs against
                                                                       antiurolithiatic potential of AgNPs synthesized using CSAE.
calcium oxalate crystals growth: Fig. 12 exhibited the positive
antiurolithiatic activity of biogenic AgNPs as they inhibited          Conclusion
the crystallization of calcium oxalate and prevented nucleation.            The visual examination, UV-visible and FTIR data of the
The antiurolithiatic potential of CSAE and AgNPs in different          present study confirmed the success of synthesis of silver nano-
concentrations was also supported by observing the micro-              particles using corn silk aqueous extract (CSAE). The FESEM,
scopic view. There were smaller and lesser particles when the          EDX and XRD data established that AgNPs were well dispersed,
concentration of AgNPs was increased from lower to higher.             spherical shaped, crystalline nature and their size ranged from
Fig. 13 represents the microscopic view (nucleation) of calcium        22.05-36.69 nm. The biological investigations of present study

Fig. 13.Microscopic view of calcium oxalate crystals in solution without CSAE (A), with CSAE 100 mg/mL (B) and with 1000 µg/mL
        AgNPs (C)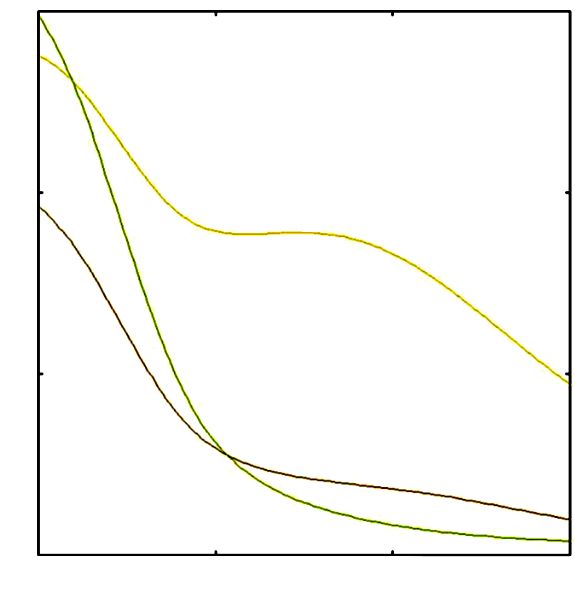
1504 Fuloria et al.                                                                                                                        Asian J. Chem.

conclude silver nanoparticles to possess substantial antimicro-                13. J. Mittal, R. Jain and M.M. Sharma, Adv. Nat. Sci.: Nanosci. Nanotech.,
bial and antiurolithiatic potential; and recommends corn silk                      8, 025011 (2017);
                                                                                   https://doi.org/10.1088/2043-6254/aa6879
aqueous extract (CSAE) as a potential source for production                    14. K.J. Wang and J.L. Zhao, Biomed. Pharmacother., 110, 510 (2019);
of silver nanoparticles.                                                           https://doi.org/10.1016/j.biopha.2018.11.126
                                                                               15. A.B.L.D. Carvalho, C.A. Cruz, C.L.A.D. Freitas, J.J.D.S. Aguiar, P.L.W.
                    ACKNOWLEDGEMENTS                                               D.S. Nunes, V.M.D.S. Lima, E.F.F. Matias, D.F. Muniz and H.D.M.
                                                                                   Coutinho, Antibiotics, 8, 22 (2019);
    The authors are thankful to Nano Optoelectronic Research                       https://doi.org/10.3390/antibiotics8010022
and Technology (NOR) Lab, School of Physics, Universiti Sains                  16. A.W. Ha, H.J. Kang, S.L. Kim, M.H. Kim and W.K. Kim, Prev. Nutr.
                                                                                   Food Sci., 23, 70 (2018);
Malaysia for assisting in spectral analysis.                                       https://doi.org/10.3746/pnf.2018.23.1.70
                                                                               17. N. Tanideh, F. Zarifi, S. Rafiee, M. Khastkhodaei, O.K. Hosseinabadi,
                   CONFLICT OF INTEREST                                            F. Tarkesh, Z. Kherad, M.M. Taghi, M. Kamali, G. Shekarkhar, M. Jahromi
                                                                                   and F. Zarifi, Galen Med. J., 7, 1258 (2018);
    The authors declare that there is no conflict of interests                     http://dx.doi.org/10.22086/gmj.v0i0.1258
regarding the publication of this article.                                     18. S. Fuloria, N.K. Fuloria, C.J. Yi, T.M. Khei, T.A. Joe, L.T. Wei, S.
                                                                                   Karupiah, N. Paliwal, K. Sathasivam, Bull. Enviorn. Pharmacol. Life
                           REFERENCES                                              Sci., 8, 112 (2019).
                                                                               19. F. Atmani and S.R. Khan, BJU Int., 85, 621 (2000);
1.  C. Fisang, R. Anding, S.C. Muller, S. Latz and N. Laube, Dtsch. Arztebl.       https://doi.org/10.1046/j.1464-410x.2000.00485.x
    Int., 112, 83 (2015);                                                      20. J.K. Patra and K.-H. Baek, Front. Microbiol., 8, 167 (2017);
    https://doi.org/10.3238/arztebl.2015.0083                                      https://doi.org/10.3389/fmicb.2017.00167
2. P. Das, K. Kumar, A. Nambiraj, R. Rajan, R. Awasthi, K. Dua and M.          21. P. Logeswari, S. Silambarasan and J. Abraham, Sci. Iran., 20, 1049 (2013).
    Himaja, Int. J. Biol. Macromol., 103, 621 (2017);                          22. M.A. Ebrahimzadeh, M. Mahmoudi, N. Ahangar, S. Ehteshami, F.
    https://doi.org/10.1016/j.ijbiomac.2017.05.096                                 Ansaroudi, S.F. Nabavi, S.M. Nabavi and I. Sari, Pharmacologyonline,
3. P. Das, K. Kumar, A. Nambiraj, R. Awasthi, K. Dua and H. Malipeddi,             3, 347 (2009).
    Recent Pat. Drug Deliv. Formul., 12, 170 (2019);                           23. K. Anandalakshmi, J. Venugobal and V. Ramasamy, Appl. Nanosci., 6,
    https://doi.org/10.2174/1872211312666180723160624                              399 (2016);
4. N.K. Fuloria, S. Fuloria, K.Y. Chia, S. Karupiah and K. Sathasivam, J.          https://doi.org/10.1007/s13204-015-0449-z
    Appl. Biol. Biotechnol., 7, 1 (2019);                                      24. M. Shaik, M. Khan, M. Kuniyil, A. Al-Warthan, H. Alkhathlan, M. Siddiqui,
    https://doi.org/10.7324/JABB.2019.70408                                        J. Shaik, A. Ahamed, A. Mahmood, M. Khan and S. Adil, Sustainability,
5. T.C. Dakal, A. Kumar, R.S. Majumdar and V. Yadav, Front. Microbiol.,            10, 913 (2018);
    7, 1831 (2016);                                                                https://doi.org/10.3390/su10040913
    https://doi.org/10.3389/fmicb.2016.01831                                   25. H. Erjaee, H. Rajaian and S. Nazifi, Adv. Nat. Sci.: Nanosci. Nanotech.,
6. C.E. Escárcega-González, J.A. Garza-Cervantes, A. Vazquez-Rodríguez,            8, 025004 (2017);
    L.Z. Montelongo-Peralta, M.T. Treviño-Gonzalez, E. Díaz Barriga                https://doi.org/10.1088/2043-6254/aa690b
    Castro, E.M. Saucedo-Salazar, R.M. Chávez Morales, D.I. Regalado-Soto,     26. A. Deljou and S. Goudarzi, Iranian J. Biotechnol., 14, 25 (2016);
    F.M. Treviño-González, J.L. Carrazco-Rosales, R. Villalobos-Cruz and           https://doi.org/10.15171/ijb.1259
    J.R. Morones-Ramirez, Int. J. Nanomedicine, 13, 2349 (2018);               27. A.S. Dakhil, J. King Saud. Univ. Sci., 29, 462 (2017);
    https://doi.org/10.2147/IJN.S160605                                            https://doi.org/10.1016/j.jksus.2017.05.013
7. A.E. Mohammed, A. Al-Qahtani, A. Al-Mutairi, B. Al-Shamri and K.            28. J. Sudiono, F. Sandra, N.S. Halim, T.A. Kadrianto and M. Melinia,
    Aabed, Nanomaterials, 8, 382 (2018);                                           Dent. J. Majal. Ked. Gig., 46, 9 (2013);
    https://doi.org/10.3390/nano8060382                                            https://doi.org/10.20473/j.djmkg.v46.i1.p9-13
8. Y.Y. Loo, Y. Rukayadi, M.-A.-R. Nor-Khaizura, C.H. Kuan, B.W. Chieng,       29. X. Yan, B. He, L. Liu, G. Qu, J. Shi, L. Hu and G. Jiang, Metallomics,
    M. Nishibuchi and S. Radu, Front. Microbiol., 9, 1555 (2018);                  10, 557 (2018);
    https://doi.org/10.3389/fmicb.2018.01555                                       https://doi.org/10.1039/C7MT00328E
9. J. Venkatesan, S.K. Singh, S. Anil, S.K. Kim and M.S. Shim, Molecules,      30. S. Gurunathan, Y.J. Choi and J.H. Kim, Int. J. Mol. Sci., 19, 1210 (2018);
    23, 1429 (2018);                                                               https://doi.org/10.3390/ijms19041210
    https://doi.org/10.3390/molecules23061429                                  31. E. Pazos-Ortiz, J.H. Roque-Ruiz, E.A. Hinojos-Márquez, J. López-
10. A. Mehmood, G. Murtaza, T.M. Bhatti and R. Kausar, Acta Metal.                 Esparza, A. Donohué-Cornejo, J.C. Cuevas-González, L.F. Espinosa-
    Sinica, 27, 75 (2014);                                                         Cristóbal and S.Y. Reyes-López, J. Nanomater., 2017, 1 (2017);
    https://doi.org/10.1007/s40195-014-0025-7                                      https://doi.org/10.1155/2017/4752314
11. M. Gomathi, P. Rajkumar, A. Prakasam and K. Ravichandran, Resour.          32. R. Emmanuel, S. Palanisamy, S.-M. Chen, K. Chelladurai, S. Padmavathy,
    Efficient Technol., 3, 280 (2017);                                             M. Saravanan, P. Prakash, M.A. Ali and F.M.A. Al-Hemaid, Mater.
    https://doi.org/10.1016/j.reffit.2016.12.005                                   Sci. Eng. C, 56, 374 (2015);
12. S. Jain and M.S. Mehata, Sci. Rep., 7, 15867 (2017);                           https://doi.org/10.1016/j.msec.2015.06.033
    https://doi.org/10.1038/s41598-017-15724-8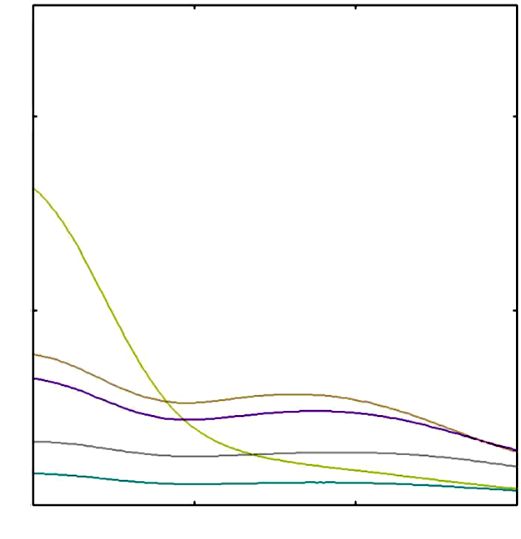
You can also read