Combining Visible and Infrared Spectrum Imagery using Machine Learning for Small Unmanned Aerial System Detection
←
→
Page content transcription
If your browser does not render page correctly, please read the page content below
Combining Visible and Infrared Spectrum Imagery using
                                             Machine Learning for Small Unmanned Aerial System
                                                                  Detection
                                                               Vinicius G. Goecksa , Grayson Woodsb , and John Valaseka
                                                           a
                                                              Department of Aerospace Engineering, Texas A&M University
                                                          b
                                                              Department of Mechanical Engineering, Texas A&M University
arXiv:2003.12638v2 [cs.CV] 2 Apr 2020

                                                                                          ABSTRACT
                                        There is an increasing demand for technology and solutions to counter commercial, off-the-shelf small unmanned
                                        aerial systems (sUAS). Advances in machine learning and deep neural networks for object detection, coupled
                                        with lower cost and power requirements of cameras, led to promising vision-based solutions for sUAS detection.
                                        However, solely relying on the visible spectrum has previously led to reliability issues in low contrast scenarios
                                        such as sUAS flying below the treeline and against bright sources of light. Alternatively, due to the relatively high
                                        heat signatures emitted from sUAS during flight, a long-wave infrared (LWIR) sensor is able to produce images
                                        that clearly contrast the sUAS from its background. However, compared to widely available visible spectrum
                                        sensors, LWIR sensors have lower resolution and may produce more false positives when exposed to birds or
                                        other heat sources. This research work proposes combining the advantages of the LWIR and visible spectrum
                                        sensors using machine learning for vision-based detection of sUAS. Utilizing the heightened background contrast
                                        from the LWIR sensor combined and synchronized with the relatively increased resolution of the visible spectrum
                                        sensor, a deep learning model was trained to detect the sUAS through previously difficult environments. More
                                        specifically, the approach demonstrated effective detection of multiple sUAS flying above and below the treeline,
                                        in the presence of heat sources, and glare from the sun. Our approach achieved a detection rate of 71.2 ± 8.3%,
                                        improving by 69% when compared to LWIR and by 30.4% when visible spectrum alone, and achieved false alarm
                                        rate of 2.7 ± 2.6%, decreasing by 74.1% and by 47.1% when compared to LWIR and visible spectrum alone,
                                        respectively, on average, for single and multiple drone scenarios, controlled for the same confidence metric of the
                                        machine learning object detector of at least 50%. With a network of these small and affordable sensors, one can
                                        accurately estimate the 3D position of the sUAS, which could then be used for elimination or further localization
                                        from more narrow sensors, like a fire-control radar (FCR). Videos of the solution’s performance can be seen at
                                        https://sites.google.com/view/tamudrone-spie2020/.
                                        Keywords: Automatic Target Recognition, ATR, Small Unmanned Aerial Systems, LWIR, Deep Learning,
                                        Machine learning.

                                                                                    1. INTRODUCTION
                                        Small unmanned aircraft systems (sUAS), commonly called drones, were once only thought of as military aircraft.
                                        We have seen images from the government or the news media showing comparatively larger aircraft such as the
                                        General Atomics MQ-9 Reaper, which are being controlled by an operator sitting hundreds of miles away. They
                                        are effective in performing surveillance but can also deploy weapons without risking its operator. Increasingly,
                                        the technology to control and operate such unmanned aircraft is becoming affordable and easily available. We
                                        are seeing a rise in the manufacturing of consumer-grade and commercial-grade sUAS. Companies such as DJI,1
                                           Further author information:
                                           Vinicius G. Goecks, Graduate Research Assistant, Vehicle Systems & Control Laboratory, vinicius.goecks@tamu.edu
                                           Grayson Woods, Graduate Research Assistant, Unmanned Systems Laboratory, graysonwoods@tamu.edu
                                           Niladri Das, Graduate Research Assistant, Intelligent Systems Research Laboratory, niladridas@tamu.edu
                                           John Valasek, Professor and Director, Vehicle Systems & Control Laboratory, valasek@tamu.edu

                                                                                                 1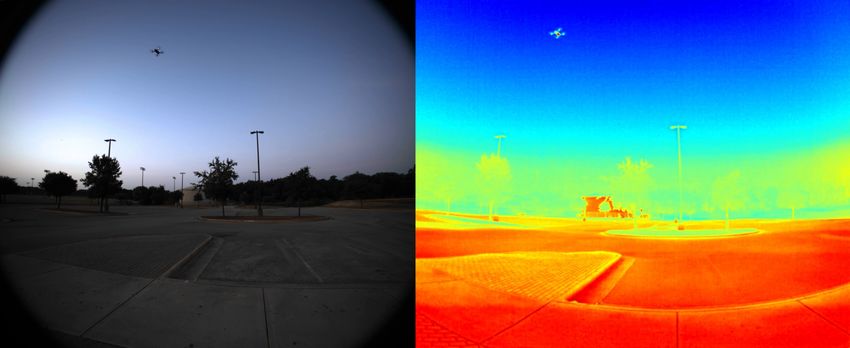
Parrot,2 and Autel Robotics3 have drones equipped with high definition RGB and infrared cameras, sophisticated
mission planners, and are capable of completing its mission autonomously, that can be bought for as little as
$1000 USD. This capability is posing crucial privacy and security threats to people and organizations around
the world, specially when these drones are retrofitted with sophisticated cameras and possibly weapons, which
sparked a need for counter-sUAS, or counter-drone, solutions.
   One of the components of a counter-drone solution is the detection of the drone. Due to the wide availability of
cameras and advancements in deep learning and computer vision techniques, vision-based solutions became more
appealing to address the detection problem. Vision based-object detection techniques were mainly developed to
detect objects on the visible spectrum while using RGB cameras. However, accuracy strongly decreases when
detecting objects under fog, rain, or in poorly illuminated environments. As an alternative, long-wave infrared
(LWIR) cameras are more robust to these conditions but are less accurate due to lower resolution and false
positives when detecting objects with similar heat signatures such as differentiating at long distance drones from
birds or light bulbs.
    To leverage the advantages of each sensor, our proposed solution combines images captured from RGB and
LWIR cameras to train a machine learning model for the detection of sUAS. Our main contribution is the
insight of utilizing the heightened background contrast from the LWIR sensor combined and synchronized with
the relatively increased resolution of the RGB sensor to train a deep learning model to detect sUAS through
previously difficult environments. More specifically, the approach demonstrated effective detection of multiple
sUAS flying above and below the treeline, in the presence of heat sources, and glare from the sun.

                                            2. RELATED WORK
For large unmanned aerial systems (UAS) detection, the majority of techniques use radar imaging.4–9 However,
the size and speed of small unmanned aerial systems (sUAS) present challenges for radar detection, which must
be able to scan a large area with discrimination to prevent false alarms from birds and moving ground objects.10
Deep learning techniques have been developed to help detect and classify sUAS by recognizing patterns in the
Doppler signature of micro UAS.11 However, the confidence with which these systems can be practically employed
for counter-sUAS is still up for debate.
    Image-based sUAS detection provides another solution for the detection of sUAS. Visual sensors have been
used to track targets moving over complex backgrounds.12 In addition, temporal information from subsequent
images can be supplemented to make the tracking robust to when the background or target object is changing
in appearance.13 Detection of sUAS with visual sensors can even be employed when the sensors themselves are
moving (for example, when onboard another sUAS14 ). Image processing techniques such as feature detection and
corner detection can also be used to analyze an object or scene from two different positions and find features
that would correspond to a real-world 3D object or scene,15 offering an increased ability to classify the target
object.
    Fusing multi-modal sensor outputs such as RGB and infrared video streams are gaining prominence to detect
objects under changing environmental conditions. If one sensing modality is impaired in a particular condition,
other sensing modalities might not be affected. The fusion of sensor data for object detection is typically done in
any of these three phases: at the pixel level, at the feature level, or at the decision level. RGB and infrared sensor
data fused at a pixel level16 can then be segmented using either parametric17 techniques such as Gaussian Mixture
Model or non-parametric techniques such as kernel-based density estimators. A new non-parametric technique
based on codebook model18 has shown enhanced object detection performance16 when applied to pixel-level
fused data. The image segmentation accuracy as measured using the detection rate metric is considerably higher
for the fused data compared to RGB and infrared data separately.16 Moreover the processing time for fused
data was found to be less compared to the summation of the processing time required for RGB and infrared
data individually. The detection accuracy is shown to be further improved if we allow a context-aware, quality-
based fusion.19 Context sensitive indicators are introduced19 to weigh in the soft segmentation performed over
individual RGB and infrared data.
    More recently, machine learning approaches were developed to remove the necessity of hand-designing image
features and corners to, instead, learn these patterns automatically from large datasets. Simple Online and

                                                          2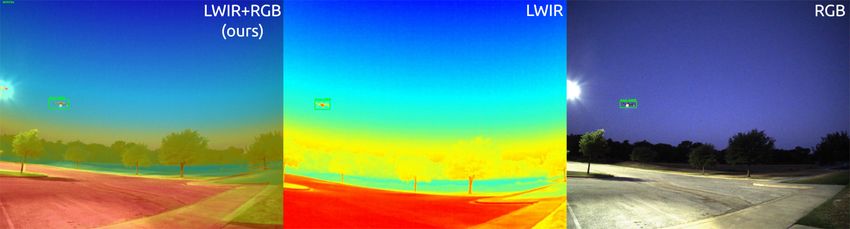
Realtime Tracking with a Deep Association Metric (Deep SORT)20, 21 trained a convolutional neural network
on a large-scale person identification dataset to learn an association metric for each target identified. Paired
with Kalman filtering in the image-space and frame-by-frame data association, this approach achieves favorable
performance when tracking objects for longer periods of time under occlusion. One of the most common ap-
proaches, You Only Look Once (YOLO),22–24 frames object detection as a regression problem where a neural
network predicts, in real time, bounding boxes and class probabilities directly from full images in only one evalu-
ation step. Improving upon YOLO, EfficientNet25 proposes the compound scaling method that uniformly scales
depth, width, and resolution of convolution neural networks following a fixed ratio to achieve state-of-the-art
object detection while using smaller and faster networks. Combined with machine learning, data from visual
sensors can be used to not only track sUAS26 but also distinguish them from birds13 and other background
objects. Our approach, detailed below, utilizes many of these advancements to provide a robust framework for
sUAS detection.
3. METHODS
This research work proposes combining the advantages of the LWIR and visible spectrum sensors using machine
learning for vision-based detection of sUAS. Due to the power and battery discharge rates required to fly small
unmanned quadrotors, these vehicles hold a characteristic heat signature when imaged with LWIR sensors that
contrasts with common cluttered backgrounds suck as buildings, trees, sky, and the terrain. The same does not
happen in the visible spectrum where changes in lighting and cluttered background can completely camouflage
a flying small unmanned quadrotor. Conversely, visible spectrum sensors are widely available in the market
and have higher resolution, which aids detection at long-ranges assuming that the vehicle contrasts with the
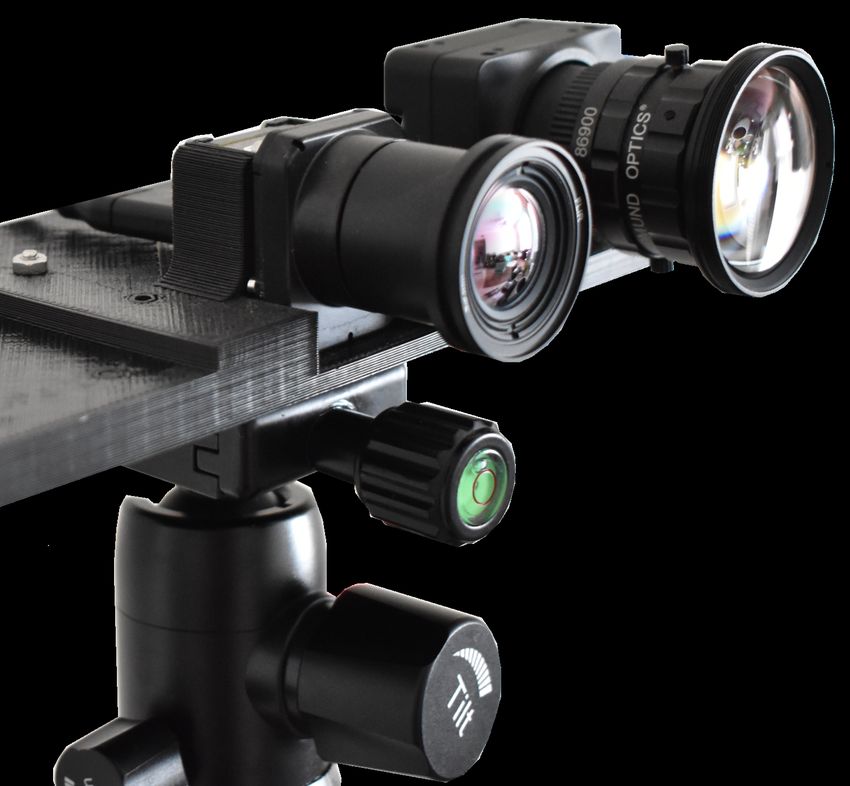
background. Our prototype, as seen in Figure 1a consists of two calibrated cameras aligned based on the
position of their image capture sensor and attached to a custom mount system that allows them to be attached
to a camera tripod. The cameras, from left to right, are a FLIR infrared camera BOSON 640 coupled with
4.9mm lens and a FLIR RGB camera CM3-U3-50S5C-CS Chameleon3 USB3 coupled with a 3.5mm C Series
fixed focal length lens. The camera specifications are shown in Table 1. All camera data was streamed and
recorded using ROS (Robot Operating System),27 synchronized to run at 30 Hz. A sample RGB and respective
LWIR frame demonstrating the data capture system can be seen in Figure 1b.
(a) (b)
Figure 1. (a) Picture of the mounted RGB and LWIR cameras used to capture data for this research work and (b) sample
RGB and its respective LWIR frame after synchronization and before fusion.
The data collection process consisted of imaging two different sUAS, DJI Mavic Pro and DJI Phantom 4,
while flying at different times of the day and weather conditions, such as during sunset and sunrise in a clear
sky or during the afternoon of a cloudy day, and under different lighting conditions in order to create a diverse
dataset to be used as training data for the machine learning model. A total of 30 minutes of data at 30 frames
per second were recorded for a total of 52800 frames for each camera, LWIR and RGB. From that, 1275 frames
in total were manually labeled by drawing a bounding box surrounding the vehicle. The main assumption during
3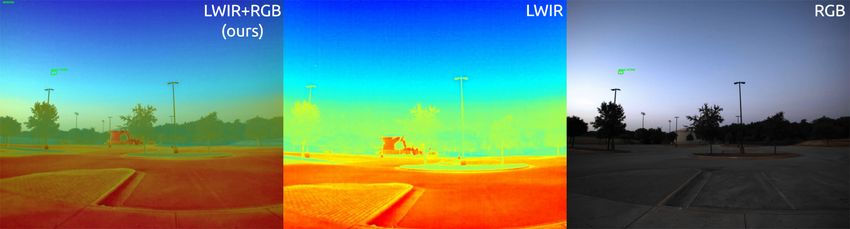
Table 1. Camera Specifications.
                                                               Camera Type
                   Specifications                           RGB                   Infrared
                   Model                       FLIR CM3-U3-50S5C-CS         FLIR BOSON 640
                   Lens focal length (mm)               3.5                       4.9
                   Frame Rate (Hz)                      35                        60
                   Resolution (pixels)              2448 × 2048                640 × 512
                   Sensor Type                        CMOS                       N/A
                   Sensor Format                       2/3”                      N/A
                   Thermal Sensitivity (mK)            N/A                       < 60

this process was that the person should label LWIR and RGB data independently so there is no information
leakage between one spectrum to another.
    To combine the calibrated and synchronized LWIR and RGB images, we first computed the homography
transformation from the LWIR to the RGB image frame so each pixel in the infrared spectrum could be associated
with one pixel in the visible spectrum. The pixels were combined by computing the equally weighted sum between
them so the resulting pixel carries information from both spectra. Figure 2 illustrates our proposed approach to
combined LWIR+RGB data in comparison to LWIR and RGB alone. The green box indicates that the machine
learning object detector has reached the desired level of confidence to identify a drone in that location, to be
explained in more detail in the following paragraphs.

Figure 2. Sample of frames illustrating our proposed approach (LWIR+RGB, leftmost image) compared to LWIR and
RGB alone to detect sUAS. The proposed method synchronizes and combines both LWIR and RGB images leveraging
the advantages of both sensors for object detection.

    In possession of a synchronized and annotated dataset of LWIR+RGB, LWIR, and RGB images, we trained
a machine learning model for drone detection for each separate dataset using YOLOv322–24 official implementa-
tion∗ . The LWIR and RGB models used their respective images and labels to train the YOLO object detector
while the LWIR+RGB model used the combined frames, as seen in the leftmost image of Figure 2, and all LWIR
and RGB labels. As illustrated in Figure 3, YOLO splits the input image in S ×S grid cells, predicting one object
and a fixed number of bounding boxes per cell using dimension clusters as anchor boxes.28 Each prediction of
a bounding box is accompanied by a box confidence score and each grid cell by a conditional class probability,
which, in our case, represents the probability of containing or not a drone. These scores are condensed with
a dot product in a final class confidence score that measures the confidence in both the classification (correct
class of containing or not a drone) and the localization of the object (coordinates of the corners of the bounding
box surrounding the drone). YOLO was initially designed to be used with RGB images but no modification
in the architecture was required since the LWIR+RGB frames still have 3 image channels, similar to an RGB
image. The same applies to the LWIR frames, displayed in colors, which also have 3 image channels. Due to
   ∗
       YOLOv3 on Github: https://github.com/pjreddie/darknet.

                                                        4
the modularity of this approach, it can be integrated into existing surveillance and camera systems capable of
recording LWIR and RGB data.

        Figure 3. Illustration of the YOLO method for object detection. Adapted from original YOLO diagram.23

                                    4. RESULTS AND DISCUSSION
The proposed approach is evaluated in four drone detection scenarios: drones crossing above and below the
horizon and treeline, drones flying in front of cameras pointed directly the sun during sunrise, drones flying
together with other heat sources such as public street lighting, and drone detection at approximately 300 meters
away, here called long-range since the sUAS is barely visible on the RGB spectrum and also to differentiate of
the previous cases where the vehicles were flying at less than 300 meters away. We compared our approach of
combining LWIR and RGB images and detecting drones using a custom trained YOLO model against the same
YOLO architecture but trained only using LWIR and RGB images alone. All YOLO models for the baselines
and the proposed method were trained on the same scenarios and using the same labels, only changing the input
video appropriately. Performance is computed in terms of Detection Rate (DR) and False Alarm Rate (FAR).18
DR is computed as the ratio between true positives and the sum of true positives (TP) and false negatives (FN),
as seen in Equation 1, and FAR is computed as the ratio between false positives (FP) and the sum of true and
false positives, as seen in Equation 2. Since YOLO is a probabilistic model, it outputs a confidence metric for
each object detected in the image frame. In this work, we evaluate the performance metrics DR and FAR for all
baselines and the proposed method for four confidence thresholds: 25, 50, 75, and 90%. Each specific condition is
measured, explained, and illustrated bellow and qualitative results can be seen in the complete prediction videos
for each condition shown in the project webpage† .

                                                          TP
                                                 DR =                                                           (1)
                                                        TP + FN

                                                           FP
                                                F AR =                                                          (2)
                                                         TP + FP
    Our first experiment, shown in Figure 4, has a drone crossing above and below the treeline and horizon. This
scenario is problematic for solutions that solely rely on the visible spectrum because of the drones low contrast
relative to the background. The infrared sensor, shown in the middle of Figure 4, has a significantly higher
  †
      Project page: https://sites.google.com/view/tamudrone-spie2020/.

                                                         5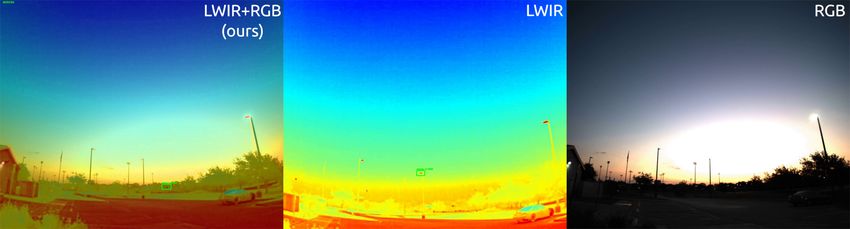
contrast compared to the RGB sensor, due to salient heat emission from the drone batteries and motors. This
allows the sensor to keep track of the drone even when it crosses above and below the skyline. In comparison, our
proposed method, LWIR+RGB, presents a better horizon contrast when compared to LWIR and RGB alone.

Figure 4. Frames illustrating our proposed approach (LWIR+RGB, leftmost image) compared to LWIR and RGB alone
to detect sUAS when it is not visible on the RGB spectrum as, for example, when flying below the horizon in front of
trees.

    Figure 5 illustrates our second experiment with the drone flying in front of cameras pointed directly at the
sun during sunrise. This is another scenario where the RGB sensor does not have enough contrast for the proper
detection of the sUAS. Using both the visible and infrared spectrum, our solution can detect the drone with much
less difficulty, while also rejecting the false positives that arise from purely relying on the infrared spectrum.

Figure 5. Frames illustrating our proposed approach (LWIR+RGB, leftmost image) compared to LWIR and RGB alone
to detect sUAS when it is not visible on the RGB spectrum as, for example, during sunrise when cameras are pointed to
the sun.

     Our third experiment, shown in Figure 6, illustrates the solutions robustness to other heat sources such as
public street lighting. This scenario is problematic for solutions that solely rely on the infrared spectrum because
of the similarities of drone’s and lamp’s heat signatures at low resolution. By combining both LWIR and RGB
images, our method is still capable to leverage the heat signature of the drone to improve detection but also
filters out light bulbs because they are clearly distinct from drones in the visible spectrum. In this scenario,
RGB alone still fails when the drones are below the horizon and in front of the trees.
   In our final experiment, shown in Figure 7, we demonstrate our proposed method capabilities detecting drones
when the sUAS is barely visible on the RGB spectrum, here called long-range to differentiate of the previous
cases where the vehicles were flying at less than 300 meters away. This scenario is challenging to LWIR alone
due to the reduced resolution and still challenging for RGB alone depending on how the drone contrasts with the
background. As before, our proposed method still presents higher performance metrics for being able to combine
both sensors, as explained in the following paragraph.
   Table 2 and 3 show the numerical results in terms of mean and standard deviation of Detection Rate (DR) and
False Alarm Rate (FAR), respectively for each table, averaging the metrics for all scenarios and also showing them

                                                         6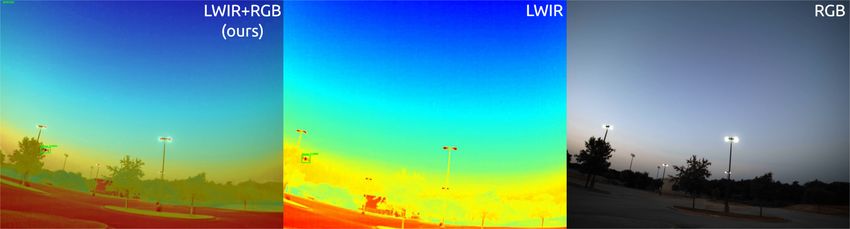
Figure 6. Frames illustrating our proposed approach (LWIR+RGB, leftmost image) compared to LWIR and RGB alone
to detect sUAS when objects with similar heat signatures to drones, such as lamps, are present in the image.

Figure 7. Frames illustrating our proposed approach (LWIR+RGB, leftmost image) compared to LWIR and RGB alone
to detect sUAS flying beyond 300 meters from the cameras, here defined as long-range since the sUAS is barely visible
on the RGB spectrum.

separately for cases where a single or multiple drones were flying at the same time, for all confidence threshold
(CT) conditions of the machine learning model output. In bold we highlighted the best performing method for
each condition, showing that our method outperforms the baselines 87.5% of the time. Improvements in the DR
ranges from 12.9 to 880.4% while the reduction in FAR ranges from -15.4 to -100.0%, depending on the scenario.
Overall, setting CT to 50% presents a good balance of DR and FAR for all conditions investigated. Qualitative
results can be seen in the complete prediction videos for each condition shown in the project webpage‡ .

                                              5. CONCLUSION
In this paper, we have demonstrated that using state-of-the-art deep learning algorithms for object detection
with the insight of combining long-wave infrared (LWIR) and visible spectrum (RGB) sensors can significantly
improve the detection of sUAS in previously difficult situations as, for example, when sUAS flies crossing above
and below the treeline and horizon line, in the presence of other heat sources, with cameras pointed directly
to the sun, and in long-range scenarios. We compared our approach of combining LWIR and RGB images and
detecting drones using a custom trained YOLO model against the same YOLO architecture but trained only
using LWIR and RGB images alone. Our approach achieved a detection rate of 71.2 ± 8.3%, improving by 69%
when compared to LWIR and by 30.4% when visible spectrum alone, and achieved false alarm rate of 2.7 ± 2.6%,
decreasing by 74.1% and by 47.1% when compared to LWIR and visible spectrum alone, respectively, on average,
for single and multiple drone scenarios, controlled for the same confidence metric of the machine learning object
detector of at least 50%. We believe that the further development of this technology has serious benefits to the
area of counter-sUAS and can supplement existing technology in practical applications and enable counter-sUAS
systems to operate in a 24/7 continuous regime and prevent malicious use of the sUAS.
   ‡
       Project page: https://sites.google.com/view/tamudrone-spie2020/.

                                                         7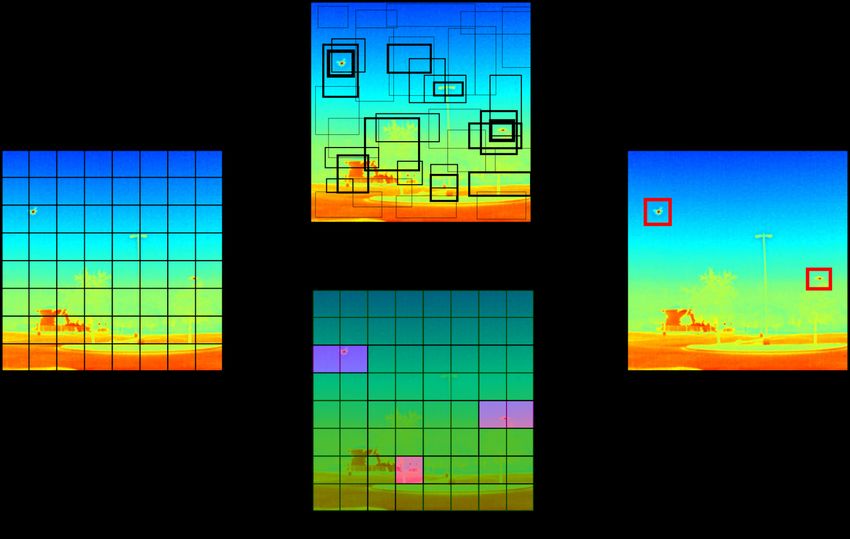
Table 2. Detection Rate (DR) of our proposed method combining LWIR and visible spectrum imagery (LWIR+RGB)
compared to using LWIR and the visible spectrum (RGB) alone. Results, in terms of the mean and standard deviation
(SD), were computed for different scenarios containing single and multiple drones in the field of view of the cameras.
Results are also controlled for the confidence threshold (CT) used to filter the outputs of the machine learning model.
The “LWIR+RGB Variation” columns quantifies the difference between the baseline and our proposed method.
                            LWIR+RGB
                     CT                                       LWIR                                 RGB
     Condition                (Ours)
                     (%)
                                                                    LWIR+RGB                             LWIR+RGB
                              Mean ± SD          Mean ± SD                           Mean ± SD
                                                                     Variation                            Variation
                      25     0.821± 0.067       0.617   ±   0.489     33.0%         0.633 ± 0.144          29.6%
                      50     0.712± 0.083       0.421   ±   0.374     69.0%         0.546 ± 0.151          30.4%
    Combined
                      75      0.522± 0.1        0.279   ±   0.249     86.7%         0.402 ± 0.136          29.7%
                      90     0.279± 0.161       0.137   ±   0.137     103.0%         0.2 ± 0.131           39.8%
                      25      0.849± 0.076     0.973 ± 0.024           -12.8%        0.644 ± 0.2           31.8%
    Single            50      0.742± 0.1        0.657 ± 0.266          12.9%         0.578 ± 0.2           28.3%
    Drone             75      0.57± 0.093        0.43 ± 0.196          32.4%        0.436 ± 0.159          30.7%
                      90     0.385± 0.066       0.203 ± 0.146          89.9%        0.276 ± 0.109          39.5%
                      25     0.778±   0.025      0.082 ± 0.05         842.6%        0.616    ±   0.042     26.2%
    Multiple          50     0.667±   0.029     0.068 ± 0.044         880.4%        0.498    ±   0.061     34.0%
    Drones            75     0.449±   0.069     0.052 ± 0.036         751.2%        0.351    ±   0.124     27.7%
                      90     0.121±   0.104      0.04 ± 0.026         202.9%        0.085    ±   0.035     41.3%

Table 3. False Alarm Rate (FAR) of our proposed method combining LWIR and visible spectrum imagery
(LWIR+RGB) compared to using LWIR and the visible spectrum (RGB) alone. Results, in terms of mean and standard
deviation (SD), were computed for different scenarios containing single and multiple drones in the field of view of the
cameras. Results are also controlled for the confidence threshold (CT) used to filter the outputs of the machine learning
model. The “LWIR+RGB Variation” columns quantifies the difference between the baseline and our proposed method.
                           LWIR+RGB
                    CT                                        LWIR                                 RGB
    Condition                (Ours)
                    (%)
                                                                    LWIR+RGB                             LWIR+RGB
                             Mean ± SD           Mean ± SD                            Mean ± SD
                                                                     Variation                            Variation
                     25    0.059 ± 0.043        0.18 ± 0.124         -66.7%           0.08 ± 0.047         -25.4%
                     50    0.027 ± 0.026        0.107 ± 0.075        -74.1%          0.052 ± 0.041         -47.1%
   Combined
                     75    0.009 ± 0.009        0.062 ± 0.065        -85.1%           0.026 ± 0.03         -64.4%
                     90      0 ± 0.001          0.031 ± 0.031        -97.2%          0.018 ± 0.025         -95.2%
                     25    0.041 ± 0.04         0.248 ± 0.106        -83.2%          0.049   ±   0.028     -15.4%
   Single            50    0.018 ± 0.025        0.135 ± 0.077        -86.2%          0.023   ±   0.014     -19.4%
   Drone             75     0.006 ± 0.009       0.073 ± 0.083         -90.9%        0.004    ±   0.002      46.3%
                     90    0.001 ± 0.002         0.032 ± 0.04        -95.6%          0.001   ±   0.002     -25.2%
                     25     0.087 ± 0.043      0.077 ± 0.063           12.3%         0.126   ±   0.019       -31.2%
   Multiple          50    0.041 ± 0.029        0.065 ± 0.068         -36.5%         0.096   ±   0.013      -57.1%
   Drones            75    0.013 ± 0.01         0.047 ± 0.05          -71.6%         0.058   ±   0.007      -77.3%
                     90         0±0             0.029 ± 0.027        -100.0%         0.042   ±   0.026     -100.0%

                                                             8
6. LIMITATIONS AND FUTURE WORK
There are still some inherent limitations to the vision-based approaches for object detection. One of those limi-
tations stems from scenarios where the drone is indistinguishable from objects with similar visual characteristics
and heat signatures. Although the multi-modal approach mitigated this issue, the system had difficulty distin-
guishing the drone from the birds during long-range detection since both objects have a similar heat signatures
at low resolution. Besides using higher-resolution sensors and collecting more training data, one avenue we are
exploring to further mitigate this limitation uses a filtering algorithm, like Deep SORT,20 to track drones and
other objects over the individual frames. From there, each object’s flight characteristics are used as another
input for detection and provide a more educated estimate for indiscernible heat signatures. In combination with
other sensor modalities like a radar and spectrum analyzer, the solution presented could offer an accurate and
robust solution to sUAS detection.
ACKNOWLEDGMENTS
The authors would like to thank every other participant of the “A-Team”, winning team of the A-Hack-of-the-
Drones 2018, where this project started: Edan Coben, Emily Fojtik, Garrett Jares, Humberto Ramos, Nicholas
Waytowich, Niladri Das, Sunsoo Kim, Vedang Deshpande, Venkata Tadiparthi, and Vernon Lawhern; Texas A&M
University Professors: Dr. Daniel Ragsdale, Dr. John Hurtado, and Dr. Raktim Bhattacharya, for supporting
the students in the event; Rodney Boehm from Texas A&M University Engineering Entrepreneurship program
for supporting the work after the event; and MD5 and Army Future Commands for sponsoring the event and
following up with the team to continue the work after the hackathon.
REFERENCES
[1] “DJI drones.” https://www.dji.com/ (2006). Accessed: 2020-03-20.
[2] “Parrot Drones.” https://www.parrot.com/us/drones (1994). Accessed: 2020-03-20.
[3] “Autel Robotics.” https://auteldrones.com/collections/drones (2015). Accessed: 2020-03-20.
[4] Moffatt, D. and Mains, R., “Detection and discrimination of radar targets,” IEEE Transactions on Antennas
and Propagation 23(3), 358–367 (1975).
[5] Bullard, B. D. and Dowdy, P. C., “Pulse doppler signature of a rotary-wing aircraft,” IEEE Aerospace and
Electronic Systems Magazine 6(5), 28–30 (1991).
[6] Khan, R., Gamberg, B., Power, D., Walsh, J., Dawe, B., Pearson, W., and Millan, D., “Target detection and
tracking with a high frequency ground wave radar,” IEEE Journal of Oceanic Engineering 19(4), 540–548
(1994).
[7] Khan, R. H. and Power, D., “Aircraft detection and tracking with high frequency radar,” in [Proceedings
International Radar Conference ], 44–48, IEEE (1995).
[8] Headrick, J. and Thomason, J., “Applications of high-frequency radar,” Radio Science 33(4), 1045–1054
(1998).
[9] Brown, J., Woodbridge, K., Stove, A., and Watts, S., “Air target detection using airborne passive bistatic
radar,” Electronics letters 46(20), 1396–1397 (2010).
[10] Poitevin, P., Pelletier, M., and Lamontagne, P., “Challenges in detecting uas with radar,” in [2017 Inter-
national Carnahan Conference on Security Technology (ICCST)], 1–6, IEEE (2017).
[11] Mendis, G. J., Randeny, T., Wei, J., and Madanayake, A., “Deep learning based doppler radar for micro
uas detection and classification,” in [MILCOM 2016-2016 IEEE Military Communications Conference],
924–929, IEEE (2016).
[12] Rozantsev, A., Lepetit, V., and Fua, P., “Detecting flying objects using a single moving camera,” IEEE
transactions on pattern analysis and machine intelligence 39(5), 879–892 (2016).
[13] Aker, C. and Kalkan, S., “Using deep networks for drone detection,” in [2017 14th IEEE International
Conference on Advanced Video and Signal Based Surveillance (AVSS) ], 1–6, IEEE (2017).
[14] Opromolla, R., Fasano, G., and Accardo, D., “A vision-based approach to uav detection and tracking in
cooperative applications,” Sensors 18(10), 3391 (2018).
9[15] Rosten, E. and Drummond, T., “Machine learning for high-speed corner detection,” in [European conference
on computer vision ], 430–443, Springer (2006).
[16] St-Laurent, L., Maldague, X., and Prevost, D., “Combination of colour and thermal sensors for enhanced
object detection,” in [2007 10th International Conference on Information Fusion], IEEE (jul 2007).
[17] Stauffer, C. and Grimson, W., “Adaptive background mixture models for real-time tracking,” in [Pro-
ceedings. 1999 IEEE Computer Society Conference on Computer Vision and Pattern Recognition (Cat. No
PR00149) ], IEEE Comput. Soc (1999).
[18] Kim, K., Chalidabhongse, T. H., Harwood, D., and Davis, L., “Real-time foreground–background segmen-
tation using codebook model,” Real-Time Imaging 11, 172–185 (jun 2005).
[19] Alldieck, T., Bahnsen, C., and Moeslund, T., “Context-aware fusion of RGB and thermal imagery for traffic
monitoring,” Sensors 16, 1947 (nov 2016).
[20] Bewley, A., Ge, Z., Ott, L., Ramos, F., and Upcroft, B., “Simple online and realtime tracking,” in [2016
IEEE International Conference on Image Processing (ICIP)], 3464–3468 (2016).
[21] Wojke, N., Bewley, A., and Paulus, D., “Simple online and realtime tracking with a deep association metric,”
CoRR abs/1703.07402 (2017).
[22] Redmon, J., “Darknet: Open source neural networks in c.” http://pjreddie.com/darknet/ (2013–2016).
[23] Redmon, J., Divvala, S., Girshick, R., and Farhadi, A., “You only look once: Unified, real-time object
detection,” in [Proceedings of the IEEE conference on computer vision and pattern recognition ], 779–788
(2016).
[24] Redmon, J. and Farhadi, A., “Yolov3: An incremental improvement,” (2018).
[25] Tan, M. and Le, Q. V., “Efficientnet: Rethinking model scaling for convolutional neural networks,”
CoRR abs/1905.11946 (2019).
[26] Wang, N. and Yeung, D.-Y., “Learning a deep compact image representation for visual tracking,” in [Ad-
vances in neural information processing systems], 809–817 (2013).
[27] Quigley, M., Conley, K., Gerkey, B., Faust, J., Foote, T., Leibs, J., Wheeler, R., and Ng, A. Y., “Ros: an
open-source robot operating system,” in [ICRA workshop on open source software ], 3(3.2), 5, Kobe, Japan
(2009).
[28] Redmon, J. and Farhadi, A., “Yolo9000: better, faster, stronger,” in [Proceedings of the IEEE conference
on computer vision and pattern recognition ], 7263–7271 (2017).
10You can also read