INFRASTRUCTURE EVIDENCE BASE - Urban Water February 2014 - NZ Treasury
←
→
Page content transcription
If your browser does not render page correctly, please read the page content below
INFRASTRUCTURE
EVIDENCE BASE
Urban Water

February 2014

                For more information visit: www.infrastructure.govt.nz
EVIDENCE BASE: URBAN WATER
EVIDENCE
BASE
Urban Water                                                                                                                         February 2014

Introduction
Infrastructure is a crucial part of the New Zealand economy. It supports the day to day activities of New Zealanders, helps to improve
living standards for all, and can be a driver for economic growth. As such, it is vital it is managed as well as possible. The National
Infrastructure Plan 2011 sets out a long term vision for New Zealand’s infrastructure and seeks to provide a common direction for how
we plan, fund, build and use all economic and social infrastructure.

                                                                       By 2030 New Zealand’s infrastructure is resilient, coordinated and
                                                          Vision

                                                                          contributes to economic growth and increased quality of life
                                                          Outcomes

                                                                        Better use of existing                  Better allocation of new
                                                                           infrastructure                             investment

                                                                         Investment analysis                 Accountability / Performance
                                                          Principles

                                                                              Resilience                               Regulation

                                                                         Funding mechanisms                          Coordination

A significant constraint identified in the National Infrastructure Plan 2011 was the lack of information about asset condition and
performance to allow more informed decisions and efficient and effective investment. A key part of the National Infrastructure Unit’s
(NIU) work programme over the past two years has been to develop a more robust Evidence Base to address this constraint. In
particular, publishing the Evidence Base enables a discussion identifying the significant issues for New Zealand infrastructure and
options to respond to these. Discussion of these will underpin the NIU’s work programme over 2014, through to the release of the next
National Infrastructure Plan in 2015.

The Evidence Base draws together work on performance indicators (the current state of the infrastructure), scenario and trend analysis
(the future pressures or drivers of demand), the national resilience picture, and the first 10-year Capital Intentions Plan (what is known
about indicative future spend).

This document forms the substantive component of the Evidence Base for the Urban Water sector, which the NIU defines as the 3-
Waters: drinking water, wastewater and storm water. Key assets within this sector include pipelines, water treatment plants,
wastewater treatment plants, tanks and reservoirs, and pumping stations. It follows from the overview document, which can be found
on the NIU’s website. It draws information from the performance indicators, scenario and trend analysis, and resilience assessment.

This narrative does not include flood protection. The NIU recognises the importance of flood protection systems for much of our other
infrastructure sectors and urban environments and the significant cost of these to regional councils. In collating this first Evidence
Base, the focus has been on the 3-Waters. We expect that future iterations will include flood water protection.

Where data has been provided, this is publically available information, and has been provided with permission of the information owner.

                                                                                      For more information visit: www.infrastructure.govt.nz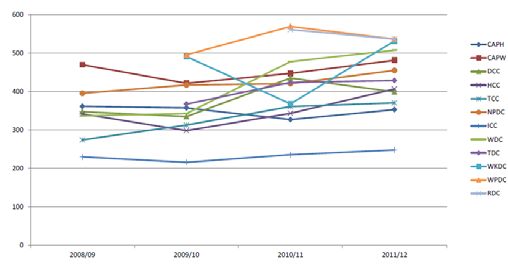
EVIDENCE BASE: URBAN WATER

Overview messages
The infrastructure for the 3-Waters is a key economic enabler: a precursor for any significant residential, industrial or commercial
development and a key input for any agricultural, processing or manufacturing enterprise.
                                                                          1
The 3-Waters has a large asset base, with approximately 66% of costs fixed and significant levels of expenditure are planned over the
next 10 years, including 1,016 projects (excluding those under $1m) totaling over $11 billion. Expenditure is driven by growth,
renewals and requirements to meet new standards (Levels of Service).

Networks continue to operate without widespread service failures. There is some concern, however, that the now aging infrastructure
and increasing levels of reported asset deterioration have the potential to influence future circumstances.

The sector is characterised by a large number of providers, managing a large number of network assets with a wide geographic
spread, heavily influenced by topography and natural features (drinking water sources and discharge options). Two distinct patterns are
emerging: one of larger urban areas with higher capacity, capability and rating base which are often growing; and one of smaller
provincial areas with a static/declining population and rating base leading to lower capacity and capability.

There are varying levels of asset management maturity and understanding of asset condition across both larger and smaller areas, and
no consistent national data framework or asset data standards, such as formats, definitions, analytics, or benchmarks. The
International Infrastructure Management Manual provides detailed asset management guidance but application is variable.

The increasing focus on water, especially quality considerations, and the nature of the increasing demands imposed on the 3-Waters
suggests the asset planning environment, including the analytics that support it, requires an increasing level of maturity that will test all
Councils.

In addition, increasing consent requirements, particularly for wastewater and stormwater, are driving up costs and raising affordability
questions for smaller/provincial local authorities.

Finally, the key future driver of demand for Urban Water infrastructure is population growth. Current trends suggest a group of
Councils needing to optimize their 3-Waters networks to cater for growth, and a second group of Councils facing a static or reducing
rate payer base and the challenge of meeting future renewals and levels of service from this.

Context
As originally explained in the 2010 National Infrastructure Plan, early settlers relied on wells, springs, streams and rainfall to supply
their water needs. As towns grew, the local councils (or boards) and other entities initially assumed responsibility for providing a
continuous supply, followed by a reticulated water supply direct to households and businesses. Over time, this has meant that local
government now has the responsibility for supplying reticulated water to approximately 85% of people who are on such water systems.

Like drinking water, the disposal of wastewater in urban and built-up areas is primarily the responsibility of local authorities. Councils
assumed this responsibility for similar public health, environmental and service delivery reasons. Management and asset planning
considerations are also similar between the two types of networks, as are issues related to access to consistent information about the
assets.

Water and water disposal systems represent key urban amenities that contribute to the health and wellbeing of the population in both
rural and urban settings. In New Zealand, the regional variation in topography and water resource means that these systems are best
managed at a local or regional level rather than centrally. Wastewater and many water systems are generally not interconnected
across the country, although some areas may share treatment facilities. Each reticulated system has assets to collect untreated
wastewater from customers and transport it to facilities for the treatment and disposal of wastewater effluent, which includes liquid,
solids and gas.

1
    2009 estimate of 3-Waters asset base, worth approximately $33 billion.

                                                                                                                                   2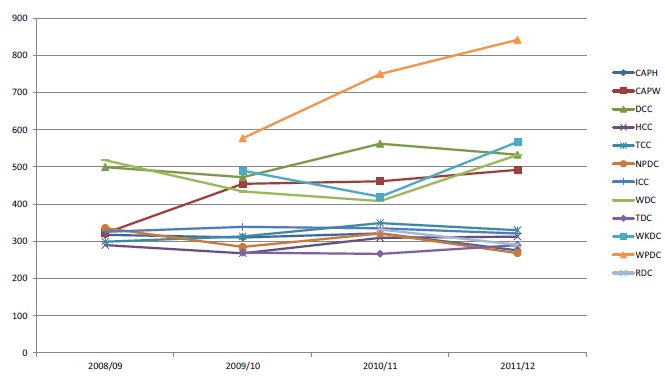
EVIDENCE BASE: URBAN WATER
Similarly, councils have responsibility for stormwater, drainage and flood protection systems, many of which started as individual
systems under the control of separate boards or committees.
A significant driver of investment over recent times has been the requirement for water supplies, where practicable, to meet the
requirements of the Drinking-water Standards for New Zealand and the requirements of the Health Act 1956 (as amended in 2007) and
have approved Public Health Management Plans.
What do we have?
The total value of water, wastewater and stormwater assets under local government control is estimated to be approximately $33 billion
2
(2009 figure).
Estimated replacement costs
Water Wastewater Stormwater
$11.4b $12.7b $8.9b
Source: Department of Internal Affairs
Is it where it needs to be?
The infrastructure for the 3-Waters is a precursor to significant residential, industrial or commercial development. The infrastructure is
typically laid or built in the early stages of development. There are exceptions with some residential communities operating without
reticulated networks, typically smaller and/or isolated communities, relying on rain tanks and/or on-site sewerage systems such as
septic tanks.
The more notable issues with location are:
Where populations have grown beyond the levels able to be supplied by the existing drinking water sources. In these cases further
development may be restricted, there may be water restrictions regularly applied, or significant costs may be needed to increase
supply.
Where wider externalities and factors have changed over time and the current location or type of infrastructure provided is no longer
suitable. In particular, for wastewater and changed discharge requirements.
A number of economic pressures in regards to demands on potable water, particularly in the rural communities. Potable water
supplies are coming under increasing pressure to meet the demands of other economic uses / users (e.g. farming, horticulture etc).
What quality is it?
The Ministry of Health 2013 Annual Report on Drinking-water Quality 2011-2012 reports on drinking-water quality for all registered
community drinking-water supplies that served populations of more than 100 people from 1 July 2011 to 30 June 2012. This reports
that only 76.7% of the reticulated population achieved full compliance with bacteriological, protozoal and chemical standards, although
some non-compliance is technical in nature rather than having to do with water quality.
2
Optimised Replacement Cost – from Department of Internal Affairs: Local Government Information Series 2009/19 – Information on
local government water network infrastructure.
3EVIDENCE BASE: URBAN WATER
POPULATION COUNTS (000'S) PERCENTAGE OF POPULATION
Large Medium Minor Small Total Large Medium Minor Small Total
Total Population 2992 268 464 82 3807
Bacteriological compliance 2947 237 409 56 3684 98 88 88 68 96
Protozoal compliance 2694 140 187 19 3039 90 52 40 23 80
Chemical compliance 2890 242 431 81 3645 97 90 93 99 96
Overall compliance 2611 116 176 17 2920 87 43 38 20 77
NB: Population figures are rounded to the nearest thousand. As a result of rounding, figures may not add up to totals shown.
In terms of asset condition, a significant portion of assets included in
the available case studies and reports are assessed as “poor asset
condition”.
Water NZ reports 7 of 16 had at least 20% of water pipework rated as
condition grade 4 (poor) and 5 (very poor) with a further 4 not collecting
data. What is not clear from this data is the link to asset criticality.
The same report shows a similar story for wastewater with 6 of 16
having at least 20% of Wastewater mains rated as condition grade 4
(poor) and 5 (very poor) with a further 3 not collecting data.
SPM noted that reporting of asset condition was inconsistent through
the asset management plans, meaning attempts at confident
projections of the status of the asset stock would be of doubtful value.
AVERAGE REMAINING ASSET LIVES (YEARS)
Auckland Metropolitan Provincial Rural
Water Supply 44 40 36 32
Waste Water 47 42 30 48
Stormwater 84 35 65 36
A surrogate measure of condition may be inferred from the valuation data. The ratio (Remaining Life / Expected Life) gives a high level
view of the status of the total service group. On average the valuation judgement is that assets are in general less than half way
through their expected lives. However, this needs to be interpreted with a note of caution as the quality and confidence in the
underlying data on which the calculations are based is variable and generally low.
HIGH-LEVEL VIEW OF ASSET CONDITION % (RATION: REMAINING
LIFE/EXPECTED LIFE)
Auckland Metropolitan Provincial Rural
Average 66 61 58 49
Stormwater appears to be the least well understood – both the MWH and Water NZ report either a high number of non-assessments or
a low confidence in the data. This may be a reflection of the younger stormwater network and a focus of Councils more recently on
water and wastewater.
4EVIDENCE BASE: URBAN WATER
What capacity is it at?
The estimated capacity of the surveyed water supply systems totals 668 million cubic metres per annum. The capacity utilisation rates
range from 22% to 92% and average 56%. This is the average utilisation over the year. However, there are seasonal peaks for both
3
water supply and water demand.
Unplanned interruptions per 1000 serviced properties
Little information has been found on capacity on individual plants or rd
(excl. 3 party)
schemes, although 100% adequacy of supply was reported by large,
medium and minor zones. Water supplies to 96.3% (79,100 people)
of the population in 95.4% (291) of the small supply zones reported
adequacy of supply.
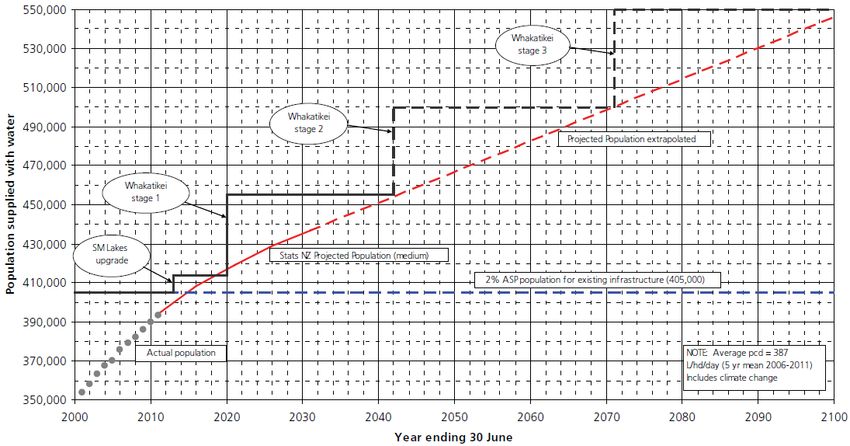
The 2012 WaterNZ report shows variable trends for unplanned
interruptions with five providers increasing trend and six a decreasing
trend.
There are encouraging signs from the PWC/GHD pilot of 2011/12
with eight of nine providers having sufficient KPIs to provide a general
measure of performance (an ‘amber’ rating) - however, only four of
the nine achieved a 'green' rating. Source: Water NZ 2012 Annual Report
Achieving a ‘green’ rating required 8-25 KPIs and in general enabled an assessment of performance - at least 5 KPIs across: water
leakage, water quality, sewer overflows, service interruptions, customer service, cost recovery.
The Water NZ report on Wastewater Treatment Plant Capacity currently utilised indicates sufficient headroom for the majority but 5 of
16 (31%) are at 80% capacity or over - New Plymouth District Council, Rotorua District Council, Waikato District Council, Taupo District
Council, South Taranaki District Council. Noting that Plant capacity is only one part of the network and pipe capacity for example, is
also a key determinant.
Resilience
A key point when considering resilience is the importance of overlaying the
objective data with subjective intelligence due to the interdependencies with other
infrastructure sectors and the particular geographic features of each locality or
region eg. Christchurch with 160 wells is in a very different situation than
Wellington City with one main pipeline into the City that crosses a major fault in
several places.
In the table to the right resilience expectations from a national perspective are
identified as low medium or high. When making these judgements a wide range of
aspects require consideration. To demonstrate; under Urban Water “City mains”
generally have a very high economic and social value associated with them. A high
level of resilience expectation is therefore attributed to them. An assessed
resilience of medium reflects the significant vulnerabilities of some of these routes
both from limited options and ability to withstand hazards such as earthquakes. In
contrast “Private laterals” have a low resilience expectation in part due to the
relatively low economic value associated with them and also the relative ease of
remediation. “Private laterals” are also a good example of level of resilience being
3
2004 Ministry of Economic Development Stocktake. Available at:
http://www.med.govt.nz/templates/MultipageDocumentPage9031.aspx?&MSHiC=65001&L=0&W=water+infrastructure&Pre=%3cb
%3e&Post=%3c%2fb%3e
5EVIDENCE BASE: URBAN WATER
dependent on your perspective; if your residence or building is dependent on a particular lateral you are likely to expect a high level of
resilience and in many cases this probably exists.
In addition to the NIU assessment, PWC/GHD identified six metrics to assess for resilience, shown in the table below. Overall for the
Resilience principle, 2 of the 9 providers rated green with the other 7 rated amber. Vulnerability assessments rated the lowest - 2
green, 5 amber, 2 red (recognising that high vulnerability in itself does not mean low resilience).
Water NZ reported on reservoir days of supply: the average across the 16 providers is 2.05 days with a median of 1.8 and a range of 0
- 5.1 days.
What are we spending?
Water
Real capital expenditure on water for councils in the rest of New Zealand is
forecast to decrease over time. Renewals makes up 50% of projected spend,
gradually increasing over time. Most change is due to decreasing expenditure
on improvements to levels of service from 28% of annual expenditure in 2013,
to 17% in 2022.
Capital expenditure on water in Auckland is uneven with most capital being
spent on increased demand (40%) followed by renewals (35%). The amount
spent on renewals increases from $41 million in 2013 to $77 million in 2022.
Wastewater
For councils in the rest of New Zealand, there is a period of significant
expenditure on sewage in the early years of the LTP, gradually decreasing
before increasing again in 2021. As renewals remain stable (44% of the total),
the increased expenditure in the early years is being driven by both
improvements to levels of service, and to cater for increased demand.
In Auckland, capital expenditure on sewage will increase steadily and
significantly over the next ten years, from $127 million in 2013 to $322 million
in 2022. Increased demand makes up 43% of the total forecast spend with
renewals next at 31%.
Source: DIA analysis of Council LTPs 2012 - 2022
6EVIDENCE BASE: URBAN WATER
Stormwater
Spend on stormwater assets comprises 4% of total capital expenditure for Auckland, and 5% for councils in the rest of New Zealand.
Councils in the rest of New Zealand will gradually reduce their capital expenditure on stormwater. Most expenditure will be for
improvements to levels of service (49%), suggesting councils may be addressing capacity issues with their existing stormwater
systems. Sector feedback suggests that as stormwater networks tend to be younger the longer term picture will be for increasing
capex as renewals are due.
Capital expenditure on stormwater in Auckland is set to peak in 2015 and 2016, and again in 2022. Over time the proportion of
expenditure on improved levels of service will increase from 36% in 2013, to 44% in 2022.
There are significant levels of expenditure planned over the next 10 years: 1,016 projects (excluding those under $1m) totaling over
$11 billion. The drivers for expenditure are very different, depending on whether the Local authorities are projected to grow or not.
High growth (%) Minimal growth (%) Negative growth (%)
Renewals 48 59 71
Levels of Service 30 30 23
Demand 23 11 7
How productive is it?
The data to determine productivity is not immediately obvious or Water Supply: Total Cost per Serviced Property ($pa)
available. Some insight can be gleaned from looking at the costs.
The Water NZ report identifies a wide variation of unit cost of water
delivery - range from $0.65 to $1.65 - Median of $0.89 and mean of
$1.05.
Perhaps more significantly, the trend data over last four years shows
little movement in price.
SPM reports the cost of production varies from $0.62 / m3 to $3.40 /
m3 with an average range of $0.70 for rural to $1.25 for Auckland.
SPM also notes that a number of communities in New Zealand are
blessed with aquifers that deliver high quality water into the supply
networks without the need for treatment. Others require extensive
Wastewater: Total Cost per Serviced Property ($pa)
headworks structures and treatment to meet demand and Drinking
Water standards.
For wastewater, Water NZ reports an even wider variation of unit cost
– a range from $0.51 to $3.67 - Median of $1.20 and mean of $1.55.
Trend data over last four years shows increasing unit cost - likely to
relate to widespread upgrade programme that has been underway.
The flipside is a look at water loss - 25% of the 16 providers meet
4
suggested international benchmark . Prima facie, this suggests
significant wastage and loss of productivity.
4
Infrastructure Leakage Index (ILI). Industry standard for water loss assessment is Benchloss, evaluating Current Annual Real Loss
and comparing this with Unavoidable Annual Real Loss to provide ILI. Water NZ suggest international experience is that network
losses are being effectively managed if ILIEVIDENCE BASE: URBAN WATER
COST OF PRODUCTION (WATER SUPPLY) $PER METER CUBED
Sector Auckland Metropolitan Provincial Rural
Average 1.25 1.15 1.2 0.07
How well are we managing it?
Fundamental to managing long-life infrastructure assets is having
% of Assets with Regular Condition Assessments, by
mature asset management practices that reflect the scale and scope of
Type of Asset
each service provider. The reports reviewed show a number of
providers not collecting data or having a low level of confidence in the
data being collected on the assets.
The 2013 OAG report identified that stormwater, water supply and
waste water assets were all assessed less than the overall average
across public sector assets.
Only 4 of 9 providers participating in the PWC/GHD-led pilot rated a
'green' for condition assessments (the criteria for a 'green' rating is
done at least 3 yearly, reflected in LTP for all critical assets and a
sample of others).
Adding to this picture, OAG reports that "Based on the information we
collected, maintenance and renewal plans are being followed for about
40% of assets, and those plans influenced the work carried out to some
extent for a further 53%" (OAG 2013 4.5) Source: OAG 2013
Further, there was a lack of regular reporting to governing bodies with less than 60 of local government decision makers receiving
regular asset condition information (OAG 2013 5.10). The same pattern emerges when looking at investment analysis. The PWC/GHD
pilot developed seven metrics to asses investment analysis. Results show room for improvement. Stronger areas were AMP revisions
(6 of 9 rated green) and Basis of replacement decisions (7 of 9 rated green). Weakest areas were Ownership structure consideration
(6 red, 3 amber), Demand forecasting process (8 amber, 1 green) and Cost & benefits included (3 green, 6 amber).
This was reinforced by the Better Local Government Infrastructure Efficiency Expert Advisory Group in their 2013 report with the
IEEAG saying “On the part of councils, business case decisions need to be improved to ensure that appropriately scaled and targeted
solutions are delivered. Better asset management can also help achieve efficiencies and therefore contain costs."
8EVIDENCE BASE: URBAN WATER
The underlying quality of available data is also a concern with regards to forecasting, and means little meaningful insight can be drawn
at a national level. Consequently, we have focussed on other indicators such as whether forecasting is done, the quality of this and the
inclusion of both supply and demand management (DM) strategies to meet forecast demand.
The data reviewed suggests significant room for improvement. Local authorities typically included population changes, may have
considered demand management strategies but not quantified their potential impact, did not verify forecasts and overall, forecasting
would be considered minimum - intermediate standard.
OAG (2010) rated 5 of 8 providers forecasting as minimum standard with the other 3 at intermediate. They also noted the lack of
verification.
MWH identified the lack of quantification of the impact of other drivers of demand and that councils have not defined what they will
do to implement demand management strategies.
PWC/GHD rated only 1 of the 9 providers as 'green' – a ‘green’ rating requires detailed data, and forecasts internally consistent with
assumptions.
PWC/GHD also looked at more short term measure on the accuracy of actual v planned capex - with only 1 provider meeting the
'green' criteria – a ‘green’ rating = actual within 10% budget on average or in total over 3 years, and within 20% in each year.
Overall, the above paints a picture of a sector that can substantially improve asset management practices, the quality of information
collected and reported to governing bodies, and the use that is made of this information.
What future trends and scenarios may impact urban water infrastructure?
As part of the development of the Evidence Base for New Zealand’s infrastructure, the NIU has undertaken an investigation into future
pressures placing demand on our infrastructure for a range of plausible scenarios: a central scenario (best estimate of future
5
infrastructure demand), an upside scenario (high infrastructure demand) and a downside scenario (low infrastructure demand) . The
results of this investigation have been published in a separate document available on the NIU website, but relevant extracts for the
Urban Water sector are reproduced below.
Auckland Regional Water Demand
Implications for urban water infrastructure in the central scenario
At present, the availability of data, projections and modelling for our
6
water infrastructure is inconsistent and fragmented . Accordingly, it is
difficult to develop an informed view of future infrastructure
requirements at a regional and national level. Instead, we focus on
readily available indicators of future demand such as demand for water
in Auckland and Wellington.
With both high population growth and relatively modest water resource
availability, Auckland makes a good case study for understanding the
substantial investment in urban water infrastructure that may be
required in the absence of other solutions. Watercare’s most recent
demand management plan (right) demonstrates the scale of the
Source: Watercare 2013
5
Each scenario has an associated set of projections of future infrastructure demand. The NIU has not produced any new models or
forecasts in this regard. Rather, we rely upon existing sector data and forecasts where applicable and relevant.
6
Local authorities are taking steps toward improvement in this regard (e.g. LGNZ 3 Waters project and the establishment of a Centre
of Excellence).
9EVIDENCE BASE: URBAN WATER
challenge. Across the country, both the level of demand and the ability to pay for the required investment will be dependent on
population, which in this scenario suggests challenges for both rural and urban centres as population migrates from one to the other.
Apart from water demand, the urban water sector also faces pressure to ensure water quality meets acceptable standards – both for
potable supply and for the discharge of wastewater and stormwater to the receiving environment. For wastewater discharge quality, the
government is currently investigating a number of reforms related to fresh water management. The level of investment that may be
required will be dependent, in part, on the level of standards to be met (and by the existing water quality outcomes being achieved).
Implications for urban water infrastructure in the upside scenario
The upside scenario assumes that climate change will occur more rapidly than IPCC projections. From a spatial perspective, this
impacts coastal areas where our assets begin to deteriorate more rapidly and low-lying communities (and their infrastructure networks)
are threatened. Moving inland, higher rainfall in the west of country brings both benefits and risks, while less rainfall in the east may
magnify water scarcity in areas such as Canterbury.
Population growth will also create urban water infrastructure demand in the upside scenario. Taking Auckland as an example, the Stats
NZ high population for the Auckland region by 2031 is nearly 8% above the medium projection. Although this may seem small at face
value, the impact from a variation of this size cannot be underestimated – particularly when the development of new sources of supply
(or incentivising lower per capita demand) can be years in the making.
For example, Greater Wellington Water’s plan to ensure that sufficient capacity is available to meet demand is shown in the graph
below. In the event that population growth shifts from the Stats NZ medium projection to the high projection instead, augmentation of
the system may be required much earlier than planned.
Greater Wellington bulk water supply augmentation strategic plan
Source: Greater Wellington Water (Water Supply Asset Management Plan, 2012)
10EVIDENCE BASE: URBAN WATER
Implications for urban water infrastructure in the downside scenario
As with the other scenarios, the effect of the downside scenario on our urban water sector is expected to be driven in large part by
population. In this case, low population growth (and decline in some areas) will translate to lower requirements for new sources of
supply and infrastructure upgrades. In rural areas that experience high population decline, the existing assets may in fact be
significantly underutilised – with their operation and maintenance creating a burden on the remaining ratepayers.
In a similar vein, the downside scenario assumes that
we have high public and private debt, lower incomes Asset Build Dates
and a limited ability to pay. In the medium to long term,
this type of funding constraint could be exacerbated by
the looming renewal of a substantial cohort of assets
th
built in the mid-20 century. Although the average age
and expected useful life of urban water assets varies
across the country, Greater Wellington Water (see
right) again provides one example of the lumpy
renewal liability faced by many councils over the next
30 to 50 years.
Source: Greater Wellington Water (Water Supply Asset Management Plan, 2012)
11EVIDENCE BASE: URBAN WATER
Sources
Greater Wellington Water. (2012). Water supply asset management plan.
Local Government Infrastructure Efficiency Expert Advisory Group. (2013, March). March 2013 Report.
Ministry of Health. (2013). Annual report on drinking-water quality 2011- 2012.
MWH. (2010). Issues related to water network asset funding (prepared for the Department of Internal Affairs (DIA)).
Office of the Auditor General. (2010). Local authorities: Planning to meet forecast demand for drinking water.
Office of the Auditor General. (2013). Managing public assets.
PWC/GHD. (2012, July). Implementing the National Infrastructure Plan in the water industry: A Pilot Study.
SPM. (2009). Local government information series: Information on local government water network infrastructure 2009/18 (prepared for
DIA).
Water New Zealand. (2011/12). National performance review of water utilities.
Watercare. (2013). Auckland regional water demand management plan.
12You can also read