Modeling a 2- and 4-Foot Drawdown in the Link River to Keno Dam Reach of the Upper Klamath River, South-Central Oregon

 
CONTINUE READING
Modeling a 2- and 4-Foot Drawdown in the Link River to Keno Dam Reach of the Upper Klamath River, South-Central Oregon
Prepared in cooperation with the Bureau of Reclamation

Modeling a 2- and 4-Foot Drawdown in the Link
River to Keno Dam Reach of the Upper Klamath River,
South-Central Oregon

Scientific Investigations Report 2020-5001

U.S. Department of the Interior
U.S. Geological Survey
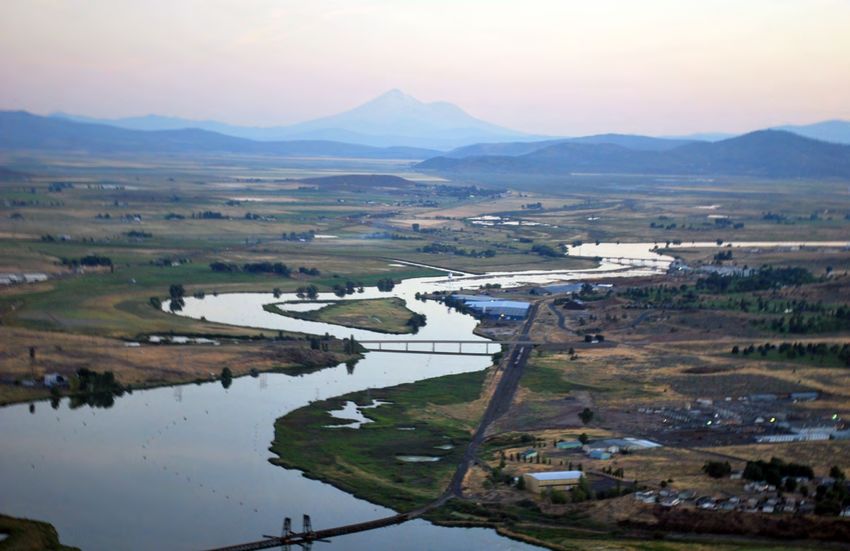
Cover: View looking south along the Link River to Keno Dam reach of the upper Klamath River,
south-Central Oregon, with Mount Shasta, northern California, in the background. Photograph by
Chauncey Anderson, U.S. Geological Survey, August 2009.
Modeling a 2- and 4-Foot Drawdown in the
Link River to Keno Dam Reach of the Upper
Klamath River, South-Central Oregon

By Annett B. Sullivan and Stewart A. Rounds

Prepared in cooperation with the Bureau of Reclamation

Scientific Investigations Report 2020–5001

U.S. Department of the Interior
U.S. Geological Survey
U.S. Department of the Interior
DAVID BERNHARDT, Secretary

U.S. Geological Survey
James F. Reilly II, Director

U.S. Geological Survey, Reston, Virginia: 2020

For more information on the USGS—the Federal source for science about the Earth, its natural and living resources,
natural hazards, and the environment—visit https://www.usgs.gov or call 1–888–ASK–USGS.
For an overview of USGS information products, including maps, imagery, and publications, visit
https://store.usgs.gov/.

Any use of trade, firm, or product names is for descriptive purposes only and does not imply endorsement by the U.S.
Government.
Although this information product, for the most part, is in the public domain, it also may contain copyrighted materials
as noted in the text. Permission to reproduce copyrighted items must be secured from the copyright owner.

Suggested citation:
Sullivan, A.B., and Rounds, S.A., 2020, Modeling a 2- and 4-foot drawdown in the Link River to Keno Dam reach of the
upper Klamath River, south-central Oregon: U.S. Geological Survey Scientific Investigations Report 2020–5001, 18 p.,
https://doi.org/​10.3133/​sir20205001.

ISSN 2328-0328 (online)
iii

Contents
Executive Summary���������������������������������������������������������������������������������������������������������������������������������������1
Introduction����������������������������������������������������������������������������������������������������������������������������������������������������1
     Purpose and Scope������������������������������������������������������������������������������������������������������������������������������3
Methods����������������������������������������������������������������������������������������������������������������������������������������������������������5
     CE-QUAL-W2 Model�����������������������������������������������������������������������������������������������������������������������������5
     Scenario Setup��������������������������������������������������������������������������������������������������������������������������������������5
     Scenario Output and Analysis������������������������������������������������������������������������������������������������������������5
Results and Discussion���������������������������������������������������������������������������������������������������������������������������������6
     Water Velocity and Travel Time����������������������������������������������������������������������������������������������������������6
     Water Quality�����������������������������������������������������������������������������������������������������������������������������������������6
          Model Scenarios Without Macrophytes���������������������������������������������������������������������������������6
                  Keno Dam Outflow��������������������������������������������������������������������������������������������������������������6
                  Link-Keno Reach�����������������������������������������������������������������������������������������������������������������6
                           Algae and Settled Organic Matter��������������������������������������������������������������������������6
                           Dissolved Oxygen������������������������������������������������������������������������������������������������������8
                           Water Temperature���������������������������������������������������������������������������������������������������8
          Model Scenarios With Macrophytes���������������������������������������������������������������������������������������9
Acknowledgments���������������������������������������������������������������������������������������������������������������������������������������18
References Cited�����������������������������������������������������������������������������������������������������������������������������������������18

Figures
         1.     Map showing Link River to Keno Dam reach of the Klamath River,
                south-central Oregon�������������������������������������������������������������������������������������������������������������������2
         2.     Graph showing measured water-surface elevation at three locations in
                Klamath River from Link River mouth to Keno Dam (Link-Keno reach),
                south-central Oregon, 1907-08, and modeled water-surface elevation in the
                2007 base case and the 2- and 4-foot drawdown scenarios�������������������������������������������������4
         3.     Side view of the two-dimensional hydrodynamic and water quality model
                (CE-QUAL-W2) grid showing the model segments and the model layers, from
                Link River to Keno Dam, south-central Oregon�����������������������������������������������������������������������4
         4.     Graphs showing modeled water velocity in the year 2007 base case, and
                modeled velocity difference between the 4-foot drawdown scenario and the
                base-case model, in the Link River to Keno Dam reach of the Klamath River,
                south-central Oregon�������������������������������������������������������������������������������������������������������������������7
         5.     Graphs showing model tracer results from addition of a hypothetical tracer
                at the mouth of Link River and downstream tracer concentrations at the Keno
                Dam outflow indicating the time required for the tracer peak to reach Keno
                Dam, south-central Oregon, during 2007����������������������������������������������������������������������������������8
         6.     Graphs showing modeled flow, temperature, and water-quality constituents in
                the outflow of Keno Dam for the base case, and the 2- and 4-foot drawdown
                scenarios, in the Link River to Keno Dam reach of the Klamath River,
                south-central Oregon, during 2007��������������������������������������������������������������������������������������������9
iv

      7.   Graphs showing modeled chlorophyll a concentration for the year 2007 base
           case and the 4-foot drawdown scenario, in the Link River to Keno Dam reach of
           the Klamath River, south-central Oregon�������������������������������������������������������������������������������10
      8.   Graph showing modeled difference in segment-averaged chlorophyll a
           concentration between the 4-foot drawdown and the base-case scenarios,
           and depth profiles showing chlorophyll a at model segment 38 near Miller
           Island for the base case and 4-foot drawdown scenario, in the Link River to
           Keno Dam reach of the Klamath River, south-central Oregon, during 2007���������������������11
      9.   Graphs showing modeled settled organic matter in the first-order sediment
           compartment for the year 2007 base case, and the difference in modeled
           settled organic matter mass between the 4-foot drawdown scenario and
           the base case, in the Link River to Keno Dam reach of the Klamath River,
           south-central Oregon�����������������������������������������������������������������������������������������������������������������12
     10.   Graph showing modeled difference between dissolved oxygen concentration in
           the 4-foot drawdown scenario and the year 2007 base case, in the Link River to
           Keno Dam reach of the Klamath River, south-central Oregon��������������������������������������������13
     11.   Dissolved-oxygen profiles showing changes in dissolved oxygen
           concentrations at segments 38 (Miller Island) and 95 (Keno Bridge), with
           depth, during 2007, in the Link River to Keno Dam reach of the Klamath River,
           south-central Oregon�����������������������������������������������������������������������������������������������������������������14
     12.   Graph showing modeled difference between water temperature in the 4-foot
           drawdown scenario and the year 2007 base case, in the Link River to Keno
           Dam reach of the Klamath River, south-central Oregon������������������������������������������������������15
     13.   Water-temperature profiles showing changes in water temperature at segment
           38 (Miller Island), with depth, during 2007, in the Link River to Keno Dam reach
           of the Klamath River, south-central Oregon���������������������������������������������������������������������������15
     14.   Graphs showing modeled flow, temperature, and water-quality constituents in
           the outflow of Keno Dam for the base case and 4-foot drawdown scenarios,
           Klamath River, south-central Oregon��������������������������������������������������������������������������������������16
     15.   Graphs showing dissolved-oxygen production and respiration fluxes, as
           modeled with the presence of macrophytes, for macrophytes and algae for the
           entire Link-Keno reach, Klamath River, south-central Oregon�������������������������������������������17
     16.   Dissolved oxygen profiles showing changes in dissolved oxygen
           concentrations at segments 38 (Miller Island) and 95 (Keno Bridge), with depth,
           during 2007�����������������������������������������������������������������������������������������������������������������������������������18
v

Conversion Factors
U.S. customary units to International System of Units

                  Multiply                                  By                       To obtain
                                                         Length
 foot (ft)                                                0.3048      meter (m)
 mile (mi)                                                1.609       kilometer (km)
                                                          Flow rate
 foot per second (ft/s)                                   0.3048      meter per second (m/s)
 cubic foot per second    (ft3/s)                         0.02832     cubic meter per second (m3/s)

International System of Units to U.S. customary units

                  Multiply                                  By                       To obtain
                                                         Length
 meter (m)                                                3.281       foot (ft)
 kilometer (km)                                           0.6214      mile (mi)
                                                          Area
 square meter (m2)                                       0.0002471    acre
 square meter (m2)                                      10.76         square foot (ft2)
                                                         Volume
 liter (L)                                                0.2642      gallon (gal)
                                                        Flow rate
 meter per second (m/s)                                    3.281      foot per second (ft/s)
 cubic meter per second (m3/s)                            35.31       cubic foot per second (ft3/s)
                                                          Mass
 microgram (µg)                                    0.00000003527      ounce, avoirdupois (oz)
 milligram (mg)                                    0.00003527         ounce, avoirdupois (oz)
 gram (g)                                          0.03527            ounce, avoirdupois (oz)
 kilogram (kg)                                     2.205              pound avoirdupois (lb)
 metric ton (t)                                    1.102              ton, short [2,000 lb]
Temperature in degrees Celsius (°C) may be converted to degrees Fahrenheit (°F) as follows:
°F = (1.8 × °C) + 32.
vi

     Datums
     Horizontal coordinate information is referenced to the North American Datum of 1983 (NAD 83).
     A local vertical datum (Upper Klamath Lake Vertical Datum [UKLVD]) is used, established by
     the Bureau of Reclamation. For the purpose of this report, the conversion is UKLVD – 1.78 feet =
     National Geodetic Vertical Datum of 1929 (NGVD 29).
     Elevation, as used in this report, refers to distance above the vertical datum.

     Supplemental Information
     Concentrations of chemical constituents in water are given in either milligrams per liter (mg/L)
     or micrograms per liter (µg/L).

     Abbreviations
     CE-QUAL-W2 Two-dimensional hydrodynamic and water-quality model
     Link-Keno      Klamath River from Link River mouth to Keno Dam
     Reclamation Bureau of Reclamation
     USGS           United States Geological Survey
Modeling a 2- and 4-Foot Drawdown in the Link
River to Keno Dam Reach of the Upper Klamath River,
South-Central Oregon

By Annett B. Sullivan and Stewart A. Rounds

                                                                           there was relatively less deposition of that material in
Executive Summary                                                          the most upstream model segments and relatively more
                                                                           deposition in downstream segments of the Link-Keno
     The most upstream, pooled reach of the Klamath                        reach, especially in summer and autumn, the period
River in south-central Oregon, from Link River mouth to                    with the largest algae bloom.
Keno Dam (Link-Keno), has a water-surface elevation that
remains relatively constant throughout the year. Two model               • Despite minor differences in the Keno Dam outflow,
scenarios, using an existing two-dimensional hydrodynamic                  modeled dissolved oxygen concentration and water
and water-quality model (CE-QUAL-W2), were constructed                     temperature showed some changes in the Link-Keno
to examine the effects of lowering the water-surface elevation             reach compared to the base case, with differences as
by 2 and 4 feet (ft) (0.61 and 1.2 meters) throughout an                   large as 2 milligrams per liter and 2 degrees Celsius,
entire calendar year to mimic some of the potential effects of             respectively, computed as segment averages and daily
removal or modification of Keno Dam. Model results for these               averages.
drawdown scenarios were analyzed for changes in velocity,
travel time, water temperature, total dissolved solids, inorganic        • With macrophytes enabled, the model outflow in the
suspended sediment, nutrients, organic matter, chlorophyll                 drawdown scenarios showed a decrease in dissolved
a, and dissolved oxygen, compared to the base-case                         oxygen concentration in mid-summer that seemed to
model. The model used in this study had been previously                    be related to decreased macrophyte abundance and
calibrated with the presence of aquatic plants (macrophytes).              primary production in those scenarios. The with-
However, most model analyses were completed for model                      macrophyte model results have greater uncertainty,
runs where macrophytes were “turned off” because the                       but the results indicated that macrophytes are likely to
species, abundance, and distribution of macrophytes in                     be an important factor in the dissolved oxygen budget
a lowered-water scenario were all highly uncertain. For                    under reduced water-surface elevations.
comparison, a few model scenario runs were completed with
macrophytes enabled within the model. Findings from this
study include the following:
                                                                    Introduction
     • Modeled water velocity increased and travel time
       decreased substantially throughout the reach with                  The Klamath River flows approximately 255 mi (410
       the 2- and 4-ft drawdown scenarios, with travel time         km) from the mouth of Link River near Upper Klamath Lake
       roughly halved in the 4-ft scenario under unchanged          to the Pacific Ocean. The first 20 mi (32 km) of the Klamath
       flow conditions.                                             River are bounded by the mouth of Link River at the upstream
     • For many water-quality constituents in the drawdown          end and Keno Dam at the downstream end (Link-Keno)
       scenarios, the model showed little to no change in           (fig. 1). This reach was designated as “water-quality limited”
       outflow concentrations at Keno Dam compared to               for exceeding ammonia toxicity and not attaining minimum
       the base case, which represents conditions based on          dissolved oxygen criteria year-round, and failing to meet pH
       year 2007 water-level elevations. However, chloro-           and chlorophyll a criteria in summer. This river reach receives
       phyll a and particulate organic carbon concentrations        large algal and nutrient loads in summer from Upper Klamath
       increased in the Keno Dam outflow in summer with the         Lake, which is just upstream of Link River, with additional
       drawdowns. This seemed to be related to the increased        inputs from nonpoint and point sources in the Link-Keno
       water velocity. As suspended algae and other particu-        reach. A Total Maximum Daily Load has been issued for the
       late organic matter such as dead algal cells and detritus    upper Klamath River including this reach (Oregon Department
       moved farther downstream with the faster velocity,           of Environmental Quality, 2018).
2   Modeling a 2- and 4-Foot Drawdown in the Link River to Keno Dam Reach, Upper Klamath River, Oregon

                                                              121°55'                                                          121°50'                                                     121°45'

                                                                                                                                                   97
                                                                                                                                                         Wocus
                                                                                                                     UPPER

                                                                                                140

                                                          W
                                                                                                                               KLAMATH

                                                           oc
                                                               us
42°
15'                                                                                                                                                     Pelican
                                                                        Dr                                                           LAKE                City             39
                                                                            ain
                 EXPLANATION                                                   ag                                                        Pelican
                                                                                  e
                                                                                                                                         Marina
               420451121510000 Site                                                    Ca
                                                                                         na                                                  Link River
                                                                                            l
                                                                                                                                                Dam                 Klamath A
                                                                                                                                               Link River            Falls    Ca
                                                                                                                                                                                 na
                                                                                                                                                11507500                              l

                        OREGON                                                                                                                       Link River                 Klamath Falls
                                                                                                                                                      11507501                     WWTP
                           Upper                                                                                                                                                                      39
                          Klamath
                           Basin
                                                                                                                                                              Railroad Bridge                   39
                                                                                                                                              140            421209121463000                Altamont
                                                        Round                                                                                                           Lake
                CALIFORNIA                               Lake                                                                                                        Ewauna
                                                                                                                                                                                   South Suburban
                                                                                                                                                                                       WWTP
                                                                                                                                                        66

                                                                                                                                             Columbia                er
                                                                                                                                              Forest              Riv
                                                                                                                                             Products
                                                                                                                                                                                                140
42°
10'                                                                                                                                                               Lost River
                                                                                                                                                                  Diversion Channel
                                                                                                                                                                  421015121471800
                                                                                                                       ath

               Keno streamgage
                                                                                                                   am

               11509500                                                                            Miller Island
                                                                                                               Kl

                                                                                                420853121505500

                                                 Keno
         66                                      Reef Keno
                                  Keno                11509370
                                  Dam
                                             Keno
                                             Outflow                                                                                       Midland
                                                   Keno
                                                                                                                                          No
                                                                                                                                            rth

                                                                                                                                                         Ca
                                                                                                                                                           na

                                                                                                                                97
                                                                                                                                                              l

                                                                       KRS 12a
                                                               420615121533600
                                                                                                                       anal

                                                                                                                                                                                                Spring
                                                                                                                                                                                                 Lake
                                                                                                                        C
                                                                                                                   West

42°
05'
                                                                                       Klamath Straits Drain            Klamath
                                                                                           420451121510000
                                                                                                                                            Stra
                                                                                                                                                it
                                                                                                                   Ady Canal

           0              1                  2           3              4             5 MILES

           0        1         2          3          4        5 KILOMETERS

      Basemap modified from USGS and other digital data sources of various scales. Coordinate
      reference system is UTM, Zone 10N; datum is North American Datum of 1983.

Figure 1. Link River to Keno Dam reach of the Klamath River, south-central Oregon. WWTP, wastewater treatment plant.
Introduction  3

      A geologic feature made of basalt rock known as the         the Link-Keno reach of the Klamath River. One outcome
Keno reef, located between Keno Dam and the town of               of this collaboration was a calibrated water-quality model
Keno (fig. 1), served as a historical water-level control in      (Sullivan and others, 2011; Sullivan, Rounds, and others,
this reach. U.S. Geological Survey (USGS) measurements of         2013). The model has already been used to provide insights
water-surface elevation at three locations in the Link-Keno       into the potential effects of management strategies on water
reach in 1907 were similar and all three varied seasonally        quality (Sullivan, Sogutlugil, and others, 2013; Sullivan and
by about 2 ft (0.61 m; fig. 2; Hoyt and others, 1913). Those      others, 2014).
reported measurements did not document the datum used
by those three streamgages but the datum was assumed to
be equal to the Reclamation datum that was used for the           Purpose and Scope
model and for other nearby streamgages in the early 1900s.
                                                                        The purpose of this study was to use an existing
These historical elevations were within 2.5 ft (0.76 m) of the
                                                                  calibrated two-dimensional hydrodynamic and water-quality
water-surface elevation of Link-Keno in recent years (fig. 2).
                                                                  model (CE-QUAL-W2) of the Link-Keno reach of the
      Keno reef was notched and excavated twice to increase
                                                                  Klamath River to simulate the flow, velocity, water
flow through this part of the Klamath River and to allow the
                                                                  temperature, and water-quality effects of a 2- and 4-ft
drainage of upstream lands. The first notching occurred in
                                                                  drawdown of the water-surface elevation for the period of a
1908 (Dicken and Dicken, 1985). The second notching of
                                                                  calendar year.
Keno reef occurred in the mid-1960s around the time that
                                                                        The calibrated model (calendar year 2007) was used
Keno Dam was constructed.
                                                                  in this study as the base case, in which water quality in the
      Keno Dam was built in 1966 and serves as the
                                                                  Link-Keno reach and the outflow from Keno Dam were
present-day control for the water-surface elevation in the
                                                                  simulated. Changes in the water level were superimposed on
Link-Keno reach. In most years, water-surface elevation
                                                                  top of those base-case conditions for the drawdown scenarios.
is maintained near 4,085.5 ft (1,245.3 m). In this modeling
                                                                  Model results were output at an hourly time step for all model
study, the water-surface elevation was simulated with
                                                                  layers for each model segment as well as Keno Dam outflow.
measured conditions from 2007, called the base case, and
                                                                  Model output included water-surface elevation, flow, velocity,
with drawdown scenarios that lowered the water surface by
                                                                  travel time, water temperature, total dissolved solids, inorganic
2 and 4 ft (0.61 and 1.2 m; figs. 2, 3). Year 2007 was selected
                                                                  suspended sediment, nutrients, organic matter, chlorophyll
because it had annual average and annual mean flows that
                                                                  a, and dissolved oxygen. This report documents the results
were moderate for the years modeled and the water-quality
                                                                  of this study, and compares and discusses the simulated
calibration was based on a rich dataset.
                                                                  differences in model results between the drawdown scenarios
      The U.S. Geological Survey (USGS), Bureau of
                                                                  and the base case.
Reclamation (Reclamation), and Watercourse Engineering,
Inc., are collaborating to better understand water quality in
4   Modeling a 2- and 4-Foot Drawdown in the Link River to Keno Dam Reach, Upper Klamath River, Oregon

                                                               4,090
                                                                                                                                                              EXPLANATION
Water surface elevation, in feet in feet above Upper Klamath

                                                               4,089                                                                         1907–08, 4 miles below Klamath Falls, measured
                                                                                                                                             1907–08, Lees ranch, 12 miles below Klamath Falls, measured
                                                               4,088                                                                         1907–08, Teeters, 17 miles below Klamath Falls, measured
                                                                                                                                             2007 model, base case
                                                               4,087                                                                         2007 model, 2-foot drawdown
                                                                                                                                             2007 model, 4-foot drawdown
                   Lake Vertical Datum

                                                               4,086

                                                               4,085

                                                               4,084

                                                               4,083

                                                               4,082

                                                               4,081

                                                               4,080
                                                                       J   F   M   A   M   J          J   A   S       O       N    D     J       F      M       A      M       J          J   A            S
                                                                                               2007                                                                                2008

Figure 2. Measured water-surface elevation at three locations in Klamath River from Link River mouth to Keno Dam (Link-Keno
reach), south-central Oregon, 1907-08, and modeled water-surface elevation in the 2007 base case and the 2- and 4-foot drawdown
scenarios.
                                                 Keno Dam

                                                                                                                                                                                                    Link River
                                                                                                                   Not to scale
                                                                                                                  EXPLANATION
                                                                                                              Water surface elevation,
                                                                                                                 location approximate
                                                                                                               Base case
                                                                                                               2-foot drawdown
                                                                                                               4-foot drawdown

              Figure 3. Two-dimensional hydrodynamic and water quality model (CE-QUAL-W2) grid showing the model segments (columns
              of cells, right to left) and the model layers (rows, top to bottom), from Link River (right) to Keno Dam (left), south-central Oregon.
              Approximate locations of the water-surface elevation for the base case, 2-foot drawdown, and 4-foot drawdown are shown.
Methods  5

Methods                                                          2006–09 and 2011 (Sullivan and others, 2011; Sullivan,
                                                                 Rounds, and others, 2013); year 2007 was selected for this
     This study used a previously calibrated CE-QUAL-W2          study as a representative year.
model for calendar year 2007 (Sullivan and others, 2011). Two
scenarios were constructed with the water-surface elevation      Scenario Setup
lowered by 2 and 4 ft, and the model output was analyzed
for changes in flow, water temperature, and water quality,             Water-surface elevations for the drawdown scenarios
compared to the base-case model conditions with no changes.      were adjusted by lowering the initial water-surface elevations
                                                                 on January 1 in the representative year by exactly 2 or 4 ft.
                                                                 The model uses flow boundary conditions at the upstream
CE-QUAL-W2 Model                                                 (Link River) and downstream (Keno Dam) ends of the reach;
      CE-QUAL-W2 is a two-dimensional mechanistic                therefore, the change in the initial water-surface elevation
flow, temperature, and water-quality model used to               was sufficient to maintain the drawdown through the rest
simulate variability both longitudinally (from upstream to       of the year, with some differences due to varying levels
downstream) and vertically. The third dimension, from bank       of evaporation over the altered surface widths. The actual
to bank, is considered to be well mixed, which is a good         elevation difference relative to the base case during the year
approximation for many long and narrow waterbodies such          varied from 1.6 to 2.2 ft, with an average difference of 1.9 ft,
as the upper Klamath River that tend to thermally stratify.      for the “2-ft” scenario, and from 3.3 to 4.3 ft, with an average
This is because variations in the vertical dimension in these    difference of 3.8 ft, for the “4-ft” scenario. The average river
waterbodies typically are often far greater than those in the    width was about 750 ft (229 m) in the base case, about 690 ft
lateral dimension. The CE-QUAL-W2 model is capable of            (210 m) in the 2-ft drawdown scenario, and about 600 ft (183
simulating velocity, flow, temperature, and water quality        m) in the 4-ft drawdown scenario.
in lakes, reservoirs, rivers, and estuarine systems. The               A hypothetical tracer test was run with the model using
CE-QUAL-W2 model has been applied successfully to                the “generic” water-quality constituent capability of the
hundreds of river and reservoir systems around the world and     CE-QUAL-W2 model. This type of tracer test can be used
is under active and ongoing development and enhancement          to analyze travel time differences between the regular and
(Cole and Wells, 2008). It has proved to be a useful model       altered scenarios. The numerical tracer was added at the
for planning and management, and for enhancing our               model upstream boundary at the mouth of Link River, and the
understanding of water-quality status and processes in river     model results for the outflow at Keno Dam were analyzed to
and reservoir systems.                                           determine when the tracer peak arrived.
      The USGS upper Klamath River model CE-QUAL-W2                    The original calibrated model had been constructed and
grid consists of 102 segments in the main model branch that      calibrated with macrophytes (aquatic plants) active through
connect in the direction of flow; segments average 1,009 ft      the model reach, based on data from a field survey (Sullivan,
(308 m) in length. Each segment represents a cross-sectional     Rounds, and others, 2013). Because macrophyte species,
shape of the river channel, with stacked layers of varying       abundance, and distribution have greater uncertainty in a
width from the river surface to the channel bottom. Vertical     lowered water-surface elevation scenario, they were “turned
layers in the grid are 2 ft (0.61 m) in height. The original     off” in the first set of model scenarios. A second set of model
model grid was developed to provide averaged bathymetric         runs included macrophytes as part of a sensitivity analysis.
information for each segment. For this scenario, with the
decreased water levels, the maximum elevation of basaltic        Scenario Output and Analysis
features on the river bottom could become more important.
Thus, some minor modifications were made to the segment               The model provided hourly results for all cells in the
lengths and layer widths for segments 16, 17, 18, 90, 91,        model grid, and at Keno Dam. Three separate outflows at
92, 97 and 98 for the scenarios described in this report. The    Keno Dam are specified in the model: the spill gates, a sluice
grid volume was unchanged. Base-case model runs with the         conduit, and a fish ladder. The model provided results for these
original and modified grid indicated no substantial change in    outlets separately and as a whole; the latter total outflow was
model results. A side-view of the model grid from the mouth      used in this study. Postprocessing of model output included
of Link River to Keno Dam depicting the model segments and       the calculation of segment-average results, combining results
layers is shown in figure 3.                                     from all layers weighted by cell volume. Color index maps
      The model uses a variable time step that can be as short   over space and time were produced to visualize model results
as 1 second, but can produce output for all constituents in      over the entire year and for every model segment. These plots
all layers and segments at a user-selected time interval. The    included depth-averaged concentration and daily average
model was constructed and calibrated for calendar years          concentration results.
6   Modeling a 2- and 4-Foot Drawdown in the Link River to Keno Dam Reach, Upper Klamath River, Oregon

Results and Discussion                                              scenario. A second set of scenarios were run with macrophytes
                                                                    as a sensitivity test to determine their potential effect on river
      Results for the model scenarios are presented in this         water quality.
section, starting with water velocity and travel time, and
followed by various water-quality constituents. Because the         Model Scenarios Without Macrophytes
4-ft drawdown was the larger departure from the base-case
scenario, those results were included in this report more often     Keno Dam Outflow
than results from the 2-ft drawdown.                                      With macrophytes “turned off,” simulated changes in
                                                                    water quality at Keno Dam seemed to be relatively minor
Water Velocity and Travel Time                                      between the base-case and drawdown scenarios for water
                                                                    temperature, total dissolved solids, dissolved oxygen, total
      Modeled segment-average velocities ranged from about          nitrogen, dissolved organic carbon, inorganic suspended
0 to 1.0 ft/s (0 to 0.3 m/s) in 2007 (fig. 4A). August and          sediment, total phosphorus, orthophosphate, nitrate, and
September velocities were lowest overall, which was expected        ammonia (fig. 6). Chlorophyll a and particulate organic
because streamflow in this reach tends to be lowest at that         carbon, however, showed notable differences between the
time of year, due to the dry summer climate and increased           base-case and the drawdown scenarios in mid-summer
diversions for agriculture and other uses. With a modeled 4-ft      and early autumn. For those two constituents, the lower
decrease in water-surface elevation, segment-average velocity       water-surface elevation produced higher concentrations at
increased by as much as double in all segments on almost            Keno Dam, compared to the base case at that time of year. In
all dates throughout the year (fig. 4B). The largest velocity       the model, the particulate organic carbon is composed of both
increase was at the shallower segments just upstream of Keno        dead algal material and matter that entered the reach from the
Dam and near the inflow of the Lost River Diversion Channel.        upstream inflow or tributaries. The difference likely is partly
Velocities also increased during high-flow periods; flows in        attributable to the decreased time available for particulate
March 2007 were as high as 2,800 ft3/s (79.3 m3/s).                 material to settle under the drawdown scenarios—a factor
      Model tracer test results showed that a lowered               that was examined in more detail in an analysis of model
water-surface elevation resulted in faster travel times and         differences throughout the Link-Keno reach.
higher velocities through the Link-Keno reach for the same
flow conditions (fig. 5). For a tracer test starting on April 1,    Link-Keno Reach
2007 with flow at 2,154 ft3/s (61.0 m3/s), a hypothetical model
                                                                    Algae and Settled Organic Matter
tracer added at the mouth of Link River took 5.2 days (peak
concentration) to traverse the reach and exit at Keno Dam                 Elevated chlorophyll a concentration in the Link-Keno
under base-case conditions. With the water surface lowered          reach in summer and early autumn largely was due to algae
by 4 ft, the tracer took only 2.7 days (52 percent of the base      flowing into Link and Klamath Rivers from Upper Klamath
case) to travel the same distance. For a tracer test starting       Lake, which has large blooms of the cyanobacterium
on September 7, 2007 under a lower flow of 565 ft3/s (16.0          Aphanizomenon flos-aquae at that time of year. During
m3/s), the peak tracer concentration took 11.1 days to traverse     much of the summer, that species of algae did not thrive
the Link-Keno reach for the base case. In the 4-ft drawdown         in the Link-Keno reach, so an important process was its
scenario, the tracer required only 6.7 days (60 percent of the      settling, death, and decomposition. Thus, the highest algae
base case) to traverse the same distance. The decreased travel      and chlorophyll a concentrations occurred in the upstream
time could affect processes such as water-quality reactions that    end of the reach, near the mouth of Link River (base
take place over time and also the settling of particulate organic   case, fig. 7A). Photosynthesis and oxygen production by
matter, sediment, or algae.                                         algae still occurred, but at times could be overwhelmed
                                                                    by decomposition processes leading to anoxia or hypoxic
                                                                    conditions at certain locations and periods of time. With a 4-ft
Water Quality                                                       water-surface elevation drawdown, the model showed higher
                                                                    concentrations of algae and chlorophyll a moving farther
     Results of the base-case and drawdown scenarios were
                                                                    downstream towards Keno Dam before settling from the water
compared at the Keno Dam outflow and throughout the
                                                                    column (fig 7B), owing to the higher water velocities in that
Link-Keno reach. The comparison at Keno Dam provides
                                                                    scenario than in the base-case scenario. The differences in
a cumulative overview of modeled water-quality changes
                                                                    the modeled chlorophyll a concentrations are shown in figure
throughout the reach. Simulations were first run without the
                                                                    8A, and an increase in the peak chlorophyll a concentration
presence of macrophytes (aquatic plants) because a substantial
                                                                    was discernable at the Miller Island monitoring site (model
decrease in water level could have a large effect on the
                                                                    segment 38, fig. 8B).
presence and amount of macrophytes, and few data exist
to determine how the macrophytes might change in such a
Results and Discussion   7

                         A. Base case

                 Jan.
                                                                                                          EXPLANATION
                 Feb.                                                                                      Velocity, in meters
                                                                                                              per second
                 Mar.                                                                                       0.5

                  Apr.

                                                                                                            0.4
                 May

                 June
          2007

                                                                                                            0.3
                 July

                 Aug.
                                                                                                            0.2

                 Sept.

                  Oct.                                                                                      0.1

                 Nov.

                                                                                                            0
                 Dec.

                         B. 4-foot drawdown minus base case

                 Jan.                                                                                     EXPLANATION
                                                                                                           Velocity difference,
                 Feb.                                                                                         in meters
                                                                                                              per second
                 Mar.                                                                                       0.33
                                                                                                            0.3
                  Apr.

                                                                                                            0.2
                 May

                 June                                                                                       0.1
          2007

                 July
                                                                                                            0

                 Aug.

                                                                                                            -0.1
                 Sept.

                  Oct.                                                                                      -0.2

                 Nov.
                                                                                                            -0.3
                                                                                                            -0.33
                 Dec.
                    Keno Dam

                                                KSD

                                                                                  COL
                                                                                 LRDC

                                                                                               SSSD
                                                                                                   KF
                                                                                           Link River

Figure 4. Modeled water velocity in the year 2007 base case (A), and modeled velocity difference between the 4-foot drawdown
scenario and the base-case model (B), in the Link River to Keno Dam reach of the Klamath River, south-central Oregon. Colors
correspond to model-segment averages across the modeled reach and for the whole year. X-axis represents the Klamath River
reach from Link River mouth (right) to Keno Dam (left). X-axis labels are the locations of inflows and point sources: KF, Klamath Falls
wastewater treatment plant (WWTP); SSSD, South Suburban WWTP; LRDC, Lost River Diversion Channel; COL, Columbia Forest
Products; KSD, Klamath Straits Drain. Positive velocity differences in (B) indicate that the 4-foot drawdown scenario had higher
velocities than the base case.
8   Modeling a 2- and 4-Foot Drawdown in the Link River to Keno Dam Reach, Upper Klamath River, Oregon

                                                           Inject tracer                                                                               does not occur when oxygen concentrations are less than a
                                                                                                                                                       threshold of 0.1 mg/L. In the base-case model, the distribution
                                                10,000
                                                                                                                                                       of first-order sediment (fig. 9 A) showed that a large quantity
                                                                                                         Flow = 2,154 cubic feet per second
                                                                                                                                                       of organic matter, much of it derived from algae, settled in
   Tracer concentration, in milligrams per liter

                                                   8,000
                                                                                                                     EXPLANATION                       the upper part of the Link-Keno. With a 4-ft drawdown, the
                                                                                                                          Tracer injection             model showed relatively less accumulation of settled organic
                                                                                                                          Tracer at Keno Dam           matter in those upper reaches (fig. 9B). Instead, the algae and
                                                   6,000                                                                                               particulate organic matter had a higher chance of being swept
                                                                                                                                                       farther downstream by the higher velocities, which resulted
                                                                                                                                                       in relatively more settling in downstream reaches and higher
                                                   4,000
                                                                                   4-foot drawdown                                                     concentrations in the Keno Dam outflow in summer and
                                                                                       = 2.7 days                                                      autumn when the blooms occurred (fig. 6).
                                                   2,000                                                     Base
                                                                                                           = 5.2 days                                  Dissolved Oxygen
                                                                                                                                                             The CE-QUAL-W2 model considers various sinks and
                                                       0
                                                                  1        2         3         4        5        6           7          8         9
                                                                                                                                                       sources of dissolved oxygen, including inflow concentrations,
                                                                                                   April 2007                                          atmospheric exchange across the river surface, algal
                                                                                                                                                       photosynthesis and respiration, ammonia and nitrate oxidation,
                                           10,000                                                                                                      and organic matter decay in the water column and sediments.
                                                                                                          Flow = 565 cubic feet per second             Although modeled dissolved oxygen concentrations in the
Tracer concentration, in milligrams per liter

                                                                                                                                                       Keno Dam outflow indicated that overall changes were minor
                                                   8,000                                                                                               in the drawdown scenarios (fig. 6), some spatial variability
                                                                                                                                                       in dissolved oxygen results in the Link-Keno reach (fig. 10)
                                                                                                                                                       merited a more-detailed examination because oxygen levels
                                                   6,000                                                                                               influence many processes in the model and are important to
                                                                                                                                                       aquatic life.
                                                                                                                                                             The segment-average, daily-average results showed that
                                                   4,000
                                                                                                                                                       simulated dissolved oxygen concentrations changed by as
                                                                                                                                                       much as 2.0 mg/L in the 4-ft drawdown scenario (fig. 10).
                                                   2,000                                                                                               Concentrations increased and decreased in that scenario,
                                                                                           4-foot drawdown                   Base
                                                                                                                                                       depending on day and location. An examination of results
                                                                                               = 6.7 days                 = 11.1 days                  over the depth of the water column at two locations indicated
                                                      0                                                                                                that areas of hypoxia and anoxia (
Results and Discussion   9

                            90                                                                      30                                                                         30
cubic meters per second
 Flow, daily average, in

                                                                                                                                                average, in degrees
                            80

                                                                                                                                                 Temperature daily
                                                                             degrees Celsius
                                                                             Temperature, in
                            70
                            60                                                                      20                                                                         20

                                                                                                                                                      Celsius
                            50
                            40                                                                      10                                                                         10
                            30
                            20
                            10                                                                       0                                                                          0
                           250                                                                      20                                                                         20

                                                                                                                                               Dissolved oxygen daily
                                                                                                                                               average, in milligrams
 Total dissolved solids,
 in milligrams per liter

                                                                           Dissolved oxygen, in
                                                                            milligrams per liter
                           200
                                                                                                    15                                                                         15
                           150

                                                                                                                                                      per liter
                                                                                                    10                                                                         10
                           100
                           50                                                                        5                                                                          5

                            0                                                                        0                                                                          0
                             5                                                                      20                                                                         60

                                                                                                                                               Inorganic suspended
                                                                     carbon, in milligrams
 milligrams per liter

                                                                                                                                                milligrams per liter
                                                                      Dissolved organic

                             4
  Total nitrogen, in

                                                                                                    15

                                                                                                                                                    sediment, in
                                                                                                                                                                               40
                                                                           per liter
                             3
                                                                                                    10
                             2
                                                                                                                                                                               20
                             1                                                                       5

                             0                                                                       0                                                                          0
                           0.5                                                                       6                                                                        160

                                                                                                                                                     micrograms per liter
 Total phosphorus, in

                                                                     carbonin milligrams
                                                                     Particulate organic
  milligrams per liter

                                                                                                     5

                                                                                                                                                       Chlorophyll a, in
                           0.4                                                                                                                                                120
                                                                                                     4
                                                                           per liter

                           0.3
                                                                                                     3                                                                         80
                           0.2
                                                                                                     2
                           0.1                                                                                                                                                 40
                                                                                                     1
                             0                                                                       0                                                                          0
                           0.5                                                                       1                                                                          2

                                                                                                                                                     Ammonia, in milligrams
                                                                           Nitrate, in milligrams
 Orthophosphate, in
 milligrams per liter

                           0.4                                                                      0.8                                                                       1.5
                                                                               per liter as N

                                                                                                                                                        per liter as N
                           0.3                                                                      0.6
                                                                                                                                                                                1
                           0.2                                                                      0.4
                           0.1                                                                      0.2                                                                       0.5

                             0                                                                       0                                                                          0
                                 J   F M A M J   J   A   S   O N D                                        J   F M A M J   J   A   S    O N D                                        J   F M A M J   J   A   S   O N D

                                                                                                                   EXPLANATION
                                                                                                                     Base case
                                                                                                                     2-foot drawdown
                                                                                                                     4-foot drawdown

Figure 6. Modeled flow, temperature, and water-quality constituents in the outflow of Keno Dam for the base case, and the 2- and
4-foot drawdown scenarios, in the Link River to Keno Dam reach of the Klamath River, south-central Oregon, during 2007. Macrophyte
effects are not included in these runs.

relatively unaltered, with slightly different levels of thermal                                                       used by the CE-QUAL-W2 model to simulate macrophyte
stratification due to shallower depths constituting most of the                                                       growth depend on water depth, cross-sectional shape, initial
differences.                                                                                                          conditions, and light extinction rates, among other factors. A
                                                                                                                      lower water level possibly could influence the colonization
                                                                                                                      of channel margins or parts of the Link-Keno reach by the
Model Scenarios With Macrophytes                                                                                      same or different species of macrophytes in ways that do not
     Several species of aquatic plants (macrophytes) were                                                             mirror the conditions measured in 2011. To the extent that
present in field surveys from 2011, and those field data                                                              macrophytes in a drawdown scenario might colonize and
were used to calibrate the model rates and parameters for                                                             grow in areas that were similar to the base case, simulating the
macrophytes in the Link-Keno model (Sullivan, Rounds,                                                                 presence of macrophytes was determined to be useful at least
and others, 2013), but extrapolating model predictions of                                                             as a sensitivity test, and as a means of gaining insight into the
macrophyte growth to the lower water-surface elevations in                                                            potential importance of the influence of macrophytes on water
these scenarios involves greater uncertainty. The algorithms                                                          quality in a drawdown scenario.
10   Modeling a 2- and 4-Foot Drawdown in the Link River to Keno Dam Reach, Upper Klamath River, Oregon

                         A. Base case

                 Jan.
                                                                                                        EXPLANATION
                 Feb.                                                                                    Chlorophyll a, in
                                                                                                            micrograms per liter
                 Mar.                                                                                     195

                                                                                                          180
                  Apr.
                                                                                                          160
                 May
                                                                                                          140
                 June
                                                                                                          120
          2007

                 July
                                                                                                          100

                 Aug.                                                                                     80

                 Sept.                                                                                    60

                  Oct.                                                                                    40

                                                                                                          20
                 Nov.

                                                                                                          0
                 Dec.

                         B. 4-foot drawdown

                 Jan.
                                                                                                        EXPLANATION
                 Feb.                                                                                    Chlorophyll a, in
                                                                                                            micrograms per liter
                 Mar.                                                                                     195

                                                                                                          180
                  Apr.
                                                                                                          160
                 May
                                                                                                          140
                 June
                                                                                                          120
          2007

                 July
                                                                                                          100

                 Aug.                                                                                     80

                 Sept.                                                                                    60

                  Oct.                                                                                    40

                                                                                                          20
                 Nov.

                                                                                                          0
                 Dec.
                    Keno Dam

                                              KSD

                                                                                COL
                                                                               LRDC

                                                                                             SSSD
                                                                                                 KF
                                                                                         Link River

Figure 7. Modeled chlorophyll a concentration for the year 2007 base case (A), and the 4-foot drawdown scenario (B), in the
Link River to Keno Dam reach of the Klamath River, south-central Oregon. Colors correspond to model-segment averages across
the modeled reach and for the whole year. X-axis represents the Klamath River reach from Link River mouth (right) to Keno Dam
(left). X-axis labels are the locations of inflows and point sources: KF, Klamath Falls wastewater treatment plant (WWTP); SSSD,
South Suburban WWTP; LRDC, Lost River Diversion Channel; COL, Columbia Forest Products; KSD, Klamath Straits Drain. Note: To
emphasize the spatial pattern, values are capped in these two plots. Values greater than 195 micrograms per liter (µg/L) are plotted as
195 µg/L. Actual modeled chlorophyll a concentrations could be as much as 600 µg/L or more.
Results and Discussion   11

                                A. 4-foot drawdown minus base case

                        Jan.
                                                                                                                                          EXPLANATION
                        Feb.                                                                                                                Chlorophyll a difference, in
                                                                                                                                               micrograms per liter
                        Mar.                                                                                                                120

                                                                                                                                            100
                        Apr.
                                                                                                                                            80
                        May                                                                                                                 60

                   June                                                                                                                     40
2007

                                                                                                                                            20
                        July
                                                                                                                                            0

                        Aug.                                                                                                                -20

                                                                                                                                            -40
                  Sept.
                                                                                                                                            -60
                        Oct.
                                                                                                                                            -80

                        Nov.                                                                                                                -100

                                                                                                                                            -120
                        Dec.
                                                                                  Segment 38
                             Keno Dam

                                                            KSD

                                                                                                           COL
                                                                                                          LRDC

                                                                                                                          SSSD
                                                                                                                              KF
                                                                                                                      Link River
                                 B. Segment 38: Base case
                         0
 Water depth, in feet

                        20
                                Segment 38: 4-foot drawdown
                         0

                        16
                                        Jan.    Feb.        Mar.     Apr.        May               June           July             Aug.         Sept.       Oct.           Nov.   Dec.
                                                                                                          2007
                                                                                                    EXPLANATION
                                                                                          Chlorophyll a, in micrograms per liter

                                                                        0   50   100 150 200 250 300 350 400 450 500 550 600

Figure 8. Modeled difference in segment-averaged chlorophyll a concentration between the 4-foot drawdown and the base-case
scenarios (A), and depth profiles showing chlorophyll a at model segment 38 near Miller Island for the base case (top) and 4-foot
drawdown scenario (bottom) (B), in the Link River to Keno Dam reach of the Klamath River, south-central Oregon, during 2007. X-axis
labels are the locations of inflows and point sources: KF, Klamath Falls wastewater treatment plant (WWTP); SSSD, South Suburban
WWTP; LRDC, Lost River Diversion Channel; COL, Columbia Forest Products; KSD, Klamath Straits Drain. Profiles are plotted every 0.2
day, with colors representing chlorophyll a concentrations.

     Base-case and 4-ft drawdown scenario results at the                                                  the simulation. The daily fluctuation in dissolved oxygen also
Keno Dam outflow location were largely similar after                                                      was greater with macrophytes enabled, owing to the greater
adding macrophytes back into the model (fig. 14), with a                                                  combined primary production and respiration of macrophytes
few exceptions. Particulate organic carbon and chlorophyll                                                and algae together. Modeled dissolved oxygen fluxes showed
a showed increases in the drawdown scenario in the same                                                   decreased oxygen production and respiration in the drawdown
manner as results from the without-macrophytes model                                                      scenarios compared to the base case, particularly for the
runs (fig. 6). Similarly, those effects were attributable to                                              macrophytes (fig. 15A), that led to the lower dissolved oxygen
the higher velocities and less time for settling. Unlike the                                              concentrations in the outflow. Whole-reach dissolved oxygen
without-macrophytes simulations, however, dissolved oxygen                                                fluxes for algae (fig. 15B) were more similar for the various
showed a notable decrease in the outflow between the base                                                 water-level scenarios.
case and a 4-ft drawdown when macrophytes were included in
12   Modeling a 2- and 4-Foot Drawdown in the Link River to Keno Dam Reach, Upper Klamath River, Oregon

                         A. 4-foot drawdown

                 Jan.
                                                                                                       EXPLANATION
                 Feb.
                                                                                                         First-order sediment,
                                                                                                             in grams per square
                 Mar.                                                                                        meter
                                                                                                          1,040
                                                                                                          1,000
                  Apr.
                                                                                                          900
                 May
                                                                                                          800
                 June
                                                                                                          700
          2007

                 July                                                                                     600

                 Aug.                                                                                     500

                                                                                                          400
                 Sept.
                                                                                                          300
                  Oct.
                                                                                                          200
                 Nov.
                                                                                                          100

                 Dec.
                                                                                                          0

                         B. 4-foot drawdown minus base case

                 Jan.

                                                                                                       EXPLANATION
                 Feb.
                                                                                                         First-order sediment
                                                                                                             difference, in
                 Mar.                                                                                        metric tons
                                                                                                          20
                  Apr.
                                                                                                         15
                 May
                                                                                                         10
                 June
          2007

                                                                                                         5
                 July

                                                                                                         0
                 Aug.

                 Sept.                                                                                   -5

                  Oct.                                                                                   -10

                 Nov.                                                                                    -15

                 Dec.
                                                                                                         -20
                    Keno Dam

                                                KSD

                                                                                COL
                                                                               LRDC

                                                                                            SSSD
                                                                                                KF
                                                                                        Link River

Figure 9. Modeled settled organic matter in the first-order sediment compartment for the year 2007 base case (A), and the
difference in modeled settled organic matter mass between the 4-foot drawdown scenario and the base case (B), in the Link River to
Keno Dam reach of the Klamath River, south-central Oregon. Macrophyte effects are not included in these model runs. All values are
model-segment averages (A), or totals (B) for the whole year. X-axis represents the reach from Link River mouth (right) to Keno Dam
(left). X-axis labels are the locations of inflows and point sources: KF, Klamath Falls wastewater treatment plant (WWTP); SSSD, South
Suburban WWTP; LRDC, Lost River Diversion Channel; COL, Columbia Forest Products; KSD, Klamath Straits Drain.
Results and Discussion   13

                          4-foot drawdown minus base case

                  Jan.                                                                                       EXPLANATION
                                                                                                             Dissolved oxygen
                  Feb.                                                                                          difference, in
                                                                                                                milligrams per liter
                  Mar.                                                                                        2.0

                   Apr.                                                                                       1.5

                  May                                                                                         1.0

                  June
                                                                                                              0.5
           2007

                  July
                                                                                                              0

                  Aug.
                                                                                                              -0.5
                  Sept.
                                                                                                              -1.0
                   Oct.
                                                                                                              -1.5
                  Nov.

                                                                                                              -2.0
                  Dec.
                     Keno Dam

                                Segment 95

                                                    KSD

                                                                   Segment 38

                                                                                      COL
                                                                                     LRDC

                                                                                                  SSSD
                                                                                                      KF
                                                                                              Link River
           Figure 10. Modeled difference between dissolved oxygen concentration in the 4-foot drawdown scenario
           and the year 2007 base case, in the Link River to Keno Dam reach of the Klamath River, south-central Oregon.
           Positive values represent times and locations of dissolved oxygen increases in the drawdown scenario and
           negative values represent times and locations of dissolved oxygen decreases. Macrophyte effects are not
           included in these model runs. All values are model-segment averages across the modeled reach and for the
           whole year. X-axis represents the reach from Link River mouth (right) to Keno Dam (left). X-axis labels are the
           locations of inflows and point sources: KF, Klamath Falls wastewater treatment plant (WWTP); SSSD, South
           Suburban WWTP; LRDC, Lost River Diversion Channel; COL, Columbia Forest Products; KSD, Klamath Straits
           Drain.

      Several possible reasons might explain the decreased                 at the river bottom, but the overall patterns were similar, with
oxygen production from macrophytes in the drawdown                         large oxygen demands co-occurring with the presence of large
scenario. In the 2011 Link-Keno macrophyte survey,                         algal abundances moving through the river in July and August.
macrophytes were limited to shallow areas throughout                       The deposited organic matter from that algae continued
the reach, including shallow waters along the edges of the                 to exert an oxygen demand at upstream locations through
Klamath River. Macrophytes were not found in deep water                    September.
because the relatively high light extinction from dissolved                      The model results with macrophytes enabled should be
organic matter restricted the available light needed by those              treated with higher uncertainty for multiple reasons. First, a
plants in deep-water habitats. The bathymetry for the model                lower water level possibly could lead to different macrophyte
grid, based on a field survey, resulted in slightly shallower              species colonizing the reach; this possibility was not captured
slopes near the river edges in the base case, as compared to the           with the existing model. A water-level drawdown also possibly
slopes occurring at the river edges in the drawdown scenarios.             could alter the nearshore bathymetry over time owing to
As a result, macrophytes in the drawdown scenario had a                    erosion or deposition, thereby affecting the amount of shallow
smaller area of nearshore habitat with ideal light conditions              nearshore habitat for macrophytes. Regardless of this, the
compared to the base case.                                                 model shows that macrophyte dynamics could be a substantial
      Vertical profiles of dissolved oxygen at two locations               factor affecting dissolved oxygen concentrations and patterns
from model runs with macrophytes enabled (fig. 16) showed                  with a drawdown of the Link-Keno reach.
patterns that were similar to those run without macrophytes
(fig. 11). The 4-ft drawdown scenario had less frequent anoxia
14   Modeling a 2- and 4-Foot Drawdown in the Link River to Keno Dam Reach, Upper Klamath River, Oregon

                            Segment 38: Base case
                        0

                       20
                            Segment 38: 4-foot drawdown
                        0
Water depth, in feet

                       16

                            Segment 95: Base case
                        0

                       22
                            Segment 95: 4-foot drawdown
                        0

                       18
                                Jan.       Feb.       Mar.   Apr.       May            June            July          Aug.           Sept.   Oct.   Nov.   Dec.
                                                                                                2007
                                                                                          EXPLANATION
                                                                            Dissolved oxygen, in milligrams per liter

                                                                0   1   2   3    4    5     6    7     8   9   10   11   12   13   14

Figure 11. Dissolved-oxygen profiles showing changes in dissolved oxygen concentrations at segments 38 (Miller Island) and 95
(Keno Bridge), with depth, during 2007, in the Link River to Keno Dam reach of the Klamath River, south-central Oregon. Output is every
0.2 day. Macrophyte effects are not included in these model runs.
Results and Discussion   15

                                               4-foot drawdown minus base case

                                       Jan.
                                                                                                                                                                  EXPLANATION
                                       Feb.                                                                                                                       Temperature difference,
                                                                                                                                                                     in degrees Celsius
                                       Mar.                                                                                                                        2.0

                                        Apr.                                                                                                                       1.5

                                       May                                                                                                                         1.0

                                       June
                                                                                                                                                                   0.5
                                2007

                                       July
                                                                                                                                                                   0

                                       Aug.
                                                                                                                                                                   -0.5
                                       Sept.
                                                                                                                                                                   -1.0
                                        Oct.
                                                                                                                                                                   -1.5
                                       Nov.

                                                                                                                                                                   -2.0
                                       Dec.
                                          Keno Dam

                                                                         KSD

                                                                                                        Segment 38

                                                                                                                                    COL
                                                                                                                                   LRDC

                                                                                                                                                     SSSD
                                                                                                                                                         KF
                                                                                                                                                 Link River
                               Figure 12. Modeled difference between water temperature in the 4-foot drawdown scenario and the year
                               2007 base case, in the Link River to Keno Dam reach of the Klamath River, south-central Oregon. Positive values
                               represent times and locations of temperature increase in the drawdown scenario and negative values represent
                               times and locations of temperature decreases. Macrophyte effects are not included in these model runs. Colors
                               correspond to model-segment averages across the modeled reach and for the whole year. X-axis represents the
                               Klamath River reach from Link River mouth (right) to Keno Dam (left). X-axis labels are the locations of inflows and
                               point sources: KF, Klamath Falls wastewater treatment plant (WWTP); SSSD, South Suburban WWTP; LRDC, Lost
                               River Diversion Channel; COL, Columbia Forest Products; KSD, Klamath Straits Drain. Segment 38 is the location of
                               the Miller Island sampling location.

                            Segment 38: Base case
                        0
Water depth, in feet

                       20
                            Segment 38: 4-foot drawdown
                        0

                       16
                                Jan.                 Feb.    Mar.        Apr.            May         June                   July          Aug.            Sept.        Oct.       Nov.      Dec.
                                                                                                                     2007
                                                                                                      EXPLANATION
                                                                                               Temperature, in degrees Celsius

                                                                            0    2   4     6   8   10 12 14 16 18 20 22 24 26 28 30

Figure 13. Water-temperature profiles showing changes in water temperature at segment 38 (Miller Island), with depth, during 2007,
in the Link River to Keno Dam reach of the Klamath River, south-central Oregon. Output is every 0.2 day. Macrophyte effects are not
included in these model runs.
16   Modeling a 2- and 4-Foot Drawdown in the Link River to Keno Dam Reach, Upper Klamath River, Oregon

                          250                                                                20                                                                 20
Total dissolved solids,
in milligrams per liter

                                                                    Dissolved oxygen, in
                                                                     milligrams per liter

                                                                                                                                        milligrams per liter
                                                                                                                                        Dissolved oxygen
                          200

                                                                                                                                         daily average, in
                                                                                             15                                                                 15
                          150
                                                                                             10                                                                 10
                          100
                          50                                                                  5                                                                  5

                           0                                                                  0                                                                  0
                           5                                                                 20                                                                 60

                                                                                                                                        Inorganic suspended
                                                                    carbon, in milligrams
milligrams per liter

                                                                                                                                         milligrams per liter
                                                                     Dissolved organic
                           4
 Total nitrogen, in

                                                                                             15

                                                                                                                                             sediment, in
                                                                                                                                                                40

                                                                          per liter
                           3
                                                                                             10
                           2
                                                                                                                                                                20
                           1                                                                  5

                           0                                                                  0                                                                  0
                          0.5                                                                 6                                                                160
                                                                    carbon, in milligrams

                                                                                                                                        micrograms per liter
Total phosphorus, in

                                                                     Particulate organic
 milligrams per liter

                          0.4

                                                                                                                                          Chlorophyll a, in
                                                                                                                                                               120
                                                                                              4
                                                                           per liter

                          0.3
                                                                                                                                                                80
                          0.2
                                                                                              2
                          0.1                                                                                                                                   40

                           0                                                                  0                                                                  0
                          0.5                                                                 1                                                                  2
                                                                    Nitrate, in milligrams
Orthophosphate, in
milligrams per liter

                                                                                                                                         milligrams per liter
                          0.4                                                                0.8                                                                1.5
                                                                        per liter as N

                                                                                                                                            Ammonia, in
                          0.3                                                                0.6

                                                                                                                                                 as N
                                                                                                                                                                 1
                          0.2                                                                0.4
                          0.1                                                                0.2                                                                0.5

                           0                                                                  0                                                                  0
                                J   F M A M J   J   A   S   O N D                                  J   F M A M J   J   A   S    O N D                                 J   F M A M J   J   A   S   O N D

                                                                                                            EXPLANATION
                                                                                                              Base case
                                                                                                              4-foot drawdown

Figure 14. Modeled flow, temperature, and water-quality constituents in the outflow of Keno Dam for the base case and 4-foot
drawdown scenarios, Klamath River, south-central Oregon. Macrophyte effects are included in these runs.
Results and Discussion   17

                                                        A. Macrophytes
                                              90,000

                                              80,000                                                                         EXPLANATION
                                                                                                                           Dissolved oxygen production
                                              70,000                                                                        Base case
                                                                                                                            4-foot drawdown
Dissolved oxygen flux, in kilograms per day

                                              60,000                                                                       Dissolved oxygen respiration
                                                                                                                            Base case
                                              50,000                                                                        4-foot drawdown

                                              40,000

                                              30,000

                                              20,000

                                              10,000

                                                   0

                                              -10,000

                                              -20,000

                                              -30,000
                                                        B. Algae
                                              90,000

                                              80,000

                                              70,000
Dissolved oxygen flux, in kilgrams per day

                                              60,000

                                              50,000

                                              40,000

                                              30,000

                                              20,000

                                              10,000

                                                   0

                                              -10,000

                                              -20,000

                                              -30,000
                                                          Jan.     Feb.   Mar.   Apr.   May   June   July   Aug.   Sept.     Oct.       Nov.        Dec.

Figure 15. Dissolved-oxygen production and respiration fluxes, as modeled with the presence of macrophytes, for
macrophytes (A), and algae (B) for the entire Link-Keno reach, Klamath River, south-central Oregon.
18   Modeling a 2- and 4-Foot Drawdown in the Link River to Keno Dam Reach, Upper Klamath River, Oregon

                            Segment 38: Base case
                        0

                       20
                            Segment 38: 4-foot drawdown
                        0
Water depth, in feet

                       16

                            Segment 95: Base case
                        0

                       22
                            Segment 95: 4-foot drawdown
                        0

                       18
                                Jan.       Feb.       Mar.   Apr.       May            June            July          Aug.           Sept.   Oct.   Nov.   Dec.
                                                                                                2007
                                                                                          EXPLANATION
                                                                            Dissolved oxygen, in milligrams per liter

                                                                0   1   2   3    4    5     6    7     8   9   10   11   12   13   14

Figure 16. Dissolved oxygen profiles showing changes in dissolved oxygen concentrations at segments 38 (Miller Island) and 95
(Keno Bridge), with depth, during 2007. Output is every 0.2 day. Macrophyte effects are included in these model runs.

Acknowledgments                                                                                 Oregon Department of Environmental Quality, 2018,
                                                                                                  Upper Klamath and Lost River subbasins TMDL and
     The authors gratefully acknowledge Rick Carlson                                              water quality management plan: Oregon Department
(Bureau of Reclamation), Mike Deas (Watercourse                                                   of Environmental Quality TMDL Program, accessed
Engineering), and Brian Cluer and Shari Whitmore (National                                        July 12, 2019, at https://www.oregon.gov/​deq/​FilterDocs/​
Oceanic and Atmospheric Administration) for providing                                             klamathlostTMDL2018.pdf.
insights and helpful discussions during this study. Comments                                    Sullivan, A.B., Rounds, S.A., Asbill-Case, J.R., and Deas,
from two peer reviewers also improved this report.                                                M.L., 2013, Macrophyte and pH buffering updates to the
                                                                                                  Klamath River water-quality model upstream of Keno Dam,
                                                                                                  Oregon: U.S. Geological Survey Scientific Investigations
References Cited                                                                                  Report 2013–5016, 52 p., https://doi.org/​10.3133/​
                                                                                                  sir20135016.
Cole, T.M., and Wells, S.A., 2008, CE-QUALW2—A two-                                             Sullivan, A.B., Rounds, S.A., Deas, M.L., Asbill, J.R.,
  dimensional, laterally averaged, hydrodynamic and water-                                        Wellman, R.E., Stewart, M.A., Johnston, M.W., and
  quality model, version 3.6: U.S. Army Corps of Engineers,                                       Sogutlugil, I.E., 2011, Modeling hydrodynamics, water
  Instruction Report EL-08-1 [variously paged].                                                   temperature, and water quality in the Klamath River
                                                                                                  upstream of Keno Dam, Oregon, 2006–09: U.S. Geological
Dicken, S.N., and Dicken, E.F., 1985, The legacy of ancient                                       Survey Scientific Investigations Report 2011–5105, 70 p.,
  Lake Modoc—A historical geography of the Klamath Lakes                                          https://pubs.usgs.gov/​sir/​2011/​5105/​.
  Basin: Distributed by University of Oregon Bookstore,
  Eugene, Oregon [variously paged].                                                             Sullivan, A.B., Sogutlugil, I.E., Deas, M.L., and Rounds, S.A.,
                                                                                                  2014, Water-quality modeling of Klamath Straits Drain
Hoyt, J.C., McGlashan, H.D., and Dean, H.J., 1913, Water                                          recirculation, a Klamath River wetland, and 2011 condi-
  Resources of California, Part III, Stream measurements                                          tions for the Link River to Keno Dam reach of the Klamath
  in the Great Basin and Pacific Coast river basins: U.S.                                         River, Oregon: U.S. Geological Survey Open-File Report
  Geological Survey Water-Supply Paper 300, 956 p.,                                               2014–1185, 75 p., https://doi.org/​10.3133/​ofr20141185.
  https://doi.org/​10.3133/​wsp300.
                                                                                                Sullivan, A.B., Sogutlugil, I.E., Rounds, S.A., and Deas,
                                                                                                  M.L., 2013, Modeling the water-quality effects of changes
                                                                                                  to the Klamath River upstream of Keno Dam, Oregon:
                                                                                                  U.S. Geological Survey Scientific Investigations Report
                                                                                                  2013–5135, 60 p., https://doi.org/​10.3133/​sir20135135.
Publishing support provided by the U.S. Geological Survey
Science Publishing Network, Tacoma Publishing Service Center

For more information concerning the research in this report, contact the
   Director, Oregon Water Science Center
   U.S. Geological Survey
   2130 SW 5th Avenue
   Portland, Oregon 97201
   https://www.usgs.gov/centers/or-water
Sullivan and Rounds—Modeling a 2- and 4-Foot Drawdown in the Link River to Keno Dam Reach, Upper Klamath River, Oregon—Scientific Investigations Report 2020-5001

                                                                                                                                                                    https://doi.org/10.3133/sir20205001
                                                                                                                                                                    ISSN 2328-0328 (online)
You can also read