COUNTRY PROFILE BANGLADESH - Climate Analytics
←
→
Page content transcription
If your browser does not render page correctly, please read the page content below
COUNTRY PROFILE BANGLADESH
DECARBONISING SOUTH AND SOUTH EAST ASIA
Shifting energy supply in South Asia and South East Asia to non-fossil
fuel-based energy systems in line with the Paris Agreement long-term
temperature goal and achievement of Sustainable Development Goals
MAY 2019
This country profile is part of the Decarbonising South and South East Asia report
and examines how to shift the energy supply in South Asia and South East Asia to
non-fossil fuel-based energy systems in line with the Paris Agreement long-term
temperature goal and achievement of Sustainable Development Goals.

Find links to other country profiles and the full report below.

                                                                                Bangladesh
                                                                                      India
                                                                                 Indonesia
                                                                                  Pakistan
                                                                                Philippines
                                                                                  Thailand
 Webpage                                                                          Vietnam
 Full report
 Executive Summary

Authors                  Ursula Fuentes Hutfilter               Paola Yanguas Parra
                         Anne Zimmer                           Andrzej Ancygier
                         Fahad Saeed                           Robert Brecha
                         Bill Hare                             Jessie Granadillos
                         Tina Aboumahboub                      Gaurav Ganti
                         Ilsa Kelischek                        Raghuveer Vyas
                         Carl-Friedrich Schleussner            Michiel Schaeffer

A digital copy of this report along with supporting appendices is available at:
www.climateanalytics.org/publications

This report has been prepared under the project “Pilot Asia-Pacific Climate
Technology Network and Finance Centre”, an initiative of UN Environment and the
Asian Development Bank (ADB), funded by the Global Environment Facility (GEF).

                                Supporting science based policy to prevent dangerous
                                climate change enabling sustainable development

                                www.climateanalytics.org
Key Messages
Climate Change Impacts – Paris Agreement temperature goal matters for Bangladesh
• Bangladesh is one of the most vulnerable countries to climate change in the world.
• Bangladesh is already highly vulnerable to the impacts of climate change at
present level of global warming of about 1°C above pre-industrial levels.
• In a 3°C warmer world, risks related to extreme heat and flooding are projected to
be very high.
• Warming beyond 1.5°C would result in sea level rise of as high as 2.3 m in the long
run.
Bangladesh’s energy system: Large increase in fossil fuel based infrastructure
• The share of fossil fuels in electricity production in Bangladesh is very high; it
increased from 95% to almost 99% between 2000 and 2015. The existing power
plants are mostly oil and gas fired. As oil needs to be imported and local gas
resources are not sufficient to cover increasing demand, Bangladesh is seeking
alternatives to reduce its dependence on oil and gas.
• Increases in capacities for renewable energy technologies have mainly
concentrated on solar PV. To cover the energy demand, Bangladesh is already
importing substantial shares of its power from India.
• The massive expansion of coal power plants under planning is completely
inconsistent with the Paris Agreement, which Bangladesh has signed.
• Expansion of coal-fired power generation is at odds with the goal of stable
electricity provision to underserved communities.
• This expansion risks locking Bangladesh into a carbon-intensive development path,
and will prevent Bangladesh from reaping the benefit of cheap, clean renewable
energy.
Transition to renewable energy offers massive benefits
• Investing in renewable energy capacities can contribute to strengthening energy
independence, leading to lower expenditures on fossil fuel imports.
• The decentralised nature of many renewable energy technologies can foster
progress with regard to energy access and eradication of energy poverty.
• This also contributes to reducing indoor air pollution and related health hazards.
Decarbonising South & South East Asia - Country Profile - Bangladesh 1Targets, projections, and Paris Agreement benchmarks
• Bangladesh’s NDC commits the country to an unconditional emissions reduction
of 5% below Business-as-Usual emissions by 2030. This can rise to 15%, conditional
on international support.
• Current plans to develop domestic coal production, importing LNG to meet
domestic gas demands and expansion of coal-fired power (projected to reach a
share of 35% by 2041) are not in line with the need to decarbonise the energy
system and phase out coal for power generation by 2040, as a Paris Agreement
compatible pathway for South Asia shows.
• There is significant scope to develop an ambitious long-term strategy towards
100% renewable energy power generation and electrification of end-use sectors,
to align Bangladesh’s energy future with the goals of the Paris Agreement and reap
benefits for sustainable development, as well as with the goal of the Climate
Vulnerable Forum (CVF) countries to achieve 100% renewable energy generation
as soon as possible.
Decarbonising South & South East Asia - Country Profile - Bangladesh 2Introduction
Bangladesh is one of the most densely populated countries in the world. As a ‘lower middle income’
country, it faces significant development challenges. Among these is the challenge of providing stable
and universal access to electricity at affordable prices. Bangladesh aims to do this by shifting from an
electricity mix which is dominated by oil and gas, to one which is dominated by coal-fired power
generation.
This risks locking Bangladesh into a carbon intensive development pathway, which fails to recognise the
country’s vulnerability to the impacts of climate change. Bangladesh faces the choice of a development
pathway driven by renewable sources, with significant co-benefits such as reduced pollution related
deaths, or one driven by fossil fuels.
1 Climate Change Impacts: Risks, vulnerability and benefits of
limiting mean temperature rise to 1.5°C
1.1 Present day vulnerabilities and risks
Similar to many countries of the region, Bangladesh is also acutely susceptible to adverse impacts of
climate change. Being a predominately low-lying country, Bangladesh is particularly vulnerable to
increased flooding related to sea level rise and storm surge as presented in Table 1. Bangladesh suffers
the most from tropical cyclones (storms) which have caused highest number of deaths (approx. 150
000) in the past 30 years. In terms of financial damages, floods come up as the most devastating disaster
type resulting in the loss more than 8.5 billion USD as shown in Table 1. Droughts and extreme heat
events also have negative repercussions which are likely to exacerbate in the future. Bangladesh
currently holds 7th position in the list of Germanwatch long-term climate risk index1 (Eckstein et al
2018).
Table 1: Climate disaster statistics for Bangladesh based on EMDAT database2 for the period 1989-2018
Disaster Type Events Count Total Deaths Total affected Damage
(million people) (million US$)
Drought 2 No data 5 No data
Extreme
23 2 474 0.4 No data
temperature
Floods 65 6 067 139.1 8 862.3
Storm 106 149 495 46.1 5 957.7
1 The Germanwatch Global Climate Risk Index is an analysis based on one of the most reliable data sets available on the impacts of
extreme weather events and associated socio-economic data. However, the index must not be mistaken for a comprehensive climate
vulnerability1 scoring. It represents climate-related impacts and associated vulnerabilities but, for example, does not take into account
important aspects such as rising sea-levels, glacier melting or more acidic and warmer seas. https://germanwatch.org/en/cri
2 https://www.emdat.be
Decarbonising South & South East Asia - Country Profile - Bangladesh 31.2 Projections on climate impacts comparing 1.5°C and temperature increase
under current pledges
With a global mean temperature increase of 3°C above pre-industrial levels, corresponding to the
warming projected for current NDCs, risk associated with extreme heat is likely to worsen with
temperature reaching to almost 45°C bearing negative consequences for labour productivity, along with
flooding risks which also show an increase of 8% and 17% in 1.5 and 3°C warmer worlds respectively.
Table 2: Future projections of different climatic variables averaged over Bangladesh, based on an ensemble of CMIP5 Global
Climate Models for 1.5°C and 3°C warmer than pre-industrial worlds 3
Indicator Historical +1.5°C World +3.0°C World
(1986–2015) (Paris Agreement) (Current NDCs)
Annual Averages
Near-Surface
24.75 +1 +2.6
Air Temperature (°C)
Precipitation 1320 mm +2.2% +8%
Extreme Events
Drought:
49.6 -0.7 -1.8
Consecutive drought days (Days)
Heat: Annual Maximum of Daily
42 +1 +2.2
maximum Air Temperature (°C)
Flooding:
Annual Maximum 5-day Consecutive 176.2 +14.8 +30.5
Precipitation (mm)
Table 3: Future projections of Sea Level Rise (cm) as compared to today’s level for Bangladesh based on the data from Robert
Kopp et al. (2014). Average values of 4 tide gauged stations across Bangladesh are presented. The values in the brackets in
the left column are the temperature difference for each future scenario between the end of 21st century (2081-2100) and pre-
industrial period (1850-1900)
Sea Level Rise (cm) 2050 2100 2150 2200
RCP 2.6 (1.6°C) 23 68 100 135
RCP 4.5 (2.4°C) 34 79 122 164
RCP 8.5 (4.3°C) 37 97 159 233
Bangladesh is among the countries which are most susceptible to sea level rise (SLR) due to global
warming. The Paris Agreement limit of 1.5°C would result in substantially lower sea level rise than for
higher levels of warming, in particular in the long run, with a sea level rise of around 2.33m instead of
1.35m by the end of the 22nd century in a 4.3°C world compared to a 1.6°C warmer world (Table 3)4.
Risks that tropical cyclones pose to Bangladesh are projected to increase substantially. Under a 2.4°C
3 The presented values are based on an ensemble of general circulation models (GCMs) from CMIP5 archive. Global Mean Temperature
(GMT) increase of 1.5°C and 3°C above pre-industrial levels are derived for 20-year time slices with the respective mean warming for
each model separately. The warming levels are derived relative to the historical period 1986-2005 and this period is considered to be
0.6°C warmer than pre-industrial levels (1850–1900). For definitions of extremes indicators, please see (Schleussner et al 2016)
4 Due to a lack in the scientific literature, we cannot yet provide projections for a 1.5°C scenario. However, global sea level rise by 2100 is
about 10cm lower under a warming at 1.5°C compared to a 2°C scenario [IPCC 1.5°C Special Report]. Beyond 2100, only limiting
warming to 1.5°C may limit global sea level rise to below 1m,at least 0.5m less than what a 2°C would entail.
Decarbonising South & South East Asia - Country Profile - Bangladesh 4scenario, the number of Category 4 and 5 cyclones will increase by about 130%5. The severity of the
tropical cyclone hazard will be further amplified by increases in extreme precipitation and sea level rise.
2 Socio-economic context
2.1 Economic background
Table 4: Overview on socio-economic characteristics and development over time (Bangladesh)
Indicators on economic and human development Source 2000 2010 Most recent
(2017)
Per capita GDP/capita in current US$ WB-WDI 406 758 1,517
income
GDP/capita adjusting for purchasing
power (in PPP, constant 2011 WB-WDI 1,642 2,443 3,524
international $)
Economic GDP growth rate per capita
WB-WDI 3.3% 4.4% 6.2%
growth (annual, in %)
Human Human Development Index (HDI) 0.608
UNDP 0.468 0.545
development (Rank 136)
Population Population in millions WB-WDI 132 152 165
Notes: PPP – Purchasing Power Parity. GDP – Gross Domestic Product.
Sources: WB-WDI – World Bank World Development Indicators (The World Bank 2019). UNDP – United Nations Development
Program (United Nations Development Program 2018a).
Bangladesh has a population of over 160 million people and is one of the world’s most densely
populated countries. It is classified by the World Bank as a “lower middle-income country” since 2014.
In 2018, Bangladesh for the first time fulfilled all three criteria for graduation from the UN’s list of “Least
developed Countries” (LDC), meaning that it could graduate from the list in 2024 (The World Bank 2018).
Since 2010, Bangladesh has achieved enormous economic growth rates (per capita) of between 4 and
6% (The World Bank 2019). Between 2000 and 2017, Bangladesh has achieved to more than triple its
per capita income (in US$) and more than doubling it in terms of purchasing power parity in the same
period (see Table 4).
Bangladesh also made progress in reducing poverty, decreasing the share of people living in extreme
poverty (with less than 1.90$ (2011 PPP) a day) from almost 35% in 2000 to under 15% in 2016 (The
World Bank 2019). However, in 2016 still over 84% of the people in Bangladesh have been living with
less than 5.50$ (2011 PPP) a day (compared to over 91% in 2000) (The World Bank 2019).
Between 1990 and 2017, Bangladesh has increased its Human Development Index (HDI) value from
0.387 to 0.608, an increase of about 57% (United Nations Development Program 2018b). Bangladesh’s
2017 HDI is below the average of all countries in the HDI-category of ‘medium human development’,
and also below the average for countries in South Asia (United Nations Development Program 2018b).
When Bangladesh’s 2017 HDI value is discounted for inequality, it falls to 0.462, a loss of almost 24%
due to inequality (United Nations Development Program 2018b).
5 Relative to 1986-2005 for the North Indian Ocean basin, from Bhatia K, Vecchi G, Murakami H, et al (2018) Projected Response of
Tropical Cyclone Intensity and Intensification in a Global Climate Model. J Clim 31:JCLI-D-17-0898.1. doi: 10.1175/JCLI-D-17-0898.1
Decarbonising South & South East Asia - Country Profile - Bangladesh 52.2 Energy System status and historic development
Table 5: Energy system indicators for Bangladesh: current status and recent development
Energy system indicators Source 2000 2010 Most recent
Value Year
Primary Energy Energy intensity level of primary
intensity of the energy
WB-WDI* 3.54 3.44 3.01 2017
economy (MJ/$2011 PPP GDP)
(energy / GDP)
Carbon intensity kg CO2 per MJ energy use
WB-WDI 63.89 82.24 86.51 2014
of energy
Carbon emissions t CO2 /population
EDGAR 0.20 0.39 0.46 2016
per capita+
Fossil fuel share Share in total primary energy (%)
WB-WDI 57.94 70.97 73.77 2014
in total energy
Electricity use Electric power consumption (kWh
WB-WDI 101.49 239.83 310.39 2014
per capita)
Fossil fuel share Electricity production from oil, gas
in electricity and coal sources WB-WDI 95.25 98.21 98.77 2015
production (% of total)
Share of coal in Electricity production from coal
electricity sources WB-WDI 0.00 1.89 1.69 2015
production (% of total)
Modern RE share Electricity production from
in electricity renewable sources, excluding
WB-WDI 0.00 0.00 0.27 2015
production hydroelectric
(% of total)
Renewable Installed RE capacity
IRENA
energy capacities (in MW)
Wind (onshore) 0 2 3 2017
Wind (offshore) - - - -
Solar (Concentrated) -
Solar (Photovoltaic) 0 32 176 2017
Biogas 2017
Bioenergy (Solid Biomass) 0 1 5 2017
Hydropower 230 230 230 2017
Geothermal - - - -
Notes:*Calculation of most recent value based on latest available WB-WDI data and growth rates from BP (BP
2018). +CO2 emissions do not include emissions from LULUCF. PPP – Purchasing Power Parity. GDP – Gross
Domestic Product.
Sources: WB-WDI – World Bank World Development Indicators (The World Bank 2019). IRENA – International
Renewable Energy Agency Database (IRENA 2019). EDGAR emissions database (JRC 2016).
Decarbonising South & South East Asia - Country Profile - Bangladesh 6Energy use (total) in Bangladesh has almost doubled between 2000 and 2014 (The World Bank 2019). In per capita terms however, Bangladesh’s energy use has increased by 60% between 2000 and 2014 and was only about 11% of the world average in 2014 and only about a third of the average lower middle income country energy use (The World Bank 2019). Bangladesh has achieved to slightly decrease the energy intensity of its economy between 2000 and 2017, meaning that energy demand grew slower than economic growth. However, its carbon intensity of energy has increased between 2000 and 2014. One reason for this is that Bangladesh’s share of fossil fuel sources in total energy consumption has risen from below 58% in 2000 to almost 74% in 2014. Bangladesh’s CO2 emissions per capita6 have more than doubled from 0.2 to 0.46 metric tons of CO2 per capita between 2000 and 2016 (see Table 5), but remaining very low (less than one tenth) compared to the world’s average of 4.8 tCO2/capita (JRC 2016). Electricity consumption per capita has more than tripled in Bangladesh between 2000 and 2014. With 310 kWh per capita, Bangladesh’s electricity consumption remains comparably low, amounting to below 10% of the world’s average per capita electricity consumption (3,127 kWh/capita) and only 40% of the average electricity consumption of lower middle income countries (767 kWh/capita) in 2014 (The World Bank 2019). The CIA World Factbook estimates that Bangladesh’s electricity consumption has risen to 329.2 kWh/capita in 2016 (CIA 2019). The share of fossil fuels in electricity production in Bangladesh is on a very high level, even increasing from 95% to almost 99% between 2000 and 2015. However, coal so far as played only a minor role in Bangladesh with a share of 1.7% of coal in electricity production in 2015. The existing power plants in Bangladesh are mostly oil and gas fired, but as oil needs to be imported and local gas resources are not sufficient to cover increasing demand, Bangladesh is seeking for alternatives to reduce its dependence on oil and gas (Islam and Khan 2017). So far, the share of electricity produced from renewable sources (excluding hydro) has remained low although slightly increasing from 0% in 2010 to 0.3% in 2015. Also including hydro, the share of RE in total electricity output was only 1.2% in 2015 (The World Bank 2019). Increases in capacities for renewable energy technologies have mainly concentrated on solar PV. To cover the energy demand, Bangladesh is already importing substantial shares of its power from India, recently adding another 500MW increasing overall power imports from India to exceed 1,000MW (Dhaka Tribune 2018). Distribution loss remains an important issue in Bangladesh, although it has achieved to already reduce the share of output lost due to transmission and distribution losses from 15% in 2000 to 11% in 2014 (WDI). In 1990-91, its was at almost 36% (Islam and Khan 2017). 6 Excluding carbon emissions from land-use, land-use change and forestry. Decarbonising South & South East Asia - Country Profile - Bangladesh 7
2.3        Energy system and sustainable development – potential for benefits of a
           transition to renewable energy

Table 6: Indicators showing sustainable development implications of the current energy system and potential for benefits of
a transition to renewable energy (co-benefits) (Bangladesh)

Indicators for co-benefits potential                                              Source             Most recent
                                                                                                  Value          Year
Fuel import                    Share of national income (GDP) spent on fuel
                                                                                WB-WDI+            2.4          2015
dependency                     imports (%)
                               Public expenditures spent on fuel imports (in
                                                                                WB-WDI+            4.6          2015
                               billion current US$)
Reliability of electricity Share of firms experiencing electrical outages
                                                                                 WB WDI           73.4          2013
supply                     (%)
                               Power outages in firms in a typical month
                                                                                 WB WDI            65           2013
                               (number)
                               Share of sales lost for firms subject to power
                                                                                 WB WDI            5.5          2013
                               outages (%)
Access to modern               Share of population with access to electricity
                                                                                 WB WDI           75.9          2016
energy                         (in %)
                               Share of rural population with access to
                                                                                 WB WDI           68.9          2016
                               electricity (in %)
                               Share of urban population with access to
                                                                                 WB WDI           94.0          2016
                               electricity (in %)
                               Share of primary schools with access to             SDG-
                                                                                                  43.3          2016
                               electricity (in %)                                database
                               Share of population with access to clean fuels
                                                                                 WB WDI           17.7          2016
                               or technologies for cooking (in %)
Indoor air pollution           Number of deaths attributed to indoor air           SDG-
                                                                                                   102          2016
and health impacts             pollution* (per 100 000 inhabitants)              database
Outdoor air pollution          Share of population exposed to levels of fine
and health impacts             particulate matter (PM 2.5) exceeding WHO         WB WDI          100.0          2016
                               guidelines (in %)
                               Number of deaths attributed to ambient air          SDG-
                                                                                                   74           2016
                               pollution* (per 100 000 inhabitants)              database

Note: *age standardised mortality rate of WHO. +Own calculations based on WB-WDI. GDP – Gross Domestic Product. WHO –
World Health Organisation.

Sources: WB WDI – World Bank World Development Indicators (The World Bank 2019). SDG-database -Sustainable Development
Goals data base (United Nations 2019).

Due to an expansion of oil-based power plants to cope with ceasing natural gas resources, Bangladesh
has recently turned from a net fuel oil exporting country to a net fuel oil importer, with fuel oil imports
expected to increase by about 25% in 2019 (S&P Global Platts 2018). In 2015, Bangladesh has spent
about 2.4% of its GDP on fuel imports, amounting to public expenditures of about 4.6 billion USD (see
Table 6). Additionally, Bangladesh increasingly relies on large scale electricity imports from India. A

Decarbonising South & South East Asia - Country Profile - Bangladesh                                                     8
transition to renewable energy could contribute to reducing energy security concerns and public expenditures on fossil fuel imports freeing resources for other investments. Lacking reliability of electricity supply is also a serious issue in Bangladesh, affecting private households as well as businesses and industry. Over two thirds of the firms in Bangladesh (73%) report to have been affected by power outages in 2013, with on average 65 outages happening every month (see Table 6). These firms affected by power outages are estimated to have lost a value of about 5.5% of their sales due to the outages. In November 2014, Bangladesh experienced a country wide blackout, forcing hospitals and companies to rely on back-up generators or stop service (Reuters 2014). Decentralized RE technologies can provide an alternative to inefficient fossil fuel based back-up generators. Lack of access to modern energy remains a problem in Bangladesh. Overall, less than 75% of the population had access to electricity in 2016, with 94% in urban areas compared to only 69% in rural areas (see Table 6), leaving about 39 million people without access (ESMAP 2019). Moreover, more than half of all primary schools in Bangladesh had no access to electricity in 2016, affecting developments prospects with regard to education. Renewable energy, especially in the form of mini-grid and off-grid systems such as solar home systems, can provide opportunities for providing access for rural areas (see below). In 2016, the share of people with access to clean cooking fuels was still only 17.7% (see Table 6). leaving more than four fifths of the population exposed to health hazards from indoor air pollution due to the burning of traditional biomass inside of dwellings. Accounting for age structure, about 102out of every 100,000 inhabitants in Bangladesh die due to indoor air pollution. The World Health Organization (WHO) estimated the number of deaths attributed to indoor air pollution in Bangladesh to amount to over 113,000 in 2016 (World Health Organisation 2018). Also, outdoor air pollution is a serious health concern in Bangladesh, especially in urban areas. In 2016, all of Bangladesh’s population was exposed to fine particulate matter concentration levels exceeding recommended limits by the WHO. The number of deaths attributed to outdoor air pollution in Bangladesh is estimated to amount to about 82,000 in 2016 (World Health Organisation 2018) – with about 74 out of 100 000 inhabitants dying because of outdoor air pollution. 3 Policies and projections on future development In its NDC Bangladesh pledged to reduce GHG emissions from the power, transport and industry sectors by 2030 by 5% in comparison to BAU scenario. Conditional upon international assistance, a 15% emissions reduction could be achieved. Also a target of generating 10% of energy from renewable sources by 2020 has been mentioned (MOEF 2015a). In 2016 almost 76% of Bangladesh population had access to electricity, with 94.01% and 68.85% of the urban and rural populations having access to electricity respectively (ESMAP 2019). According to projections from 2010, electricity demand was expected to grow between 7.5 and 16 times between 2005 and 2035 (Mondal et al 2010). Between 2005 and 2016 it has already increased fourfold (Mondal et al 2010, BP 2018). The increasing energy demand is partly the result of subsidized energy costs. In 2016 the subsidies amounted to between USD 500-600 million (The World Bank 2016). The country’s Power System Master Plan (PSMP) published in 2016 by the Bangladeshi Ministry of Power, Energy and Mineral Resources saw the development of domestic coal production infrastructure as a key goal and strategy to reduce dependency on imports and on natural gas. By 2041, 38% of the energy supply was expected to be sourced from natural gas, 25% from oil, 20% from coal, 9% from nuclear sources, 3% from biofuels, and 5% from imports, and only about 197 ktoe from renewable sources (MPEMR 2016). Decarbonising South & South East Asia - Country Profile - Bangladesh 9
BOX: relevant key policies related to energy supply sector

  • Nationally Determined Contribution: Unconditional 5% GHG emissions reductions by 2030, with a
    conditional target of 15%. By 2020, 10% of energy demands are to be renewably sourced (MOEF 2015b).
  • Renewable Energy Policy of Bangladesh 2009: aims to encourage the development of and investment in
    renewable energy technologies for rural and urban energy supply. Renewable sources should meet 10% of
    the total Bangladeshi energy demand by 2020 (IEA 2009).
  • Power System Master Plan 2016: The plan outlines policies and projections until 2041. Aims to develop
    domestic coal production. Importation of LNG to meet domestic gas demands will increase exponentially
    to supply 70% of Bangladeshi gas by 2041. Import 9GW of cross-border energy by 2041 and encourage
    cross-border South Asian energy trade. The plan recommends shifting towards renewable energies when
    the technology has lower investment costs than fossil fuels (MPEMR 2016).

4          Projections on planning for coal
Currently, coal plays a negligible role in Bangladesh’s power mix with a share of only about 2%, with only
561 MW of coal-fired operating capacity. However, the government is betting on coal for meeting the
fast-growing energy needs of the national population and is planning a massive expansion of coal-fired
generation capacity. Motivations for the planned expansion of coal are multiple, but diversification of
the power mix (currently gas dominates with a share of 60%), against the background of decreasing gas
reserves, remains an important policy objective of the country.

    Focus: The Power System Master Plan

    The Power System Master Plan provides projections of the share of coal in the electricity mix until 2041
    (Ministry of Power 2016). The share of coal is projected to see a large rise from just 1.81% in 2017 to 35% by
    2041.

Decarbonising South & South East Asia - Country Profile - Bangladesh                                             10
Figure 1: Bangladesh’s coal fired power generation capacity
Bangladesh’s coal-fired expansion plans amount to nearly 320% of the current capacity7 in the country
(Figure 1). At a global level, this expansion accounts for over 5% of the global coal-fired expansion plans.
While most of the coal plants in the pipeline are super or ultra-super critical, with a lower emission
intensity than the current fleet, construction of these plants would represent substantial additions to
the emissions profile of the country.
.
7 Here, we define current capacity as total operating capacity + capacity under construction, and to expansion plans as planned capacity
(permitted and pre-permitted units that have not started construction) + announced capacity.
Decarbonising South & South East Asia - Country Profile - Bangladesh 11Figure 2: Committed emissions from Bangladesh’s coal plants The committed emissions from the massive expansion of coal-fired power plants in Bangladesh mean that emissions are likely to peak only by 2060, with an eventual phase-out only by 2067 (Figure 2). This far exceeds any Paris Agreement compatible pathway for the energy sector as discussed in Chapter 3, which requires coal-fired power being phased out in South Asia countries by 2040 at the latest. Moreover, as most of the planned fossil fuel generation capacity expansion would rely on fossil fuels imports, the current energy plan would instill a long-term energy dependence. This would make the national economy vulnerable to external shock, and potentially bringing a drag to the current account deficit, eroding the currency, and importing inflation (Buckley et al 2016). Decarbonising South & South East Asia - Country Profile - Bangladesh 12
5 Transition to renewable energy – pathway characteristics,
benchmarks, options, potentials, benefits
5.1 Potential and technology options for renewable energy
.
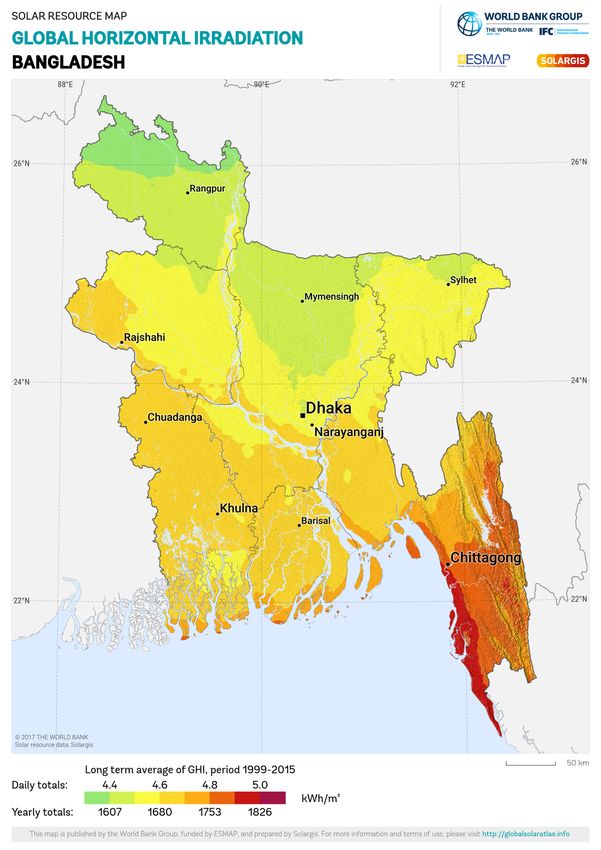
Figure 3. Global horizontal irradiation based on Global Solar Atlas (The World Bank Group 2016)
Decarbonising South & South East Asia - Country Profile - Bangladesh 13Bangladesh has modest solar potential compared to other countries in the region, with the very few
areas receiving over 5 kWh/m2 of average Global Horizontal Irradiance daily. However, covering 1.5%
of Bangladesh’s land area with optimally oriented PV panels could potentially generate 3080 TWh of
electricity, which is equivalent to 7 times the total consumption of electricity in 2016 (NREL 2014, BP
2018). Bangladesh has relatively poor wind potential, with average wind power densities of 145 W/m2
in the top 10% windiest regions in the country.
5.2 Reaping opportunities of transitioning to renewable energy: Implications for
local jobs and affordability of energy
Renewable energy can contribute to addressing several of the socioeconomic challenges Bangladesh is
facing (see section 5.3.3).
Investing in RE capacities can contribute to strengthening energy independence, leading to lower
expenditures on fossil fuel imports, less susceptibility to international market price fluctuations or
geopolitical shocks.
The decentralized nature of many RE technologies can moreover foster progress with regard to energy
access and eradication of energy poverty in Bangladesh, thereby also contributing to reducing indoor
air pollution and related health hazards. Also, outdoor air pollution could be reduced by shifting away
from fossil fuel combustion. Moreover, renewable energy technologies provide opportunities for local
employment.
In a scenario towards 100% renewable energy (Teske et al 2019) Bangladesh is together in a sub-region
with Thailand and Myanmar. By 2030 renewable sources make up two-thirds of electricity supply, and
rise to 80% by 2050, with a decarbonisation of end use sectors.
Decarbonising South & South East Asia - Country Profile - Bangladesh 146 Gap analysis: targets, projections, and Paris Agreement
benchmarks
Bangladesh’s NDC commits the country to an unconditional emissions reduction of 5% below Business-
as-Usual emissions by 2030. This can rise to 15%, conditional on international support.
Current plans to develop domestic coal production, importing LNG to meet domestic gas demands and
expansion of coal-fired power (projected to reach a share of 35% by 2041) are not in line with the need
to decarbonise the energy system and phase out coal for power generation by 2040 as a Paris
Agreement compatible pathway shows for South Asia.
A Paris Agreement consistent pathway shows a complete decarbonisation of the electricity generation
by 2050 and a share of at least 60% of decarbonised electricity generation in 2030. Similarly, in a
scenario towards 100% renewable energy described in chapter 2 (Teske et al 2019), where Bangladesh
is together in a sub-region with Thailand and Myanmar. By 2030 renewable sources make up two-thirds
of electricity supply, and rise to 80% by 2050, with a decarbonisation of end use sectors.
This shows there is significant scope to develop an ambitious long-term strategy towards 100%
renewable energy power generation and electrification of end-use sectors, to align Bangladesh’s energy
future with the goals of the Paris Agreement and reap benefits for sustainable development, and also
align them with the goal of the Climate Vulnerable Forum (CVF) countries to achieve 100% renewable
energy generation as soon as possible.
Decarbonising South & South East Asia - Country Profile - Bangladesh 15Literature
BP 2018 BP Statistical Review of World Energy 2018 Online: https://www.bp.com/content/dam/bp/business-
sites/en/global/corporate/pdfs/energy-economics/statistical-review/bp-stats-review-2018-full-report.pdf
Buckley T, Nicholas S and Ahmed S J 2016 Bangladesh Electricity Transition: A Diverse, Secure and Deflationary Way Forward
Online: http://ieefa.org/wp-content/uploads/2016/11/Bangladesh-Electricity-Transition_-NOVEMBER-2016.pdf
CIA 2019 The World Factbook Online: https://www.cia.gov/library/publications/the-world-factbook/geos/pp.html
Dhaka Tribune 2018 500MW electricity from India starting June 2018 Online:
https://www.dhakatribune.com/bangladesh/power-energy/2018/05/17/500mw-to-be-imported-from-india-in-june
Eckstein D, Hutfils M-L and Winges M 2018 Global Climate Risk Index 2019. Who Suffers Most From Extreme Weather Events?
Weather-related Loss Events in 2017 and 1998 to 2017
ESMAP 2019 Tracking SDG7 | Progress Towards Sustainable Energy Online: http://trackingsdg7.esmap.org/
IEA 2009 Renewable Energy Policy of Bangladesh
IRENA 2019 IRENA Dashboard - RE database Online: http://resourceirena.irena.org/gateway/dashboard/
Islam S and Khan M Z R 2017 A Review of Energy Sector of Bangladesh Energy Procedia 110 611–8 Online:
https://www.sciencedirect.com/science/article/pii/S1876610217302230
JRC 2016 EDGARv.4.3.2 - Fossil CO2 and GHG emissions of all world countries Janssens-Maenhout, G., Crippa, M., Guizzardi,
D., Muntean, M., Schaaf, E., Olivier, J.G.J., Peters, J.A.H.W., Schure, K.M Online:
edgar.jrc.ec.europa.eu/booklet2017/EDGARv432_FT2016_CO2_per_capita_emissions_1970-2016.csv
Ministry of Power E and M R 2016 Power System Master Plan Online:
https://powerdivision.portal.gov.bd/sites/default/files/files/powerdivision.portal.gov.bd/page/4f81bf4d_1180_4c53_b
27c_8fa0eb11e2c1/(E)_FR_PSMP2016_Summary_revised.pdf
MOEF 2015a Intended Nationally Determined Contributions (INDC) Online:
https://www4.unfccc.int/sites/ndcstaging/PublishedDocuments/Bangladesh First/INDC_2015_of_Bangladesh.pdf
MOEF 2015b Intended Nationally Determined Contributions (INDC)
Mondal M A H, Boie W and Denich M 2010 Future demand scenarios of Bangladesh power sector Energy Policy 38 7416–26
Online: http://dx.doi.org/10.1016/j.enpol.2010.08.017
MPEMR 2016 Power System Master Plan 2016
NREL 2014 Solar Resources by Class and Country Online: https://openei.org/doe-opendata/dataset/solar-resources-by-class-
and-country/resource/3e72f32a-7de1-4e5d-a25a-76928769625f
Reuters 2014 UPDATE 2-Bangladesh power cut plunges millions into darkness Online:
https://www.reuters.com/article/bangladesh-power-failure-idUSL4N0SR0AT20141101
S&P Global Platts 2018 Analysis: Bangladesh’s fuel oil imports to grow 25% in 2019 on new power capacity Online:
https://www.spglobal.com/platts/en/market-insights/latest-news/oil/110118-analysis-bangladeshs-fuel-oil-imports-
to-grow-25-in-2019-on-new-power-capacity
Schleussner C-F, Lissner T K, Fischer E M, Wohland J, Perrette M, Golly A, Rogelj J, Childers K, Schewe J, Frieler K, Mengel M,
Hare W and Schaeffer M 2016 Differential climate impacts for policy relevant limits to global warming: the case of
1.5°C and 2°C Earth Syst. Dyn. 7 327–51 Online: http://www.earth-syst-dynam.net/7/327/2016/
Teske S, Meinshausen M and Dooley K 2019 Achieving the Paris Climate Agreement Goals
The World Bank 2016 Bangladesh: Ensuring a Reliable and Quality Energy Supply Online: http://projects-
beta.worldbank.org/en/results/2016/10/07/bangladesh-ensuring-a-reliable-and-quality-energy-supply
The World Bank 2018 Country Overview - Bangladesh Online: https://www.worldbank.org/en/country/bangladesh/overview
The World Bank 2019 World Development Indicators database Online:
https://databank.worldbank.org/data/reports.aspx?source=world-development-indicators
United Nations 2019 Sustainable Development Goals database Online: https://unstats.un.org/sdgs/indicators/database/
United Nations Development Program 2018a Human Development Index database Online: http://hdr.undp.org/en/data#
United Nations Development Program 2018b Human Development Indices and Indicators: 2018 Statistical Update -
Bangladesh Online: http://hdr.undp.org/sites/all/themes/hdr_theme/country-notes/BGD.pdf
World Health Organisation 2018 Global Health Observatory data repository Online:
http://apps.who.int/gho/data/node.main.BODAMBIENTAIR?lang=en;
Decarbonising South & South East Asia - Country Profile - Bangladesh 16You can also read