Fiber-coupled light-emitting diodes (LEDs) as safe and convenient light sources for the characterization of optoelectronic devices version 1; ...
←
→
Page content transcription
If your browser does not render page correctly, please read the page content below
Open Research Europe                                                        Open Research Europe 2021, 1:98 Last updated: 23 AUG 2021

METHOD ARTICLE

Fiber-coupled light-emitting diodes (LEDs) as safe and
convenient light sources for the characterization of
optoelectronic devices [version 1; peer review: awaiting peer
review]
Jorge Quereda 1, Quinghua Zhao2, Enrique Diez1, Riccardo Frisenda2,
Andrés Castellanos-Gomez 2
1Nanotechnology Group, USAL–Nanolab, Univesidad de Salamanca, Salamanca, Junta de Castilla y León, 37007, Spain
2Materials Science Factory, Instituto de Ciencia de Materiales de Madrid (ICMM-CSIC), Madrid, Madrid, 28049, Spain

v1   First published: 23 Aug 2021, 1:98                                         Open Peer Review
     https://doi.org/10.12688/openreseurope.14018.1
     Latest published: 23 Aug 2021, 1:98
     https://doi.org/10.12688/openreseurope.14018.1                             Reviewer Status AWAITING PEER REVIEW

                                                                                Any reports and responses or comments on the

Abstract                                                                        article can be found at the end of the article.
Optoelectronic device characterization requires to probe the electrical
transport changes upon illumination with light of different incident
powers, wavelengths, and modulation frequencies. This task is
typically performed using laser-based or lamp + monochromator-
based light sources, that result complex to use and costly to
implement. Here, we describe the use of multimode fiber-coupled
light-emitting diodes (LEDs) as a simple, low-cost alternative to more
conventional light sources, and demonstrate their capabilities by
extracting the main figures of merit of optoelectronic devices based
on monolayer MoS2, i.e. optical absorption edge, photoresponsivity,
response time and detectivity. The described light sources represent
an excellent alternative for performing optoelectronic characterization
experiments on a limited budget.

Keywords
Optoelectronics, Photocurrent spectroscopy, 2D materials

                This article is included in the Excellent Science
                gateway.

                                                                                                                         Page 1 of 10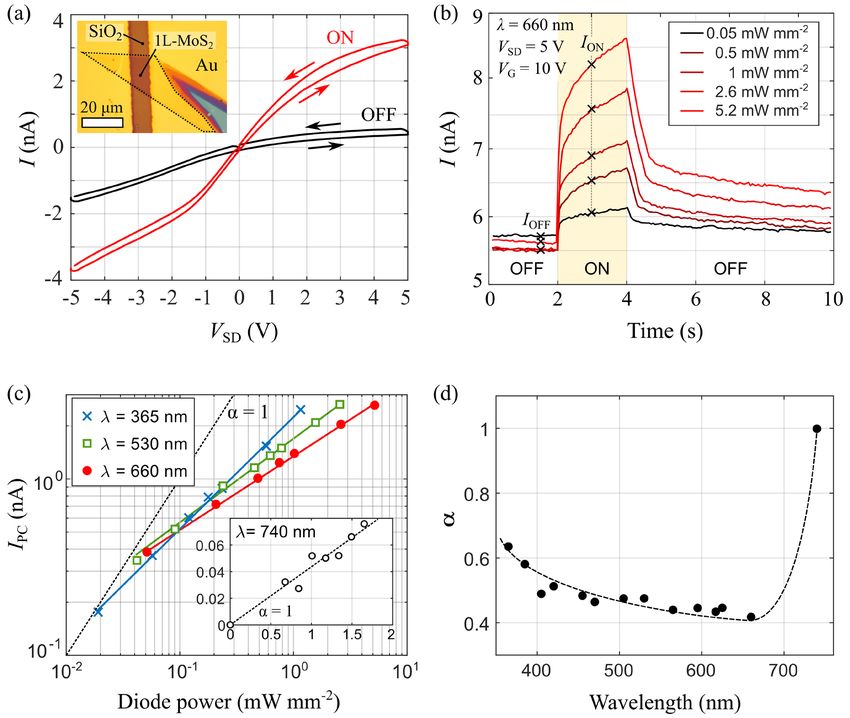
Open Research Europe                                                               Open Research Europe 2021, 1:98 Last updated: 23 AUG 2021

 Corresponding authors: Jorge Quereda (berneke@gmail.com), Andrés Castellanos-Gomez (andres.castellanos@csic.es)
 Author roles: Quereda J: Data Curation, Formal Analysis, Funding Acquisition, Investigation, Methodology, Software, Writing – Original
 Draft Preparation, Writing – Review & Editing; Zhao Q: Investigation, Writing – Original Draft Preparation; Diez E: Funding Acquisition,
 Supervision, Writing – Review & Editing; Frisenda R: Data Curation, Formal Analysis, Investigation, Software, Supervision, Writing –
 Original Draft Preparation, Writing – Review & Editing; Castellanos-Gomez A: Conceptualization, Funding Acquisition, Investigation,
 Methodology, Supervision, Validation, Writing – Original Draft Preparation, Writing – Review & Editing
 Competing interests: No competing interests were disclosed.
 Grant information: This project has received funding from the European Research Council (ERC) under the European Union's Horizon
 2020 research and innovation program (grant agreement No 755655) and the Ministry of Science and Innovation (Spain) through the
 project PID2020-115566RB-I00. The authors extend their sincere appreciation to the Distinguished Scientist Fellowship Program (DSFP)
 at King Saud University for funding of this work. R.F. acknowledges the support from the Spanish Ministry of Economy, Industry and
 Competitiveness (MINECO) through a Juan de la Cierva-formación fellowship 2017 FJCI-2017-32919. Q.H.Z. acknowledges the grant from
 China Scholarship Council (CSC) under No. 201706290035. J.Q. and E.D. acknowledge financial support from the Agencia Estatal de
 Investigación of Spain (Grants PID2019-106820RB, RTI2018-097180-B-100, and PGC2018-097018-B-I00) and the Junta de Castilla y León
 (Grants SA256P18 and SA121P20), including funding by ERDF/FEDER. J.Q. acknowledges financial support from MICINN (Spain) through
 the programme Juan de la Cierva-Incorporación.
 The funders had no role in study design, data collection and analysis, decision to publish, or preparation of the manuscript.
 Copyright: © 2021 Quereda J et al. This is an open access article distributed under the terms of the Creative Commons Attribution
 License, which permits unrestricted use, distribution, and reproduction in any medium, provided the original work is properly cited.
 How to cite this article: Quereda J, Zhao Q, Diez E et al. Fiber-coupled light-emitting diodes (LEDs) as safe and convenient light
 sources for the characterization of optoelectronic devices [version 1; peer review: awaiting peer review] Open Research Europe
 2021, 1:98 https://doi.org/10.12688/openreseurope.14018.1
 First published: 23 Aug 2021, 1:98 https://doi.org/10.12688/openreseurope.14018.1

                                                                                                                                 Page 2 of 10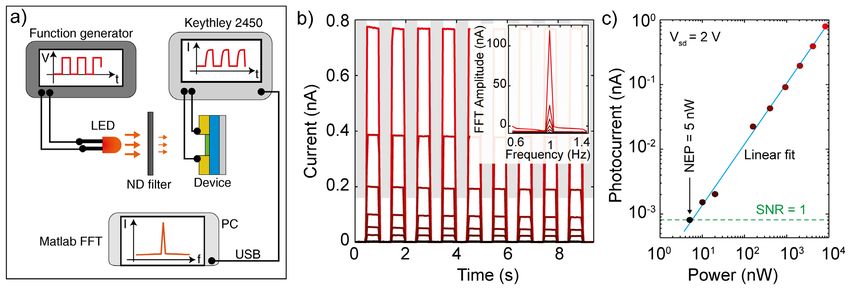
Open Research Europe 2021, 1:98 Last updated: 23 AUG 2021
Plain language summary extract these parameters at different wavelengths allows us to
In this work we present a low-cost light source based on light- accurately characterize the responsivity spectrum of the device,
emitting diodes (LEDs) for its use in measurement systems even when using other lights sources with a non-constant
for characterization of photodetectors. The reduced cost and spectral power density.
ease of use of the proposed light source makes it ideal for
device characterization experiments on a limited budget. The presented fiber-coupled LEDs are rather inexpensive,
if compared with laser systems, and are modular making it
Introduction possible to improve the system little by little. We hope that
The scientific activity on optoelectronics has grown stead- this Method article can be of interest of the researchers that
ily over the last decades thanks to the discovery of novel prom- are setting up their laboratories, especially those running
ising materials such as two-dimensional transition metal under a tight budget.
dichalcogenides1–7, perovskites8–14, etc. Indeed, according to
the Dimensions database, the number of scientific publica- Methods
tions in this field has grown from roughly 4000 articles per Fiber-coupled LED light sources
year in 1990 to more than 60000 in 2020. Our LED light sources are based on the Thorlabs MXXXF
fiber-coupled LEDs, the Thorlabs LEDD1 controller and a pro-
To characterize the main figures of merit of optoelectronic grammable bench power supply (TENMA 72-2705). Figure 1a
devices accurately and quantitatively, it is necessary to probe shows a picture of several LEDs sources with their control-
the electrical transport changes upon illumination with light lers, mounted on dedicated breadboards that can be moved
of different incident powers, wavelengths, and modulation around the laboratory. Table 1 summarizes the different com-
frequencies, which typically require the use of specialized ponents used for the assembly of our fiber-coupled LEDs
light sources. In most laboratories, free-space laser sources based light sources. Note that one can decide the number of
are commonly used to characterize the response to light of different LED modules to add, with an average total cost of
the fabricated devices. While these light sources present sev- ~800€ per LED with different wavelengths. To illuminate
eral advantages (e.g., they are very bright, and have very our devices, a multimode optical fiber is attached to the LED
well-defined wavelengths) they also have some shortcomings source of the desired wavelength and the other end of the
(high cost, safety issues, speckle, and restringing mounting fiber is attached to a lens system placed above the optoelec-
conditions amongst others). Moreover, to achieve the required tronic device under study. By placing the core of the fiber at
functionality, laser-based or lamp + monochromator-based the image plane of the lens system we project an image of
testing setups usually must be combined with additional the core onto the device under study. Unlike with focused
optical elements, such as neutral density filters to change the free-space laser sources, this method yields circular spots
intensity of the incident light or mechanical choppers to mod- with homogeneous power density and (because of the use of
ulate the incident signal in time, adding to their prize and incoherent sources) speckle-free15. This is highly desirable
complexity of usage. Therefore, an alternative cost-efficient to facilitate the calculation of the incident power and thus to
light source, fiber-coupled, without speckle and with a fully accurately determine the figures of merit of photodetectors.
voltage-based adjustment of the illumination intensity and
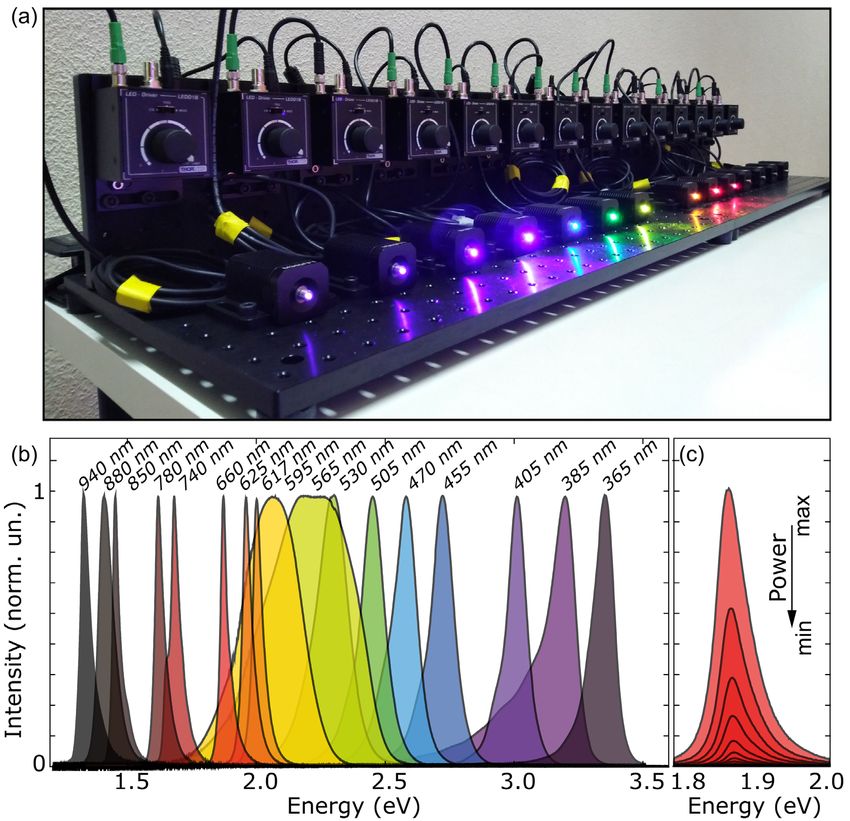
modulation frequency would be highly desirable. Figure 1b shows the individual spectra of the 17 LED
sources, spanning the spectral range from 365 nm to 940 nm.
In our laboratory we started seven years ago to employ multi- Each of the LEDs emits light at a different, narrow, spectral
mode fiber-coupled light emitting diode (LED) sources to test window, with full-width-at-half-maximum ranging from
optoelectronic devices and they have proven to be a very con- ~10 nm to ~100 nm (depending on the wavelength, the typi-
venient alternative to the commonly used free-space laser or cal value is ~30 nm). The intensity of the emitted light can
lamp based light sources. In fact, we have found that these be tuned, either manually or via an external voltage input.
light sources are very simple to operate and can be readily Figure 1c shows the spectral emission profile of an individual
used to extract figures-of-merit of 2D based photodetectors, LED at different operation powers. While the spectral pro-
without presenting the safety issues associated to the use of file slightly changes with the power, the emission peak remains
free-space high power collimated laser beams. During this stable within a 5 meV range.
time, we have also seen that their use is not widely spread,
at least in the community working on 2D materials based Results
optoelectronic devices, motivating us to write this paper. Device fabrication and optoelectronic response
In the following, we demonstrate the capabilities of the LED
In this work, we thoroughly describe the use of fiber-coupled light sources by performing a step-by-step characteriza-
LED light sources to extract the different figures of merit of tion of a single-layer (1L) MoS2 phototransistor. The device
photodetector devices. We illustrate their use by character- is fabricated by standard mechanical exfoliation of monolayer
izing a single-layer MoS2 photodetector and show how one MoS2 crystals with Nitto SPV-224PR-MJ tape and Gel-Film
can easily extract relevant optoelectronic parameters such as WF X4 (by Gelpak) tape, and ulterior transfer onto a SiO2/Si
the response time, photocurrent power dependence, responsiv- substrate with prepatterned Ti/Au electrodes, following the
ity and detectivity. The capability of the system to accurately deterministic transfer technique described in references16–18.
Page 3 of 10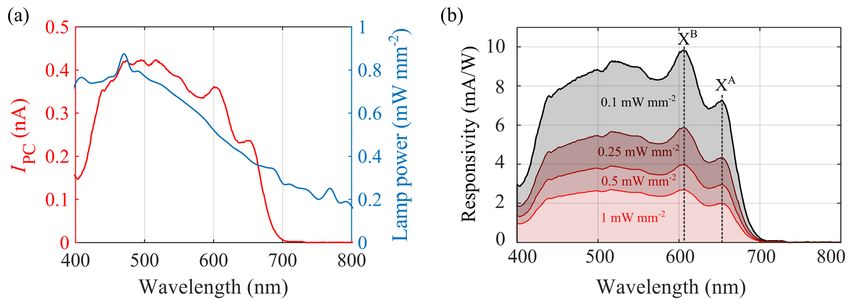
Open Research Europe 2021, 1:98 Last updated: 23 AUG 2021

Figure 1. Bench with an assemble of fiber-coupled light-emitting diodes (LEDs). (a) Picture of an illumination system implemented
with 14 different fiber-coupled LEDs with their power supplies. (b) Spectra of 17 different LED light sources used in our laboratory.
(c) Spectra of a 660 nm LED source at different biasing conditions to control the intensity of the out-coming light.

Table 1. List of required components for the assembly of the fiber-coupled light emitting diodes (LEDs) based light sources.

                      Code                                     Description                                 Unitary price     Units    Total price

                    MB3060/M   Aluminum Breadboard, 300 mm x 600 mm x 12.7 mm, M6 Taps                        248.11 €          1       248.11 €

                    MB1560/M   Aluminum Breadboard, 150 mm x 600 mm x 12.7 mm, M6 Taps                        143.25 €          1       143.25 €

                    AP90L/M    Large Right-Angle Mounting Plate, M6 x 1.0 Compatible                          149.46 €          1       149.46 €

                      RDF1     Rubber Damping Feet, Set of 4                                                    4.92 €          1        4.92 €
 UV to BLUE bench

                    M365FP1    365 nm, 9.8 mW (Min) Fiber-Coupled LED, 1400 mA, SMA                           601.99 €          1       601.99 €

                    M385FP1    385 nm, 18 mW (Min) Fiber-Coupled LED, 1400 mA, SMA                            601.99 €          1       601.99 €

                    M405FP1    405 nm, 19.3 mW (Min) Fiber-Coupled LED, 1400 mA, SMA                           601.99           1        601.99

                     M420F2    Violet (420 nm) Fiber-Coupled LED, SMA, 1000 mA, 8.90 mW (Min)                 394,20 €          1       394,20 €

                     M455F1    455 nm, 17 mW (Min) Fiber-Coupled LED, 1000 mA, SMA                            388,55 €          1       388.55 €

                     KPS101    15 V, 2.4 A Power Supply Unit with 3.5 mm Jack Connector for One K- or          32.14 €          5       160.70 €
                               T-Cube

                     LEDD1B    T-Cube LED Driver, 1200 mA Max Drive Current (Power Supply Not Included)       294.11 €          5      1 764.66 €

                                                                                                                                        Page 4 of 10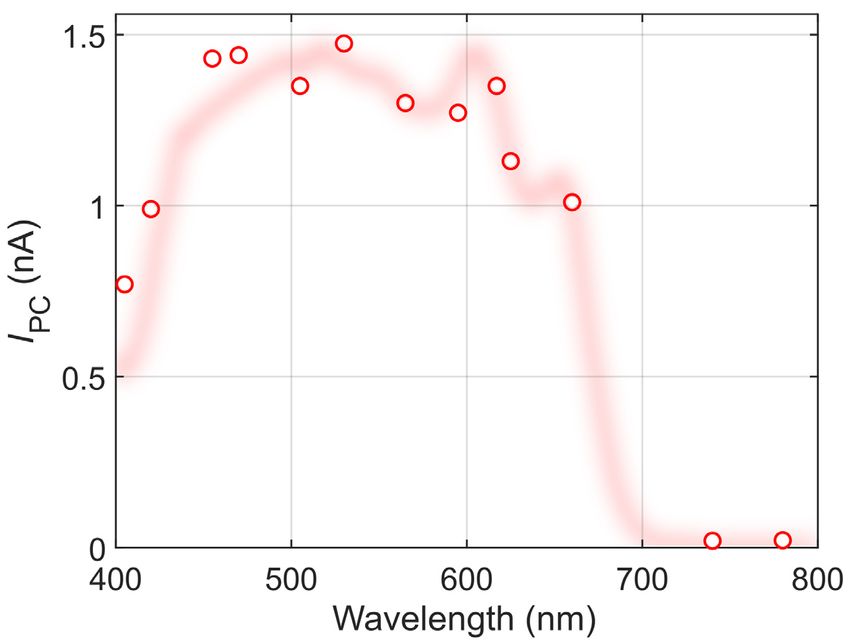
Open Research Europe 2021, 1:98 Last updated: 23 AUG 2021

                        Code                                     Description                                  Unitary price     Units    Total price

                      MB3060/M   Aluminum Breadboard, 300 mm x 600 mm x 12.7 mm, M6 Taps                         248.11 €          1       248.11 €

                      MB1560/M   Aluminum Breadboard, 150 mm x 600 mm x 12.7 mm, M6 Taps                         143.25 €          1       143.25 €

                      AP90L/M    Large Right-Angle Mounting Plate, M6 x 1.0 Compatible                           149.46 €          1       149.46 €

                        RDF1     Rubber Damping Feet, Set of 4                                                     4.92 €          1        4.92 €

                       M470F1    Blue (470 nm) Fiber-Coupled LED, SMA, 1000 mA, 8.0 mW (Min)                     339,30 €          1       339.30 €
  BLUE to RED bench

                       M505F1    Cyan (505 nm) Fiber-Coupled LED, SMA, 1000 mA, 7.0 mW (Min)                     339,30 €          1       339.30 €

                       M530F2    530 nm, 6.8 mW (Min) Fiber-Coupled LED, 1000 mA, SMA                            371,82 €          1       371.82 €

                       M565F3    565 nm, 9.9 mW (Min) Fiber-Coupled LED, 700 mA, SMA                             410.09 €          1       410.09 €

                       M595F2    595 nm, 8.7 mW (Min) Fiber-Coupled LED, 1000 mA, SMA                            360,99 €          1       360.99 €

                       M617F2    617 nm, 10.2 mW (Min) Fiber-Coupled LED, 1000 mA, SMA                           371,82 €          1       371.82 €

                       M625F2    625 nm, 13.2 mW (Min) Fiber-Coupled LED, 1000 mA, SMA                           360.99 €          1       360.99 €

                       KPS101    15 V, 2.4 A Power Supply Unit with 3.5 mm Jack Connector for One K- or           32.14 €          7       224.98 €
                                 T-Cube

                       LEDD1B    T-Cube LED Driver, 1200 mA Max Drive Current (Power Supply Not                  294.11 €          7      2 058.77 €
                                 Included)

                        Code                                     Description                                  Unitary price     Units    Total price

                      MB3060/M   Aluminum Breadboard, 300 mm x 600 mm x 12.7 mm, M6 Taps                         248.11 €          1       248.11 €

                      MB1560/M   Aluminum Breadboard, 150 mm x 600 mm x 12.7 mm, M6 Taps                         143.25 €          1       143.25 €

                      AP90L/M    Large Right-Angle Mounting Plate, M6 x 1.0 Compatible                           149.46 €          1       149.46 €

                        RDF1     Rubber Damping Feet, Set of 4                                                     4.92 €          1        4.92 €

                       M660F1    Deep Red (660 nm) Fiber-Coupled LED, SMA, 1000 mA, 13.0 mW (Min)                339,30 €          1       339.30 €
 RED to NIR bench

                       M740F2    740 nm, 4.1 mW (Min) Fiber-Coupled LED, 800 mA, SMA                             426,88 €          1       426.88 €

                       M780F2    780 nm, 5.5 mW (Min) Fiber-Coupled LED, 800 mA, SMA                             378,70 €          1       378.70 €

                       M850F2    IR (850 nm) Fiber-Coupled LED, SMA, 1000 mA, 10.5 mW (Min)                      339,30 €          1       339.30 €

                       M880F2    IR (880 nm) Fiber-Coupled LED, SMA, 1000 mA, 10.5 mW (Min)                      378,70 €          1       378.70 €

                       M940F3    940 nm, 10 mW (Min) Fiber-Coupled LED, 1000 mA, SMA                             363.60 €          1       363.60 €

                      M1050F1    1050 nm, 1.1 mW (Min) Fiber-Coupled LED, 700 mA, SMA                            426,88 €          1       426.88 €

                       KPS101    15 V, 2.4 A Power Supply Unit with 3.5 mm Jack Connector for One K- or           32.14 €          7       224.98 €
                                 T-Cube

                       LEDD1B    T-Cube LED Driver, 1200 mA Max Drive Current (Power Supply Not                  294.11 €          7      2 058.77 €
                                 Included)

The resulting device is showed in the inset of Figure 2a19.                        due to the presence of Schottky barriers at the Au/MoS2 inter-
The main panel in Figure 2a shows two current vs. voltage                          faces. Upon illumination, the drain-source current I increases
(I-V hereafter) characteristics of the 1L-MoS2 device, acquired                    by an amount IPC due to photoconductivity.
in the dark (black) and under homogeneous illumination
with λ = 660 nm, a power density PD = 5.2 mW mm–2 and a                            Figure 2b shows the time evolution of the drain-source cur-
spot of 375 µm in diameter (red). The I-V curves are nonlinear                     rent, registered while turning the illumination on and off with a

                                                                                                                                           Page 5 of 10
Open Research Europe 2021, 1:98 Last updated: 23 AUG 2021

Figure 2. Optoelectronic response of the 1L-MoS2 transistor. (a) I-V characteristics of the device at Vg = 0 V, measured in the dark
(black) and upon illumination with λ = 660 nm and PD = 5.2 mW mm–2. Arrows indicate the voltage ramping direction. Inset: Optical image
of the device. (b) Drain-source current I measured at VSD = 5 V and VG = 10 V while switching the illumination on and off at different light
power densities. (c) Power dependence of the photocurrent IPC at three different illumination wavelengths. IPC is measured as the difference
between the drain-source current one second after (ION) and immediately before (IOFF) turning on the illumination. Solid lines are fittings to
equation IPC ∝ Pα. For reference, the slope corresponding to α = 1 is showed as a black, dashed line. (d) Wavelength dependence of the α
parameter, extracted from the fittings to Equation 1. The dashed line is a smoothed interpolation of the experimental data.

computer by using the external modulation port of the                    recover the original “off” current IOFF. The photocurrent IPC is
LEDD1 controller and the TENMA Programmable Bench                        then calculated as the difference between the current ION, reg-
Power Supply to turn on and off the LED source. As further               istered 1 second after the light is turned on, and IOFF, measured
discussed below, the optoelectronic response of the device               immediately before exposure to light.
is dominated by photogating, resulting in a slow photore-
sponse, which takes several seconds to stabilize after the               The measurements from Figure 2b allow us to estimate the
light is switched on. The different curves shown in the figure           response time of the device, as discussed in Supplementary
correspond to consecutive measurements acquired for increas-             Note 3 in the extended data21. For our 1L-MoS2 device we
ing illumination power densities. For completeness, we pro-              get a rise time of tR = 2.1 s and a much longer fall time tF = 20.2 s.
vide the Matlab script used to acquire these measurements on
Zenodo20. For each measurement, the sample is exposed to                 Note that the possibility of adjusting the power density of the
light for 2 seconds and then kept in the dark for 30 seconds to          incident light with a software makes it possible to quickly

                                                                                                                                   Page 6 of 10
Open Research Europe 2021, 1:98 Last updated: 23 AUG 2021
measure the power dependence of the photogenerated cur- trivially obtain the wavelength-dependent responsivity R(λ)
rent at many different wavelengths. This task can be very tedi- from photocurrent spectra such as the one from Figure 3a by
ous for systems requiring the use of a manually-operated neutral simply dividing IPC by the spectral density of the lamp Plamp
density filter wheel to modify the incident power density. (λ) for each given wavelength. However, the situation is more
complex for α ≠ 1, as in this case the responsivity depends
In monolayer MoS2 phototransistors, photoconductivity typi- nonlinearly on the illumination power:
cally originates from two main mechanisms: photogating and
photoconductive effect. These two mechanisms can be dis- I PC ( λ ) α ( λ ) −1
R(λ , P) = = R0 ( λ ) × P . (2)
tinguished by their different dependence on the illumination P
power density22–24. The typical procedure consists on fitting the
Thus, after measuring IPC as a function of λ, one also needs
measured photocurrent to the phenomenological equation
to know the wavelength dependence of the power α, which
can be easily done using the presented LED light sources.
I PC = R0 × Pα , (1)
Then, the device responsivity (at a given power P) can be
obtained as
Where R0 and α are fitting parameters. As a general rule, α = 1
in devices which photoresponse is dominated by the photo- α(λ)
I (λ ) P
conductive effect, and α < 1 for photogating22,24–27. Figure 2c R ( λ , P ) = PC . (3)
shows the power dependence of IPC for different illumination P Plamp ( λ )
wavelengths, λ. The resulting values of α are presented in
Figure 2d as a function of λ. For illumination wavelengths Figure 3b shows the resulting responsivity spectra for four
lower than 700 nm (i.e. for photon energies larger than the different illumination power densities P = 0.1, 0.25, 0.5 and
optical bandgap of 1L-MoS2) IPC depends sublinearly on the 1 mW mm-2. Note that, since in our device we get α < 1, the
illumination power, and we get α ≈ 0.5. For λ > 700 nm the responsivity is larger for smaller values of P.
photoresponse decreases abruptly and the power dependence
of IPC becomes linear, suggesting a different photoresponse Note that the fiber-coupled LEDs can also be used as a stan-
mechanism for sub-bandgap energy photons. dalone light source to characterize the basic spectral behav-
ior of a given material/device. As an example, Figure 4
Responsivity spectrum shows the wavelength dependence of the photocurrent in the
The capability of the LED light sources to provide a spec- 1L-MoS2 device, measured using the different LEDs at a fixed
trum of α as a function of wavelength (Figure 2d) can also be power density of 1 mW mm-1. The resulting pseudospec-
exploited to correct the spectra measured with other light trum could be used, for example, to estimate the absorption
sources with non-flat spectral power density. Figure 3a shows edge of 1L-MoS2 within ~ 30 nm accuracy.
a photocurrent spectrum of the 1L-MoS2 device, obtained
using a wavelength-tunable Xenon light source (Bentham Characterization of device detectivity
TLS120Xe). As also showed in the Figure, the spectral Apart from the responsivity, another figure-of-merit widely
density of the light source, Plamp (λ), is not homogeneous used in the characterization of photodetectors is the specific
throughout the whole spectral range, which introduces distor- detectivity D*26,28,29. This quantity characterizes the perform-
tions in the measured spectral profile of IPC. For linear opto- ances of a photodetector in detecting small signals. Figure 5a
electronic devices, where α = 1 (see Equation 1), one can shows a schematic of the experimental setup used to assess this
Figure 3. Responsivity spectra of the 1L-MoS2 device. (a) Spectral dependence of IPC (red line, left axis) and Plamp(blue line, right axis)
(b) Responsivity spectra calculated by inserting the experimentally measured values of IPC(λ), Plamp(λ) and α(λ) into Equation 3 for four different
values of the power density P.
Page 7 of 10Open Research Europe 2021, 1:98 Last updated: 23 AUG 2021
Figure 4. Photocurrent pseudospectrum of the 1L-MoS2 device, measured using the LED light sources at a fixed power density
of 1 mW mm-2, as a function of their nominal wavelength. The shaded red line shows the full photocurrent spectrum as a guide to
the eye.
Figure 5. (a) Schematic of the experimental configuration to extract the detectivity of a device. (b) Current versus time traces recorded on
a Au-InSe-Au photodetector at a source drain voltage of 2 V while applying a 660 nm square wave modulated illumination with frequency 1
Hz. The different colors represent different illumination powers (achieved by reducing the intensity of the excitation using ND filters. Inset:
fast fourier transform (FFT) of the current vs time traces. (c) Photocurrent of the device (extracted from the amplitude of the FFT at 1 Hz) as a
function of illumination power. The blue line is a linear fit to the data and the green dashed line indicates the noise level of the setup, which
correspond to a signal-to-noise ratio (SNR) equal to 1.
figure-of-merit. We connect a function generator to a LED the device under test and use a set of ND filters (from OD
source and modulate the light intensity through a square wave, 0.3 to OD 4.0) to vary the intensity of the light. We record
effectively turning on and off the illumination at a certain a set of current vs time traces, one for each illumination
frequency ν (typically 1 Hz). We then shine the light onto power. By computing the fast fourier transform (FFT) of
Page 8 of 10Open Research Europe 2021, 1:98 Last updated: 23 AUG 2021
each trace in Matlab, we can extract the response of the devices such as response time, responsivity, optical absorp-
device at that power by extracting the amplitude of the FFT tion edge and detectivity. The stability, homogeneous power
at the frequency ν. From this one can find the noise equiva- density and absence of speckle makes these light sources
lent power of the device (NEP), which can then used to calcu- especially well-suited for characterizing the power depend-
late the specific detectivity D* = Af , where A is the area of ence of photoresponse in optoelectronic devices. Furthermore,
NEP they can even be used in combination with low-cost power
the device and f is the bandwidth. sources for automated measurement. Thus, we believe that
these light sources are an excellent alternative for perform-
Figure 5b shows a set of current vs time traces recorded on ing optoelectronic characterization experiments on a limited
a back-to-back Schottky diode realized by transferring an budget.
InSe multilayer flake bridging two gold electrodes depos-
ited onto a SiO2 –Si substrate (see Supporting Note 4 for a Data availability
picture of the device). The curves have been measured by Underlying data
applying a source drain voltage of 2 V while turning on and Zenodo: Fiber-coupled LEDs as safe and convenient light
off the 660 nm illumination with a frequency of 1 Hz and sources for the characterization of optoelectronic devices.
different illumination powers (from 10 μW, red curve, to 5 https://doi.org/10.5281/zenodo.515360419.
nW, black curve). The fourier transforms of these traces,
shown in the inset of Figure 5b, present a series of peaks at Extended data
the odd harmonics of the fundamental frequency of 1 Hz. By Zenodo: Supplementary Information to: Fiber-coupled LEDs
extracting the area of the 1 Hz peak and plotting it as a func- as safe and convenient light sources for the characteriza-
tion of the illumination power we can extract the NEP of tion of optoelectronic devices. https://doi.org/10.5281/zenodo.
our device. Figure 5c shows the photocurrent amplitude extracted 516697321.
from the FFT transforms in Figure 5b as a function of illu-
mination power in a double logarithmic plot. The data fol- This project contains the following extended data:
low a linear trend indicating that the photocurrent and the - AlphaSpectroscopy_SuppInfo_v7.pdf (Supplementary
power are related by a power law dependency. The dashed Notes 1-4)
line indicates the photocurrent intensity at which the signal to
noise ratio (SNR) becomes equal to 1, which in our measure- Data are available under the terms of the Creative Commons
ment corresponds to approximately 0.8 pA. The intersection Attribution 4.0 International license (CC-BY 4.0).
between the linear fit and the line of unitary SNR happens
at the power corresponding to the NEP of our device, Analysis code
which in this case is 5 nW. By applying the formula for the Analysis code for the ON-OFF measurements presented in
detectivity and using an area A = 1800 μm2 and a bandwidth Figure 2b available at: https://github.com/JorgeQuereda/Fiber-
of 1 Hz, we find D* = 104 Jones. coupled-LEDs-as-safe-and-convenient-light-sources-for-the-
characterization-of-optoelectronic-d/tree/v1.0
Conclusions
In all, the LED-based light sources described here represent Archived analysis code as at time of publication: https://doi.
a low-cost, modular, and easy to use alternative to the com- org/10.5281/zenodo.515359620.
monly used free-space light sources. While the achievable
spectral resolution of these light sources is limited, they still License: Creative Commons Zero “No rights reserved” data
allow to extract the essential figures of merit of photodetector waiver (CC0 1.0 Public domain dedication)
References
1. Mak KF, Shan J: Photonics and Optoelectronics of 2D Semiconductor 5. Lopez-Sanchez O, Lembke D, Kayci M, et al.: Ultrasensitive Photodetectors
Transition Metal Dichalcogenides. Nat Photonics. 2016; 10(4): 216–226. Based on Monolayer MoS2. Nat Nanotechnol. 2013; 8(7): 497–501.
Publisher Full Text PubMed Abstract | Publisher Full Text
2. Wang QH, Kalantar-Zadeh K, Kis A, et al.: Electronics and Optoelectronics of 6. Castellanos-Gomez A: Why All the Fuss about 2D Semiconductors? Nat
Two-Dimensional Transition Metal Dichalcogenides. Nat Nanotechnol. 2012; Photonics. 2016; 10(4): 202–204.
7(11): 699–712. Publisher Full Text
PubMed Abstract | Publisher Full Text 7. Pospischil A, Mueller T: Optoelectronic Devices Based on Atomically Thin
3. Xia F, Wang H, Xiao D, et al.: Two-Dimensional Material Nanophotonics. Nat Transition Metal Dichalcogenides. Appl Sci. 2016; 6(3): 78.
Photonics. 2014; 8(12): 899–907. Publisher Full Text
Publisher Full Text 8. Stranks SD, Eperon GE, Grancini G, et al.: Electron-Hole Diffusion Lengths
4. Koppens FHL, Mueller T, Avouris P, et al.: Photodetectors Based on Graphene, Exceeding 1 Micrometer in an Organometal Trihalide Perovskite Absorber.
Other Two-Dimensional Materials and Hybrid Systems. Nat Nanotechnol. Science. 2013; 342(6156): 341–344.
2014; 9(10): 780–793. PubMed Abstract | Publisher Full Text
PubMed Abstract | Publisher Full Text 9. Stranks SD, Snaith HJ: Metal-Halide Perovskites for Photovoltaic and Light-
Page 9 of 10Open Research Europe 2021, 1:98 Last updated: 23 AUG 2021
Emitting Devices. Nat Nanotechnol. 2015; 10(5): 391–402. 20. Quereda Bernabeu J: JorgeQuereda/Fiber-coupled-LEDs-as-safe-and-
PubMed Abstract | Publisher Full Text convenient-light-sources-for-the-characterization-of-optoelectronic-d:
10. Kojima A, Teshima K, Shirai Y, et al.: Organometal Halide Perovskites as Diode Power Ramp (v1.0). Zenodo. 2021.
Visible-Light Sensitizers for Photovoltaic Cells. J Am Chem Soc. 2009; 131(17): http://www.doi.org/10.5281/zenodo.5153597
6050–6051. 21. Quereda J, Zhao Q, Diez E, et al.: Supplementary Information to: Fiber-
PubMed Abstract | Publisher Full Text coupled LEDs as safe and convenient light sources for the characterization
11. Tan ZK, Moghaddam RS, Lai ML, et al.: Bright Light-Emitting Diodes Based of optoelectronic devices (Version v1). Zenodo. 2021.
on Organometal Halide Perovskite. Nat Nanotechnol. 2014; 9(9): 687–692. http://www.doi.org/10.5281/zenodo.5166973
PubMed Abstract | Publisher Full Text 22. Furchi MM, Polyushkin DK, Pospischil A, et al.: Mechanisms of
12. Zhu H, Fu Y, Meng F, et al.: Lead Halide Perovskite Nanowire Lasers with Low Photoconductivity in Atomically Thin MoS2. Nano Lett. 2014; 14(11):
Lasing Thresholds and High Quality Factors. Nat Mater. 2015; 14(6): 636–642. 6165–6170.
PubMed Abstract | Publisher Full Text PubMed Abstract | Publisher Full Text
13. Ahmadi M, Wu T, Hu B: A Review on Organic-Inorganic Halide Perovskite 23. Kufer D, Konstantatos G: Highly Sensitive, Encapsulated MoS2 Photodetector
Photodetectors: Device Engineering and Fundamental Physics. Adv Mater. with Gate Controllable Gain and Speed. Nano Lett. 2015; 15(11):
2017; 29(41): 1605242. 7307–7313.
PubMed Abstract | Publisher Full Text PubMed Abstract | Publisher Full Text
14. Miao J, Zhang F: Recent Progress on Highly Sensitive Perovskite 24. Vaquero D, Clericò V, Salvador-Sánchez J, et al.: Photoconductivity Regimes in
Photodetectors. J Mater Chem C. 2019; 7(7): 1741–1791. Monolayer MoS2 Phototransistors. arXiv. 2020.
Publisher Full Text Reference Source
15. Zhao Q, Carrascoso F, Gant P, et al.: A System to Test 2D Optoelectronic 25. Vaquero D, Clericò V, Salvador-Sánchez J, et al.: Excitons, Trions and Rydberg
Devices in High Vacuum. J Phys Mater. 2020; 3(3): 36001. States in Monolayer MoS2 Revealed by Low-Temperature Photocurrent
Publisher Full Text Spectroscopy. Commun Phys. 2020; 3(1): 194.
16. Castellanos-Gomez A, Buscema M, Molenaar R, et al.: Deterministic Transfer Publisher Full Text
of Two-Dimensional Materials by All-Dry Viscoelastic Stamping. 2D Mater. 26. Buscema M, Island JO, Groenendijk DJ, et al.: Photocurrent Generation with
2014; 1(1): 011002. Two-Dimensional van Der Waals Semiconductors. Chem Soc Rev. 2015; 44(11):
Publisher Full Text 3691–3718.
17. Zhao Q, Wang T, Frisenda R, et al.: Giant Piezoresistive Effect and Strong PubMed Abstract | Publisher Full Text
Bandgap Tunability in Ultrathin InSe upon Biaxial Strain. Adv Sci (Weinh).
27. Island JO, Blanter SI, Buscema M, et al.: Gate Controlled Photocurrent
2020; 7(20): 2001645.
Generation Mechanisms in High-Gain In2Se3 Phototransistors. Nano Lett.
PubMed Abstract | Publisher Full Text | Free Full Text
2015; 15(12): 7853–7858.
18. Frisenda R, Navarro-Moratalla E, Gant P, et al.: Recent Progress in the PubMed Abstract | Publisher Full Text
Assembly of Nanodevices and van Der Waals Heterostructures by
Deterministic Placement of 2D Materials. Chem Soc Rev. 2018; 47(1): 53–68. 28. Fang Y, Armin A, Meredith P, et al.: Accurate Characterization of Next-
PubMed Abstract | Publisher Full Text Generation Thin-Film Photodetectors. Nat Photonics. 2019; 13(1): 1–4.
Publisher Full Text
19. Quereda J, Zhao Q, Diez E, et al.: Fiber-coupled LEDs as safe and convenient
light sources for the characterization of optoelectronic devices [Data set]. 29. Mak KF, Shan J: Photonics and Optoelectronics of 2D Semiconductor
Zenodo. 2021. Transition Metal Dichalcogenides. Nat Photonics. 2016; 10(4): 216–226.
http://www.doi.org/10.5281/zenodo.5153605 Publisher Full Text
Page 10 of 10You can also read