BRIDGE March, 2021 No:11 - Denge Değerleme
←
→
Page content transcription
If your browser does not render page correctly, please read the page content below

BRIDGE
 March, 2021
    No:11

    made by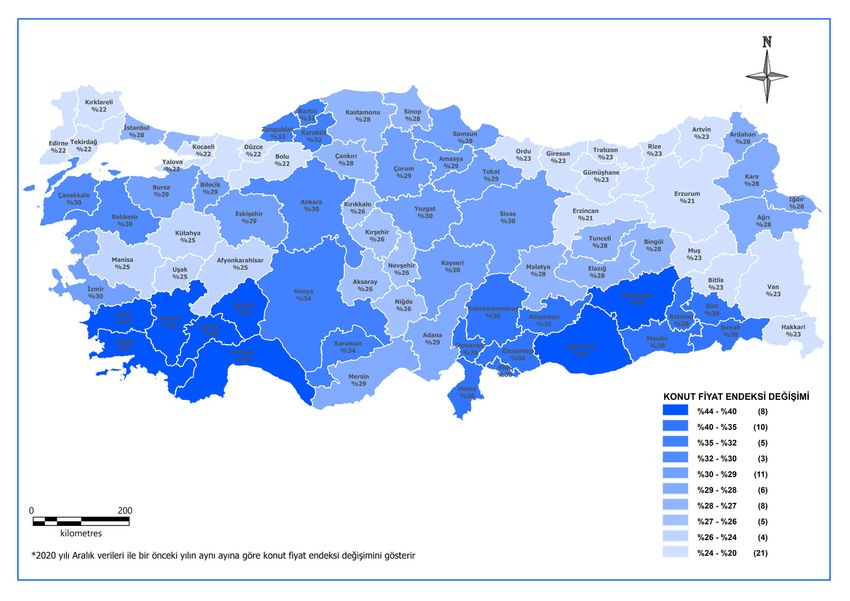
EUROPEAN VALUERS’ ALLIANCE
                                                  A meeting was held where the evaluation for 2020 was done and expectations and predictions for 2021 were stated in the
                                                  last week with the invitation of the European Valuers’ Alliance of which we are currently a member and Turkey’s representative.
                                                  As in our country, in 2020 that passed under the shadow of the pandemic across the world, new debates for the real estate
                                                  and exchange of ideas about what the current usage functions will be in the new period were also conveyed in this platform.
                                                  The presence of well-established valuation companies operating in the United Kingdom, Germany, Belgium, the Netherlands,
                                                  Portugal, Austria, Spain, France, Italy, Switzerland, Norway, Sweden, Poland, and Greece within the aforementioned Union
                                                  provided the opportunity for the information related to the popular places of continental Europe to be learned from the first
                                                  hand.
                                                  It was expressed that there have been serious decreases in the occupancy rates of the commercial estates such as offices
                                                  and shops in the large cities such as Amsterdam, London, Paris, Madrid, Milan, Manchester, Rome, and Berlin; such that,
                                                  cafes, restaurants, and stores even in Champs-Elysée, which is the world-famous figure in Paris, were closed.
                                                  Recovery seems to be difficult both in offices and shops in the short term. However, there is a prediction that the situation will
                                                  begin to change and commercial real estate will enter a recovery process with the spread of vaccination studies as of the
                                                  second half of 2021
                                                  Undoubtedly, offices and real estates for commercial use are under the course for different dynamics. With the introduction
                                                  of remote working, while the demand for offices considerably decreased in the said cities, we witness the statements of
                                                  many establishments that they may not return to office work in the new period.
                                                  While office demand is expected to remain at low levels in the short term, this situation brings about the expectation for new
                                                  functions for the real properties in this qualification. However, the processes of bringing new function bring about processes
                                                  of being a long term investment decision, the requirement for obtaining legal permits regarding the new field of activity,
                                                  suitability of the structural characteristics of the existing structure to the function to be developed, if not, investment cost
                                                  and financing requirement to meet this investment. Just like in our country.
                                                  The corporate view of both our partners within the European Valuers’ Alliance and our company as Denge is that this low
                         Baki BUDAKOĞLU           level of demand due to the pandemic will recover in parallel to the spread of vaccination. It is an undeniable fact that office
                              Denge Değerleme     environments and working habits will differ in the new era compared to the old times, and the concept of working from
                          Chairman of the Board   home will occupy more space in our lives than before. However, it is a common belief that office spaces where employees
                                                  have more personal space, are supported with the social and green area will be an important part of our lives.
                                                  On the other hand, it is predicted that the central offices, where companies gather all their personnel under a single roof,
                                                  thousands of people gather in a single-center, will decrease, and the satellite offices that aim to distribute the risks and
                                                  enable the administration of headquarters of companies with the pluralistic structure become one of the factors supporting
                                                  the office demand in the new period.
                                                  Wishing you all healthy days…
www.dengedegerleme.com                                                                                                                                                                 1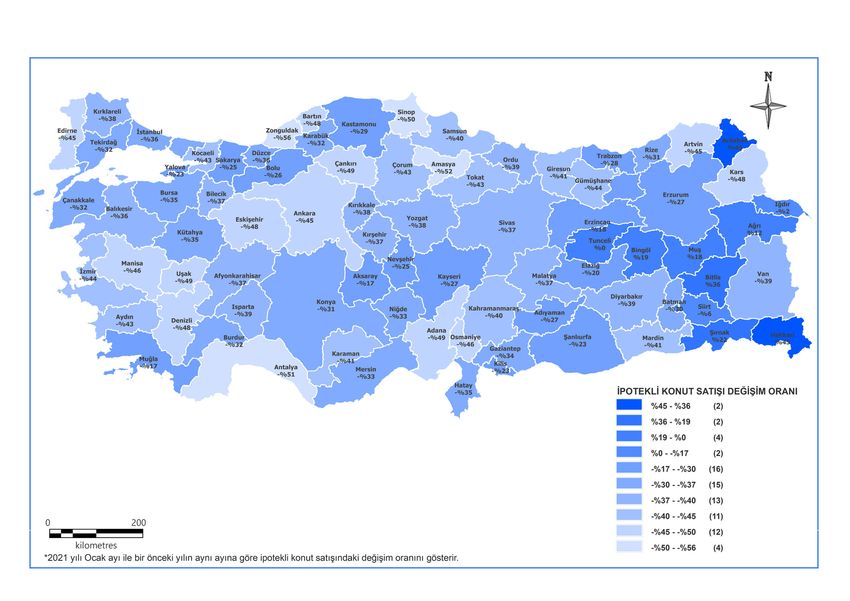
ECONOMICAL DATA e-bulletin/ 11
(Q3’20)
(Q3’20) Gross Domestic Growth Rate In The Oct’20 Unemployment
Annual Growth Rate Product Construction Sector Rate
6,7 (GDP) 6,4 12,7
(Q3’20)
% % %
1.419 Billion TL
Feb’21
Exchange Rate Jan’21
CPI / PPI Average Increase Rate of
Dolar $ %21,4 Consumer Price Index (CPI) %14,9 the Housing Price Index
29,3
Dec’20
%
Euro € %36,3 Producer Price Index (PPI) %26,2
Residential Market Tourism Mall Urban Transformation
Change in The Residential
Number of Total Visitors
Property Sales
38
The Number of Independent Units Subject to
Total Leaseble Area 444 Malls Urban Transformation
% 694.620
Q3’20
Turkey Istanbul
13,3 million m² GLA
Dec’20
113.615 70.587 699.330 408.040
Jan’20 Jan’21 Malls Under
Construction 32 Malls
The Number of Building Subject to Renovation
38% Mortaged Sales 614.647
The Number of Buildings Acquired Energy
Mortgage Hotel Occupancy Rate Visitor Index Efficiency Certificate
Interest 1.185.657
64
Jan’20
Rates Oct’20
18,1
Turkey Istanbul
Dec’20
The Number of Registered Monumental Trees
% 14,5
% %19,6 9.174
*Source: TURKSTAT | Republic of Turkey Ministry of Culture And Tourism | Republic of Turkey Ministry of Environment and Urban Planning | GYODER | Turkish Council of Shopping Centers (AYD)
www.dengedegerleme.com 2
CHANGE IN RESIDENTIAL PROPERTY SALES                                                                                                                                       e-bulletin/ 11

                                                                                                                                                                           Rate of Change
                                                                                                                                                                                in the
                                                                                                                                                                           Number of Sales

                                                                                                                                                                            %45 - %36    (2)

                                                                                                                                                                            %36 - %19    (2)

                                                                                                                                                                            %19 - %0     (4)

                                                                                                                                                                            %0 - %-17    (2)

                                                                                                                                                                            %-17 - %-30 (16)

                                                                                                                                                                            %-30 - %-37 (15)

                                                                                                                                                                            %-37 - %-40 (13)

                                                                                                                                                                            %-40 - %-45 (11)

                                                                                                                                                                            %-45 - %-50 (12)

                                                                                                                                                                            %-50 - %-56 (4)

   *The data shows the rate of change in house sales compared to January 2021 and the same month of the previous year.

      Considering the January data that was updated with the year of 2021, it is seen that there was a decrease of 38 % in Turkey’s average. Our provinces that have an
      increase in the ratio are 8 provinces where the real estate market is shallow. An increase is continuing in values across Turkey while the decreasing trend in the
      number of sales is continuing in the last 5 months.

www.dengedegerleme.com                                                                                                                                                                       3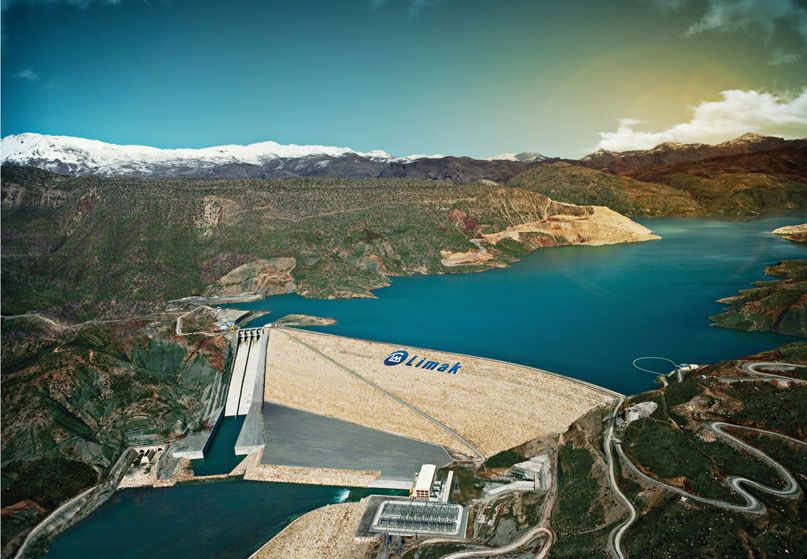
PRICE CHANGES IN RESIDENTIAL PROPERTIES                                                                                                                                          e-bulletin/ 11

                                                                                                                                                                                       Value
                                                                                                                                                                                       Index

                                                                                                                                                                                    %44 - %40 (8)

                                                                                                                                                                                    %40 - %35 (10)

                                                                                                                                                                                    %35 - %32 (5)

                                                                                                                                                                                    %32 - %30 (3)

                                                                                                                                                                                    %30 - %29 (11)

                                                                                                                                                                                    %29 - %28 (6)

                                                                                                                                                                                    %28 - %27 (8)

                                                                                                                                                                                    %27 - %26 (5)

                                                                                                                                                                                    %26 - %24 (4)

                                                                                                                                                                                    %24 - %20 (21)

   *The data shows the rate of change in residential property sales compared to December 2020 and the same month of the previous year.

      Considering the January data that was updated with the year of 2020, it is seen that there was an increase of 29,30 % in Turkey’s average. Despite the decrease
      in real estate sales rate, the fact that the values are increasing above the inflation rate in all of our provinces indicates that the stocks returned to market normal,
      the deferred construction costs were reflected in the values.

www.dengedegerleme.com                                                                                                                                                                              4
RESIDENTIAL PROPERTY SALE FIGURES e-bulletin/ 11
229.357
200.000 190.012
170.408
Compared to the same month last year, the
*
150.000 161.420 136.744 number of first hand house sales decreased
113.615 118.753 131.380 119.574 by 38% in January 2021 in Turkey.
108.670 112.483
105.981
100.000
118.285 95.368 82.598 70.587
77.575 81.450 74.581 75.825 69.083
50.936
*
Compared to the same month last year, the
50.000 42.783
34.076
48.319 number of second hand house sales
27.935 58.632 67.937 52.123 36.898
36.040 37.303 34.089 41.376 36.976 36.658
22.268
decreased by 38% the same in January 2021 .
14.848 16.860 16.860
0
Jan.20 Feb.20 Mar.20 Apr.20 May.20 Jun.20 Jul.20 Aug.20 Sep.20 Oct.20 Nov.20 Dec.20 Jan.21
*Source: TURKSTAT
Total Number of First Hand Sales Total Number of Second Hand Sales
57,0%
53,4%
44,6%
37,2% 39,9% 39,9%
200.000 36,8% 36,3%
26,0%
150.000
229.357
*
Compared to the same month last year,
21,4% 21,7%
the number of the mortgaged house sales
190.012
170.408
100.000
decrease 75% in January 2021 in Turkey.
136.744
112.483
119.574
130.721
43.733
42.237
43.329
118.753
35.576
108.670
15,2%
101.504
113.615
13,8%
24.450
25.566
50.000
17.088
18.483
70.587
76.019
The ratio of the mortgaged house sales is
14.631
*
10.372
105.981
50.936
42.783
15% in January 2021
0
Jan.20 Feb.20 Mar.20 Apr.20 May.20 Jun.20 Jul.20 Aug.20 Sep.20 Oct.20 Nov.20 Dec.20 Jan.21
Total Number of Mortgaged Sales Total Number of the House Sales The Ratio of the Mortgaged Sales
*Source: TURKSTAT
www.dengedegerleme.com 5
HOUSING SALE TO THE FOREIGNERS IN TURKEY                                                                                                                                                          e-bulletin/ 11

                                                                                                                                                                                                        5,5%
       5.000                                                                                                                                                                                            5,0%
                                                                                                                                                %4,4             %4,4
                                                                                                                                                                                %4,2                    4,5%
                                                                                                                               %3,9                                                      %3,8
       4.000                                                                                                                                                                                            4,0%
                   3,4%     3,4%                                                                                                                                                                        3,5%
                                     2,8%
       3.000                                                                                                                                                                                            3,0%
                                                                                                             %2,3                                                                                       2,5%
       2.000                                        1,7%          1,7%                                                                                                                                  2,0%
                                                                                               %1,2                                                                                                     1,5%
       1.000                                                                   %0,9                                                                                                                     1,0%
                                                                                                                                                                                                        0,5%
                   3.907    4.005    3.036          709           860           1.664         2.741           3.893            5.269            5.258           4.962           4.427    4.427
           0                                                                                                                                                                                            0,0%
                   Jan.20   Feb.20   Mar.20        Apr.20       May.20         Jun.20         Jul.20          Aug.20           Sep.20           Oct.20          Nov.20          Dec.20   Jan.21

                                                              Houses Sold to the Foreign Investors     Ratio In In The Total Houses Sales

                                                                                            Top 5 Cities in Terms of Foreign            The Top 5 Countries in Residential
                                        *
                                         Compared to the same month                              Investor Transactions                       Property Transactions
                                        last year, the number of total
                                        foreign sales increased by 32% in                              Istanbul                                          Iran
                                        January 2021.
                                                                                                       Antalya                                           Iraq
                                                                                                       Ankara                                       Russia
                                        *
                                         The ratio of the foreign sales in
                                        total sales was calculated as 4%                               Mersin                                  Afghanistan
                                        in January 2021.
                                                                                                        Bursa                                      Yemen
                                                                                                                                                            *Source: TURKSTAT

www.dengedegerleme.com                                                                                                                                                                                             6
THE FUTURE WILL BE OF RENEWABLE ENERGY                                                                                                                                  e-bulletin/ 11
                                                             In our country, the annual electricity consumption in 2020 was 304.8 billion kWh with an increase of 0.38% compared
                                                             to 2019, while renewable resources had a share of 42.38% in the annual production of 305.4 billion kWh.
                                                             The share of coal in annual electricity generation was 34%, HPP’s share was 25.59%, the share of natural gas was
                                                             22.69%, RES’s share was 8.11%, GES’s share was 8.11%, JES’s share was 3.06%, waste, garbage, and biomass was 1.80%,
                                                             total share of renewable resources was 42.38% in 2020.
                                                             According to the current data in the EU electricity sector report that was published by Ember research organization in
                                                             January 2021, the proportion of renewable resources in electricity generation in the European Union, which was 34%
                                                             in 2019, increased to 38 in 2020 and the share of fossil fuels in electricity generation decreased. The 40% share of fossil
                                                             fuels in the community's electricity generation in 2019 declined to 37% in 2020
                                                             Thus, the renewable energy in 27 EU member countries surpassed fossil fuels for the first time in 2020 and became the
                                                             main electricity generation source of the EU.
                                                             The top 5 countries with the highest share of renewable energy in Europe are Norway, Austria, Switzerland, Sweden,
                                                             and Denmark. The share of renewable resources in electricity generation was much higher than that of the European
                                                             Union in 2019 and 2020.
                                                             We expect that renewable energy resources will have a higher share in electricity generation than fossil fuel resources
                                                             in 10 years.
                                                             The coal and natural gas power plants had a share of over 57% in electricity generation in our country in 2020, we
                                                             expect that the total share of coal and natural gas will decline below 50% in the next 10 years, and renewable energy
                                                             resources will have a higher share than fossil fuel resources in the country’s electricity generation until 2030.

                         Taner ERCÖMERT                      The share of renewable resources in electricity production was 29% three years ago and increased 42.38 % as of the
                                                             end of 2020; we are pleased with this positive development. The biggest proportional increase in the country’s electricity
                         HESIAD Board Member and General     production was solar production with approx. 26% in 2020, we predict that the share of wind and solar will rapidly
                         Manager of Hydroelectric Group of   increase in electricity production in the next years while hydroelectric energy that has currently the share of above
                         Limak Holding                       25% in electricity production and 32% in the total installed power will maintain its title as the largest resource in the
                                                             renewable energy in the next 10 years.
                                                             The fact that renewable-sourced power has exceeded 50% of the total power, there were considerable increases
                                                             including 2500 MW in the installed power in hydroelectric that is our largest national resource (especially with a large
                                                             -capacity HPPs such as Ilısu with 1200 MW and Cetin HPP with 420 MW and some other HPPs), 1000 MW in wind and
                                                             500 MW in solar; the share of renewable resource in the production of electricity exceeded 42% are among the
                                                             major developments in the year. I consider 2020 as a successful year in terms of particularly hydroelectric energy and
                                                             all renewable energy resources across our country.
www.dengedegerleme.com                                                                                                                                                                     7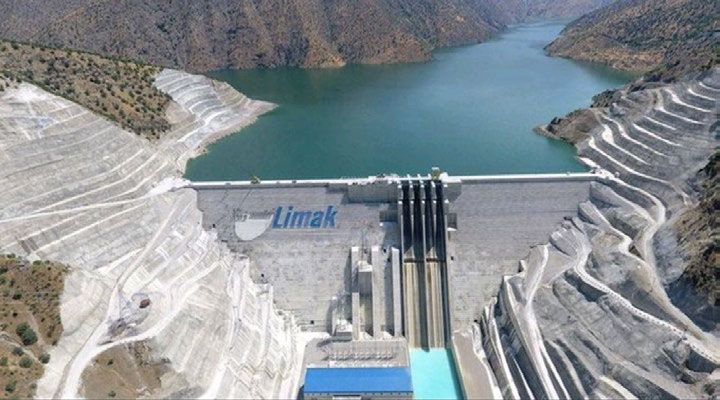
THE FUTURE WILL BE OF RENEWABLE ENERGY                                                                                                          e-bulletin/ 11
                         One of the fields that is expected to gain vitality as of 2021 is the rehabilitation and modernization of Hydro-Electric Power
                         Plants. This issue is important for the HPPs that are included in the scope of privatization and especially the ones that have
                         passed 40-50 years in enterprises. Privatizations of HPP that are expected to continue in 2021 and 2022 are expected to offer
                         new employment opportunities in the sector. Considering the fact that the share of the discontinuous renewable resources
                         continues to increase in our country, we expect the construction of pumped HEPPs, which are expected to play a critical role
                         for system supply security, to begin in 2021 The fact that the support for domestic parts, for which I approve the implementation
                         for energy plants, will continue, it will continue to be produced for turbine and generator parts is important for our economy.
                         It is expected to remain as the largest resource in renewable energy with an established power of 1500 GW across the world
                         in 2030 while in our country, hydroelectricity is also expected to be the largest resource in renewable energy with the power
                         of about 40 GW. In the period after 2030, it is foreseen that hydroelectricity will possibly fall to the 2nd and then to the 3rd
                         ranks in the power ranking of renewable resources when the rapid growth in wind and solar systems across the world is realized.
                         HEPPs that are also the biggest resource in 2021: HEPPs that are our largest national resource provided 29.5% of electricity production
                         in 2019 and 25.6% in 2020 in our country and energy import amounting to 7.5 billion dollars in 2 years was prevented through
                         the electricity production of 88.6 billion and 78.1 billion kWh provided from HEPPs in 2019 and 2020 In our beautiful country,
                         we wish the renewable energy resources led by HEPPs are to be developed, we hope to see the success also in solar and wind
                         systems and reach the levels of 30 GW that we have achieved in GESs.
                         The highest share in the installed power exceeding 96 GW belongs to HEPPs with 32.4% while natural gas has a share of 26.5%,
                         coal 21%, RESs have a share of 9.55, GESs have a share of 7% and biomass has a share of approx. 3%. The share of renewable
                         energy was 45% in the established power three years ago while it has today exceeded 51%. The current distribution of our
                         country's renewable electricity generation power is as follows. HPPs are 31.43 GW, RESs are 9.24 GW, GESs are 6.75 GW, JESs
                         are 1.7 GW, and Biomass plants are 1.11 GW.
                         As of February 2021, the total power of renewable source power plants in our country exceeded 50 GW, and the target is
                         now to reach 100 GW of renewable energy power. Our country currently ranks the 2nd in Europe in terms of hydroelectric
                         energy installed power, 6th in Europe in solar power, and 7th in Europe in wind power. The countries that are in the top 10 in
                         the renewable energy in the world include China with 788.9 GW, the USA with 283.6 GW, Brasil with 141.9 GW, India with 133
                         GW, Germany with 130.8 GW, Japan with 119.3 GW, Canada with 101.2 GW, Italy with 59.2 GW, Spain with 57.9 GW, Russia
                         with 55.2 GW while Turkey ranks 12th with 49.5 GW after France that has the power of 52.9 GW, I hope Turkey will be in top 10
                         in renewable energy established power in the world and in the top 5 in Europe.
                         The major goal in electricity production is to reach 500 billion kWh:
                         Electricity production in our country exceeded 300 billion kWh in 2020, and it is predicted that the production will approach
                         320 billion kWh in 2021, reach 375 billion kWh in 2023, and 500 billion kWh in 2032 We hope that the new energy investments
                         in our country in 2021 and beyond are also renewable and the share of renewable energy in energy and electricity generation
                         will increase year by year.
www.dengedegerleme.com   Wishing you an abundance of energy.                                                                                                       8
PUSHING THE RIGHT BUTTON IN RENEWABLE ENERGY                                                                                                                        e-bulletin/ 11
                                                  “2020 was also a year in which we witnessed unprecedented developments in the energy markets, as in many areas. The
                                                  pandemic gave rise to fundamental changes in our daily life, leading to the concept of sustainability to come to the fore.
                                                  Along with the pandemic, awareness to important issues such as climate change and global warming has also increased.
                                                  The precautions taken brought forth a big decrease in energy demand, leading to price volatility in the markets due to
                                                  supply / demand mismatch. The fact that the global economic outlook is adversely affected by the pandemic also affected
                                                  the short and medium-term risk appetite in the energy markets. Towards the close of the year, in company with the positive
                                                  developments regarding the vaccine and the announcement of the financial support packages by the governments, hopes
                                                  for the return to life before the pandemic rose, especially as of the last quarter of the year.
                                                  When the processes of the factors that came to the fore in the pandemic process in 2020 are analyzed, we encounter a
                                                  very interesting picture. In our country, the restrictions that led to a decline in energy demand in the second quarter of the
                                                  year, especially in the third quarter of the year, led to an increase in energy demand due to the increasing need for cooling
                                                  and digital activities. Production capacity decreased owing to rapidly depreciating commodities in global markets, and in
                                                  the last quarter, price increases were observed in the USA, Europe and Asia-Pacific regions with the increasing energy
                                                  demand as a result of the lowest air temperatures in history.
                                                  Undoubtedly, renewable energy is one of the sectors that came into prominence in 2020. Our installed capacity in
                                                  renewable energy, evaluated within the scope of strategic vision since the early 2000s, has brought our country to an
                                                  important point in the renewable energy sector in the world at the last point. One of the statistics also showing that we had
                                                  a peak year within the scope of renewable energy in 2020 is that the share of renewable energy installed power put into
                                                  operation last year within the total installed power was realized at the level of 95 %. In the last decade, the installed power
                                                  of wind power has increased rapidly, exceeding the level of 9 GW by the end of 2020. In conjunction with the acceleration
                                                  of technological developments, solar power plants, which have experienced a great decrease in cost, have increased
                                                  rapidly in the last 5 years, exceeding the level of 6,5 GW by the end of 2020.
                                                  Renewable energy is of vital importance not only in our country but also in the world in terms of both environmental and
                                                  financial sustainability. Nevertheless, it is compulsory to take the right steps in energy markets and system planning so as to
                         Alper İNKAYA             achieve the real potential in renewable energy, which has such important advantages.
                         AKSA Enerji Üretim A.Ş   The price effect created by renewable energy in energy markets was replaced by the process of managing uncertainties
                         Portfolio Manager        in energy planning. The unforeseen variable production of solar and wind power plants, in particular, increases the need for
                                                  flexibility in the grid, as it complicates the process in terms of energy planning. In this regard, as Aksa Enerji Ticaret (Energy
                                                  Trade), we deliver the services with the products we have developed under the leadership of digitalization in the dynamic
                                                  balancing and planning process of renewable energy plants. As part of our active balancing portfolio reaching the level of
                                                  3 GW, we keep market costs at the lowest level by balancing and planning renewable power plants in real time. The dynamic
                                                  management of imbalance costs, expected to increase with the effect of increasing renewable energy production, is also
                                                  critical importance for the sustainability of renewable energy.
                                                  The inability to store electricity, which is one of the most crucial point, has become a big problem with the increasing variab-
                                                  le energy production. The solution to the problem could only be solved by getting to the bottom, and this means the develop-
                                                  ment of battery technology. The ability to store variable renewable energy and to transfer the stored energy in periods of
                                                  low energy demand to the period when demand increases will enable a quality and reliable energy supply with a high
www.dengedegerleme.com                            share of renewable energy."                                                                                                          9
WHY TURKEY SHOULD TEND TOWARDS RENEWABLE e-bulletin/ 11
ENERGY RESOURCES
As in the world, the tendency towards renewable energy resources has recently increased also in our country. The main
reason for this fact can be considered to be the decreasing current energy reserve resources, global warming, and environmental
problems.
Turkey is a country having a high potential for renewable energy resources in terms of geographical location. When it is considered
in terms of renewable energy resources, our region is among the leading countries in terms of hydraulic energy potential; our
country is much suitable for wind and solar energy. Our country ranks 2nd in the hydroelectric established power, 6th in
Europe in solar energy, and 7th in wind energy in Europe. The geothermal energy of our country is considerably high, it has a
usable potential. We rank 7th in the world ranking and 2nd in Europe.
According to 2020 data, our energy need was met through renewable energy resources as 42 %. The percentage of
renewable resources that was 34% in electricity production in the European Union in 2019 was 38% in this year.
The percentage of Turkey’s renewable resources in 2020 was comprised of the Hydroelectric Power Plants (HPP) with a
share of 29%, Wind Power Plant (WPPs) with 8%, Solar Power Plants (SPPs) with 4%, Geothermal Power Plants (GPPs) with 3%,
and Biomass Power Plants with 3%. On the other hand, the need for energy was met with fossil fuel resources containing the
imported and domestic coal plants with 34% and natural gas power plants with 19%.
Thanks to the mechanism that supports renewable energy, the share of fossil-fueled power plants decreased while the
number of renewable energy-based power plants such as wind, solar, hydro, and geothermal, and their share in electricity
supply have rapidly increased.
For a healthier future, the tendency towards renewable energy will continue by giving up conventional fuels such as coal, oil,
lignite, natural gas, etc. that cause air and environmental pollution.
Fossil energy-based energy investments negatively affect our national energy policy. After increasing natural gas prices in
our country in the past years, many natural gas investments in our country have come to a stopping point. Such energy
resources which we are dependent on foreign resources are composed of the costs such as transportation, transfer, and storage.
The energy resources that are not renewable such as petroleum and natural gas are scarcely any in our country. The natural
gas reserve in our country cannot even meet 1% of its annual consumption. In terms of ensuring natural gas supply security,
underground storage activities are also carried out in our country, as in the Tuz (salt) Lake.
Burak ÇOLAK With the increasing population, there will be an increase in the rate of vehicle ownership in our country. Among the measures
AKFEN Renewable Energy that can save you from dependence on fossil fuels, electric vehicles gain importance. With electricity obtained from renewable
Deputy General Manager energy sources, carbon dioxide emissions from energy production and consumption in both transportation and electricity
sectors will be reduced.
It is probable that the fastest growing energy resources in the next 30 years will be renewable energy resources mainly wind
and solar energy.
In the upcoming years, we will benefit more from roof-type SES investments in our country, which has high solar energy potential.
The use of hybrid technologies will increase by establishing the field type solar power plants in the HPPs with a reservoir and
floating solar power plants on the dam lake.
SPPs will be a technology that complements river-type HPPs due to the increase in sunshine duration in the summer months.
In our developing country, energy demand will increase day by day due to the reasons such as the increase in population,
increase in electric vehicles, development of the industry. Increasing the use of renewable energy resources in our country
will provide more stability and development to our economy. Providing resource diversity in the renewable field will increase
www.dengedegerleme.com energy security and help protect the natural and environmental resources of our country. 10OFFSHORE WIND ENERGY AND SITUATION IN TURKEY e-bulletin/ 11
The fact that the increasing greenhouse emissions threaten nature, economic fluctuations in fuel prices have increased the
interest in renewable and sustainable energy sources such as wind. In addition to this, the noise and negative visual effects
encountered in onshore wind turbines, as well as the existence of large areas suitable for wind power plant installation in
the open seas and the higher wind energy potential compared to land have caused the sector to turn towards the open
seas. Since wind power is proportional to the cube of wind speed, a small increase in wind speed significantly increases the
efficiency of the system. For this reason, offshore wind turbines become an important option for utilizing the high wind potential
in deep waters.
The first use of wind energy on the open sea was in 1991 with the Vindeby offshore wind plant established on the Danish
coast. The journey, which started with eleven 450 kW turbines, has recently reached up to 7 MW. Similarly, the first applications
that started with a single pile system required the consideration of floating platforms for wind turbines over time in accordance
with the increasing sea depth.
4,000 20,000
Cumulative Installed Capacity (MW)
3,500 17,500
Annual Installed Capacity (MW)
3,000 15,000
2,500 12,500
2,000 10,000
1,500 7,500
1,000 5,000
500 2,500
0 2008 2009 2010 2011 2012 2013 2014 2015 2016 2017 2018
0
UK Germany Belgium Denmark Spain Sweden Netherlands France Finland Norway Portugal
Cumulative Installed Capacity (MW)
In the European Wind Energy Association’s (WindEurope) 2018 report, annual offshore wind installations by country and
Doç.Dr. Elif OĞUZ cumulative capacity are summarized as shown in the figure. According to the report published by European Wind Energy
Association in 2019, the EU countries acquire 15% of their electricity needs from wind while Turkey met 8% of its electricity need
ODTÜ Construction Engineering from onshore wind power plants. This proved that Turkey has been following these developments in the world.
Instructor - RÜZGEM Deputy
Manager Although there is no established offshore wind plant yet, it is known that various studies are being carried out in this regard.
Looking at the Turkish seas, we observe that the North Aegean, Marmara and western regions of the Black Sea have high
wind potential. Offshore wind turbine designs are tailored to the region, taking into account the parameters such as wave,
wind, current, and seafloor. Because the offshore wind turbine designs vary from country to country, it is very important to
choose a place in Turkey before the installation of an offshore wind turbine farm. In the scope of the various projects, the researches
for the offshore wind farm considering the high wind potential and other parameters such as water depth, proximity to the
network, effects on the environment are being carried out. After determining the region, the environmental conditions where
the installation will be made and the loads to the system should be modeled correctly by making the long-term easurements
of wind, wave, and currents in the open sea. In addition, due to the existence of active and non-active faults in Turkey, detailed
earthquake studies are required in the region to be determined in Turkey’s seas before the installation, structure should be
www.dengedegerleme.com designed by taking into account the seismic loads for the structure. 11IMPORTANCE OF VALUATION IN POWER PLANTS e-bulletin/ 11
Companies investing in power plants require valuation reports for reasons such as revaluation of their equities, updating
of their accounting record values, transfer or sale of facilities, determining the insurance value and security. Especially
in the recent period, due to the intense interest to the public offerings, the valuation requests of the energy companies
have increased because of the revaluation needs of the equity values originating from the exchange rate fluctuations
of these plants of which their income and expenses and machinery-equipment are based on foreign currencies.
The Market, Cost, and Revenue approaches that are three main approaches defined within the framework of the
International Valuation Standards can apply to the valuation of power plants. The fact that which method shall be
applied varies according to the qualification of the plant and the purpose of preparing the report. For example, the
cost method is applied when determining the insurance value of the facility while the revenue approach can be employed
when determining the sale value. In the reports that are prepared for the companies, which will go public, to summit
CMB, at least two of three main approaches are required to be applied.
According to their shares in Turkey’s Electricity Production, it is made through natural gas, hydroelectric, hard coal,
and lignite, imported coal, wind, liquid fuels such as diesel and fuel-oil, geothermal, biogas, and solar energy respectively.
The parameters and dynamics of each of these production facilities should separately be taken into consideration
when they are appraised. When the value of the cost approach of the facility for which an appraisal is requested is
determined, it is important to make a detailed examination of machinery-equipment; conducting the right analyses is
important when determining the cost of the construction works that constitute a major part of the cost of hydroelectric
plants; it is important to determine in what conditions and where the drilling is opened when determining the cost of
the wells that constitute a considerable part of the cost in the valuation of geothermal facilities. In the Revenue Approach,
in the calculation of the facility, it is necessary to analyze the duration of the agreement and unit prices of the plants
Korhan CAN which have Yekdem agreement (support mechanism for renewable energy resources), analyze how the sale prices
Denge Değerleme A.Ş Machine- of EpiAS will be in the future, review the feasibility reports by retrospectively analyzing the facility’s productions, examine
Equipment Valuation Deputy the side incomes such as the carbon income and steam sale. In the Revenue approach, in the calculation of the expenses
General Manager of the facility, the fact that how the expenses will increase in the following years should be examined in detail by examining
the costs such as the service costs of machinery and equipment, insurance items, rental costs, contribution margins,
personnel costs, management costs, system usage costs, costs of the fuel being used, etc.
For the reasons I mentioned above, the power plant valuation also requires expertise such as machinery-equipment
valuation or interpretations of financial statements in addition to the knowledge on real estate due to the fact that
they qualify as income-generating properties and contain a qualified machinery-equipment park. It would be a correct
approach to prepare the power plant valuation reports by mechanical engineers, civil engineers who are an expert
on power plants and with the support of other branches when necessary.
www.dengedegerleme.com 12info@dengedegerleme.com /dengedegerleme
Head Office: Cevizli Mh. Tugay Yolu Cd. No:20 Ofisim İstanbul B Blok K:6 Ofis No: 33-34-35-37 Maltepe - İstanbul
Branch Offices: İstanbul Avrupa | İstanbul Anadolu | Ankara | Bursa | İzmir | Antalya | Adana | Gaziantep | Van | Samsun | Hollanda/Amsterdam
+90 216 369 9669 | +90 216 225 7800
www.dengedegerleme.comYou can also read