R 483 - Zombie firms in Italy: a critical assessment by Giacomo Rodano and Enrico Sette - Banca d'Italia
←
→
Page content transcription
If your browser does not render page correctly, please read the page content below
Questioni di Economia e Finanza
               (Occasional Papers)

               Zombie firms in Italy: a critical assessment

               by Giacomo Rodano and Enrico Sette
January 2019

                                                                       483
                                                              Number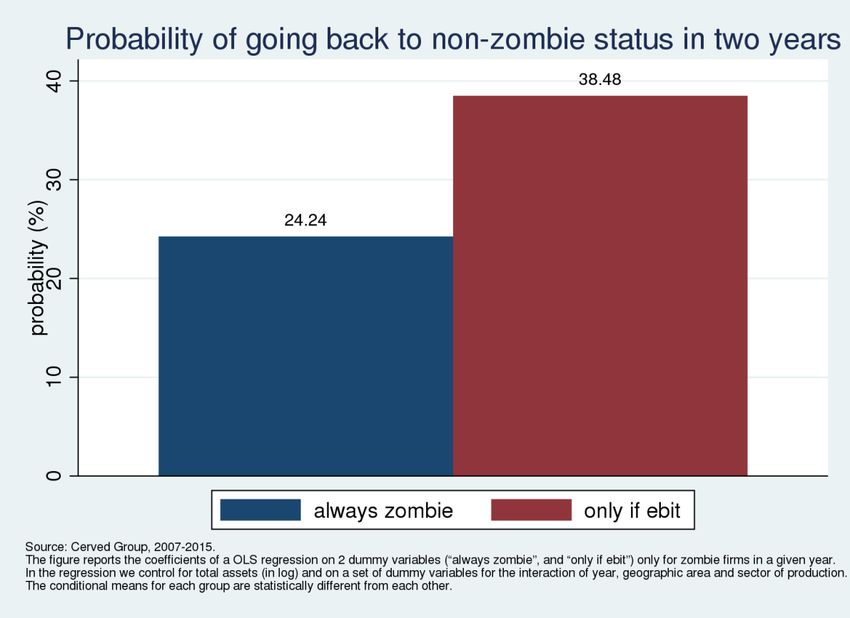
Questioni di Economia e Finanza
(Occasional Papers)

Zombie firms in Italy: a critical assessment

by Giacomo Rodano and Enrico Sette

Number 483 – January 2019
The series Occasional Papers presents studies and documents on issues pertaining to
the institutional tasks of the Bank of Italy and the Eurosystem. The Occasional Papers appear
alongside the Working Papers series which are specifically aimed at providing original contributions
to economic research.

                 The Occasional Papers include studies conducted within the Bank of Italy, sometimes
in cooperation with the Eurosystem or other institutions. The views expressed in the studies are those of
the authors and do not involve the responsibility of the institutions to which they belong.

                 The series is available online at www.bancaditalia.it .

ISSN 1972-6627 (print)
ISSN 1972-6643 (online)

Printed by the Printing and Publishing Division of the Bank of Italy
ZOMBIE FIRMS IN ITALY: A CRITICAL ASSESSMENT
by Giacomo Rodano* and Enrico Sette*
Abstract
This note shows the consequences of different methodological choices for the estimates
of the incidence of zombie firms in Italy. We use as a benchmark the influential measure
proposed by the OECD (Adalet McGowan et al. 2017a and 2017b) which identifies zombie
firms based on a combination of firm age and values of the interest coverage ratio (operating
profits to interest expenses). We show that a key decision is whether operating profits are
taken before or after amortization and depreciation and we argue that using profits after
amortization and depreciation has several undesirable characteristics: i) it overestimates the
share of capital “trapped” into zombie firms, and, to a smaller extent, the share of zombie
firms; ii) it is worse in predicting the future performance of firms; iii) it is more likely to
classify as zombies in a given year firms which invested heavily in previous years and
amortized that investment quickly (for example to enjoy tax breaks); iv) it is especially
inappropriate for cross-country comparisons.
JEL Classification: D24, L25, O47.
Keywords: zombie firms, productivity, misallocation.
Contents
1. Introduction ........................................................................................................................... 5
2. Comparing recently proposed ways to identify zombie firms ............................................... 6
3. Quantifying the incidence of zombie firms in Italy:
the role of counting depreciation and amortization ............................................................... 7
4. Comparing the alternative estimates available for Italy ........................................................ 9
5. Conclusion .......................................................................................................................... 10
Tables and figures .................................................................................................................... 13
References ................................................................................................................................ 22
_______________________________________
* Bank of Italy, Economic Research and International Relations, Structural Economic Analysis Directorate.1. Introduction*
In the aftermath of the “Great Recession”, there has been a renewed interest in the negative
impact that zombie firms – low profitability firms with persistent difficulties in meeting their
interest obligations – may have on the economy. This has featured in press articles (Wall Street
Journal 20171), policy columns (Duval and Obstfeld 20182) as well as in academic and policy
papers (Acharya et al. (2016), Adalet McGowan et al. (2017a and 2017b), Andrews and Petroulakis (2017),
Schivardi et.al (2017), and Stortz et al. (2017).
While zombie lending was first put forward to explain the length and depth of the Japanese
recession (the “lost decade”, Caballero et al 2008), some analysts, most forcefully the OECD
(Adalet McGowan et al. 2017a and 2017b), are suggesting that the increase in zombie firms, due in
particular to inefficient insolvency regimes, is a possible explanation for the low productivity
growth observed in several countries after the great recession. The presence and survival of zombie
firms generate “excessive” competition, both in the input and output markets, on healthy firms,
which as a consequence fail to grow and expand. In addition, the factors of production, remain
“trapped” into non-performing firms, reducing the degree of allocative efficiency of an economy.
The quantitative impact of zombie firms appears to be large. For example, using firm-level
data for a sample of OECD countries, Adalet McGowan et al. (2017a and 2017b) find that the
prevalence of zombie firms and the amount of resources sunk in such firms have risen since the
mid-2000s and that the increasing survival rate of such firms on the verge of exit has indeed
congested markets and constrained the growth of more productive firms. The importance of zombie
firms would be especially large in Italy: they estimate that the share of capital stock sunk in zombie
firms have increased from 7 per cent in 2007 to 19 in 2013. As a consequence, they conclude that:
“zombie firms could account for perhaps one-quarter of the actual decline in private non-
residential business investment in Italy between 2008 and 2013”, and “had the zombie capital share
not risen from its pre-crisis levels, aggregate MFP (multi factor productivity) could have been 0.7%
higher in Italy”. Policy implications are then derived in terms of insolvency regimes (i.e., the
institutions that shape firms’ exit from the market): “reducing barriers to restructuring from the
high level in Italy to the minimum level in the sample (i.e. the United Kingdom) would boost the
efficiency of capital reallocation – as measured by the elasticity of capital growth to past firm
productivity – by around 4 percentage points”.
While these arguments are theoretically appealing and intuitive, we argue that identifying
zombie firms may be particularly difficult and results crucially depend on the measure of
profitability chosen. In fact, zombie firms are typically identified as firms whose returns are not
sufficient to remunerate the inputs. In practice this implies comparing a measure of operating profits
* We thank Matteo Bugamelli, Silvia Giacomelli, Francesca Lotti, Giuliana Palumbo, Luigi Federico Signorini and,
especially, Paolo Sestito for their helpful comments. The views expressed herein are those of the authors and do not
involve the responsibility of the Bank of Italy or of the Eurosystem.
Giacomo Rodano: giacomo.rodano@bancaditalia.it; Enrico Sette: enrico.sette@bancaditalia.it
1
“A spectre is haunting Europe’s recovery: zombie companies” published on November 16, 2017.
2
“Tight monetary policy is not the answer to weak productivity growth” by Obstfeld and Duval published on January
10, 2018 on VoxEu
5(the margin remaining after paying workers and intermediate inputs) with interest expenses, the
remuneration of capital.3
Using balance sheet data for all Italian corporations (Cerved Group), we show the
consequences of different choices for the estimates of incidence of zombie firms in Italy. In
particular, we argue that a key decision is whether operating profits are taken before or after
amortization and depreciation. We discuss the theoretical ground for either choice, and we show
that using profits after amortization and depreciation has several undesirable characteristics: i) it
overestimates the share of capital “trapped” into zombie firms, and, to a smaller extent, the share of
zombie firms; ii) it is worse in predicting the future performance of firms; iii) it is more likely to
classify as zombies in a given year firms which invested heavily in previous years and amortized
that investment quickly (for example to enjoy tax breaks); iv) it is especially inappropriate for cross-
country comparisons.
Finally, we compare estimates of the incidence of zombie firms in Italy using different
definitions proposed in the most recent literature, focusing in particular on recent work by the
OECD (Adalet McGowan et al. (2017a and 2017b), which has been very influential in the policy
debate4, and on the paper by Schivardi et al. (2017). We find that the incidence of zombie firms as
measured by the OECD is in the upper range of available estimates, in particular with respect to the
share of capital sunk in zombie firms.
The paper is structured as follows: section 2 discusses the recent measures of zombie firms
used in the literature; section 3 discusses their main pros and cons; section 4 compares the measures
of zombie firms proposed by the OECD with recent estimates provided by Schivardi et al. (2017).
2. Comparing recently proposed ways to identify zombie firms
In theory, zombie firms are defined as firms which have very low productivity or profitability,
have persistent difficulties in meeting their interest obligations or receive subsidized credit, and
would exit in a competitive market under normal conditions, where “normal” typically refers to a
period which is neither an exceptional recession nor a systemic crisis.
For expositional purposes, in this paper we will mainly refer to the measure proposed by the
OECD (Adalet McGowan et al. 2017a and 2017b)5 since this has gained high attention in the policy
debate. Other recent work used a similar approach to identify zombie firms (Koetter et al. 2018;
Fontora Gouveia and Osterhold 2018; Banerjee and Hoffman 2018). The OECD identifies zombies
with a measure that compares profits with interest expenditures, thus focusing on a firm’s difficulty
3
A notable exception is Caballero et al. (2008) who define zombie firms as those obtaining loans at subsidized interest
rates.
4
As a relevant example, the same definition has been used by the BIS in its latest Quarterly Review, and it has been
mentioned in the Wall Street Journal article cited in the previous footnote.
5
Adalet McGowan et al. (2017a) provide an estimate of the incidence of zombie firms across a set of countries. Adalet
McGowan et al. (2017b) quantify the benefit in terms of higher TFP of reforming the bankruptcy procedure in a way
which speeds up the exit of zombie firms from the market.
6in meeting interest payments, after paying for all inputs. In particular, the measure is based on
ORBIS data and defines a firm as “zombie” in a given year t if two conditions are met:
1) the interest coverage ratio, computed as the ratio of operating profits to interest expenses
is less than one for three consecutive years (t, t-1, t-2). Operating profits are taken from
balance sheets and coincide with Earnings Before Interest and Taxes (EBIT), i.e., net of
depreciation and amortization6;
2) the firm is aged 10 years or older: this is imposed to avoid classifying as zombies young
and dynamic firms which may easily have negative operating profits during their first
years of life.
Adalet McGowan et al. (2017a) reports a very large increase in the share of capital “trapped” into
zombie firms from 2007 to 2013 (Panel A of Figure 1 which reproduces Figure 5 of the OECD
paper) with a particularly high share in Italy, Spain, Belgium, Portugal and, surprisingly, Germany
(Panel B of Figure 1). The estimates for Italy also have the peculiar feature that the share of capital
trapped into zombie firms is much larger than the share of zombie firms and this does not happen to
the other countries analyzed in that study.
3. Quantifying the incidence of zombie firms in Italy: the role of counting depreciation and
amortization.
A key critical issue with measures of zombie firms based on firm profitability is how
“operating profits” are computed. The key choice here is between Earnings Before Interest and
Taxes (EBIT) which is net of depreciation and amortization, and Earnings Before Interest and
Taxes, Depreciation and Amortization (EBITDA).7
In a nutshell, while EBIT might be preferable in that it allows to consider both the operating
costs and the cost of replacing installed capital, it has some important drawbacks. First,
amortization depends upon the tax treatment of property and equipment, which differs both across
countries and within countries over time. In the case of Italy, for example, several policy
interventions put in place during the crisis led to changes in the book value of firm investment, and
as a consequence of amortization in the following years8. Second, EBIT turns out particularly low
and much lower than EBITDA for firms which invested and amortized a lot: the gap between the
EBIT and EBITDA can get even larger during a prolonged crisis compressing earnings. Third,
EBITDA is a concept closer to cash-flow, which at the end of the day is what matters when it comes
to meet interest expenses.
We start using EBIT as a measure of operating profits. When we do so we get estimates of the
incidence of zombie firms and of the capital sunk into them which is roughly in the ballpark of the estimates
7 There is no consensus in the academic literature on the most appropriate measure of profitability to be used at the
numerator of the interest coverage ratio. For example, focusing on the papers published on top economics and finance
journals, Asquith et al. (1994), Kaplan and Stromberg (1998), Carey et al. (1998), Faulkender and Petersen (2006),
Acharya et al. (2007) define the interest coverage ratio as the ratio of EBITDA to interest expenses, while Campbell and
Taksler (2003), Denis and Sibilkov (2010) use EBIT to interest expenses. Rajan and Zingales (1995) briefly discuss the
difference between the two indicators.
8
See for example the Law Decree 78, 2009 and the Law 102, 2009 (“Tremonti-ter”).
7provided in Adalet McGowan et al., (2017a)9. When we use EBITDA instead of EBIT as a measure
of operating profits, we get rather different estimates. Since EBITDA is always larger than EBIT,
measures based on the former will yield a lower estimate of the incidence of zombie firms. The key
issue then is the size of the difference. Figures 2 and 3 show the evolution of the number of zombie
firms and of the share of capital held by zombie firms, respectively, while Table 1 reports the actual
figures10. Quite clearly, the EBITDA-based measure yields a lower share of zombies and capital
“trapped” into zombies than the EBIT-based measure: in 2013 the share of zombie firms is 7.8 per
cent using the EBIT-based and 5.1 per cent using the EBITDA-based measure; the share of capital
in zombie firms is 21.7 and 11.8 per cent, respectively. Interestingly, the difference is larger in the
case of capital (almost double), signaling that amortization is bigger among larger (i.e. with more
assets) firms.
This first evidence indicates that choosing EBIT or EBITDA as a measure of operating
profitability changes dramatically the estimated incidence of zombie firms. We now analyze
different features of the proposed measure of zombie firms should have, in particular with respect to
its goal of quantifying the incidence of zombie firms and making international comparisons. We
argue that choosing EBIT over EBITDA is a poor choice.
First, a reasonable measure of zombie firms should predict exit. Table 2 and Figures 4 and 5
show a firm’s status 3 years after being identified as a zombie. There are 4 possible statuses: i)
being still a zombie; ii) no more a zombie; iii) still alive but with unknown zombie status; iv)
having exited the market11. While both measures entail that about one third (a bit less during the
recent financial crisis) of zombie firms in a given year are still alive and are not zombies anymore
after 3 years, the EBITDA-based measure is slightly better in predicting the exit of zombie firms.
The EBIT-based measure instead gives rise to a higher persistence in zombie status, likely as a
result of the fact that a firm which has invested more in a given year will have higher depreciation
and amortization in subsequent years (lowering the EBIT, but not the EBITDA).
More generally we can get a sense of the importance of using EBIT instead of EBITDA by
comparing the future performance, holding constant other characteristics, of three group of firms:
those classified in a given year as zombie using both measures of profitability (“always zombie”),
those classified as non-zombie using both measures (“never zombie”), and those classified as
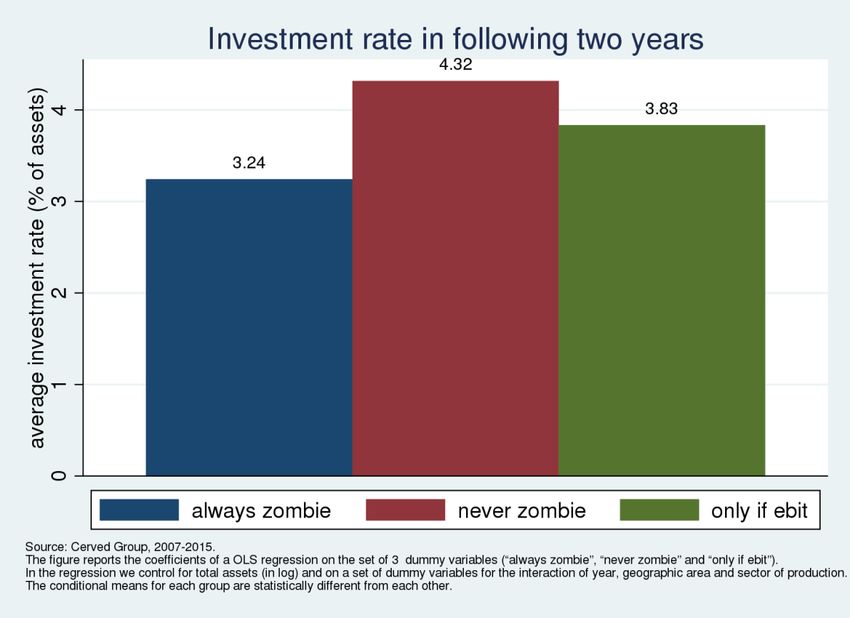
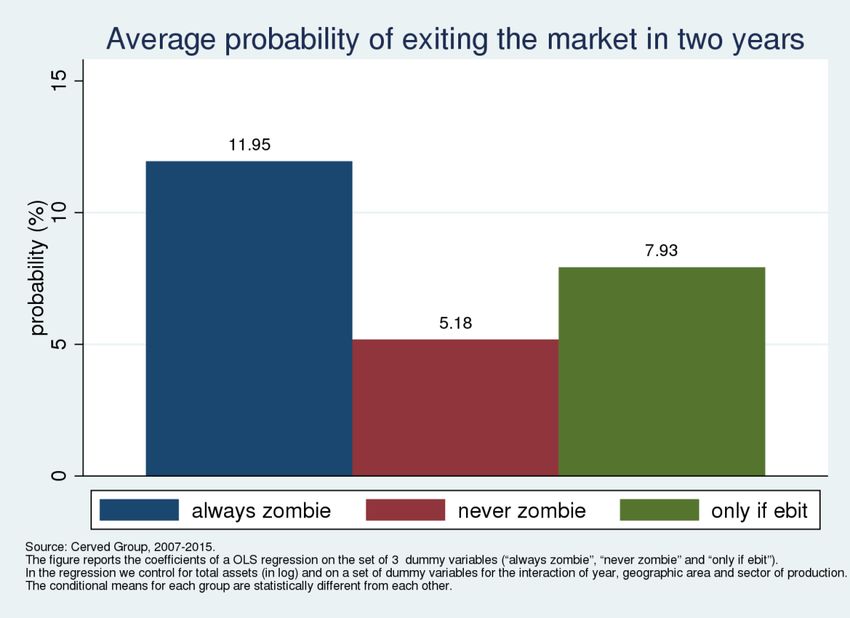
zombie when using EBIT but non-zombie when using EBITDA (“only if ebit”).12 Figures 6 and 7
show the differences in the probability of exiting the market within two years and the average
9
The date used in this note come from Cerved Group, which provides balance sheet data on the universe of Italian
corporations. Note that Cerved Group database is the primary source for the ORBIS data used by OECD papers (Adalet
McGowan et al., 2017a and 2017b).
10
In Figure 3 we also report the incidence of zombie firms with and without excluding the biggest firms in terms of
size. Excluding these outliers does not affect the share of zombie firms – in Figure 2 the dashed lines coincide with the
continuous lines – but it affects the share of capital sunk in zombie firms: a substantial part of the increase in the share
of total assets of zombie firms in the recent crisis is due to extremely big firms becoming zombie. It is interesting to
note that some of these outliers firms are public companies (like the owners of the road and rail networks) that do not
seem to match with the idea of zombie firms envisioned in the literature.
11
This category includes both firms which have opened a bankruptcy or a voluntary liquidation and firms which simply
exited the Cerved Group dataset.
12
Since EBITDA is never small than EBIT, there are no firms classified as zombies according to the EBITDA-based
measure and as non-zombies according to the EBIT-based one.
8investment rate in the following two years for the firms in these three groups13: in terms of future
performance, measured by the probability of closing the business and by future investment, the
misclassified (“only if EBIT”) firms are different, and better, of the “always zombie” ones. They
actually look more similar to the firms which have never been classified as zombies. Furthermore,
Figure 8 shows the probability of going back to “non zombie” status14 in two years for the firms
that are classified as zombie according to both EBIT and EBITDA, and for firms classified as
zombie according to the EBIT measure only: misclassified firms are much more likely to exit the
non-zombie status than the “always zombie” ones.
Second, the difference between EBIT and EBITDA stems from the extent to which a firm
amortized and depreciated capital. Then, firms which invested more in the past will have higher
depreciation and amortization. We test whether higher investment in year t-3 predicts larger
differences between EBIT and EBITDA by means of a simple OLS regression of the ratio of EBIT
to EBITDA in year t on (the log of) investment (or, alternatively, the investment rate) in t-3. The
results, shown in Table 3, confirm that the measure based on EBIT is more likely to classify as
zombie a firm with higher investment in previous years. Of course, in some cases the investment
might have been inefficient, but we do not see any reason for a measure of “zombiness” to be
biased in the direction of classifying as zombies, firms which have just made significant
investments.
Finally, we argue that measures of “zombiness” that are affected by amortization and
depreciation are especially problematic when making cross-country comparisons, because of
differences in country-specific accounting rules or policies. To the extent that this is an issue, we
should observe large differences in the ratio of EBIT to EBITDA across countries. This is indeed
the case: for example using ORBIS data for 2014, the EBIT is around 75 per cent of the EBITDA in
Italy and Germany, while it is much higher (around 90 per cent) in France, Portugal, Spain and the
UK (Table 4). Therefore, using the EBIT-based measure will likely overstate the incidence of
zombies in Italy and Germany relative to other countries. This can explain the large share of capital
trapped into zombie firms in Germany in 2013 detected by Adalet McGowan et al. (2017, see
Figure 1), which is admittedly rather puzzling in light of the excellent performance of the German
economy after 2010.
4. Comparing the alternative estimates available for Italy
The discussion so far highlights that recent measures of the incidence of zombie firms are
likely to provide an overestimate. Yet, it is useful to compare different measures and, on the basis of
such comparison, to provide an overall estimate of the incidence of zombie firms in Italy.
13
They plot the coefficients of a OLS regression the two variable of interest (a dummy variable equal to one if of the
firm has gone out in the market within 2 years and the average investment rate over a three years period starting in the
given year) on the set of 3 dummy variables (“always zombie”, “never zombie” and “only if ebit”) where we control
for total assets (in log) and on a set of dummy variables for the interaction of year, geographic area and sector of
production. The conditional means for each group are statistically different from each other.
14
We classify a firm as “non-zombie” two years after being classified as zombie in a given year if it is classified as
“non-zombie” by both the EBIT and the EBITDA OECD measures.
9To this aim we compare the OECD measures, which have been extensively cited in the policy
debate to two recent estimates of zombie firms in the Italian economy, provided by Schivardi et al.
(2017). This study is focused on identifying the occurrence of zombie lending and its real effects.
As a consequence they use a different indicator of zombie firms from that used by the OECD. In
their work a firm is considered to be a zombie in year t if the following conditions are met
1) the return on assets is above the prime rate, measured as the interest rate on new term
loans in the same year to firms in the best Z-score bins;
2) the leverage is above the median leverage among firms exiting the market because of
default or bankruptcy before the crisis.
The idea of using an indicator of profitability15 along with one of leverage aims at combining
the concepts of low return with that of high risk. According to this measure – here defined as
SCHIV1 –, in 2013 the share of zombie firms was in Italy between 8.1 (with EBITDA) and 10.5 per
cent, while the share of capital trapped into zombies between 13 (with EBITDA) and 16.4 per cent
(with EBIT). When for robustness purposes Schivardi et al. (2017) use an alternative measure
(SCHIV2) that combines the condition on leverage with the interest coverage ratio being above 1,
they estimate a share of zombie ranging between 5.4 (with EBITDA) and 7.2 per cent (with EBIT)
and a share of capital in zombie firms between 6.3 (with EBITDA) and 9.8 per cent (with EBIT).
Overall, the estimates of the importance of zombie firms proposed by the OECD is in the
upper range of the available measures, and is definitely the highest in terms of share of capital
trapped into zombie firms (see Table 5). This is true both comparing the EBIT-based and the
EBITDA-based measures of zombie firms.
Taking into account all the available estimates and the drawbacks of using the EBIT instead
of the EBITDA as a profitability measure, we would conclude that a reasonable estimate of the
incidence of zombie firms in Italy in 2013 is 7-8 per cent in terms of firms, and around 10 per cent
in terms of the share of capital.
5. Conclusion
This note suggests that the incidence of zombie firms may be overestimated when the proxy
used to identify zombie firms is based on profitability net of depreciation and amortization. This
measure has other undesirable characteristics when compared to one using profits gross of
depreciation and amortization: i) it is worse in predicting the future performance of firms; ii) it is
more likely to classify as zombies in a given year firms which invested heavily in previous years
15
In Schivardi et. al. (2017) the return on assets is computed using the EBIT. This less conservative measure is
chosen to avoid underestimating the phenomenon of zombie lending. With regard to the critiques raised above, it must
be considered that Schivardi et al. (2017) focus only on Italy without making any cross-country comparison. Thei
results hold through even when using the EBITDA.
10and amortized that investment quickly (for example to enjoy tax breaks); iii) it is especially
inappropriate for cross-country comparisons.
Taking account of these aspects is especially important when making policy prescription. For
example, recent work by the OECD (Adalet McGowan et al. 2017a and 2017b) identifies a large
incidence of zombie firms in several European countries, including Italy, and it concludes that
reforms improving bankruptcy procedures will boost productivity by speeding up the exit from the
market or the restructuring of zombie firms and helping the reallocation of capital and workers. We
do not dispute that more efficient bankruptcy procedures may be beneficial for Italy’s potential
growth16, but we believe that their importance may be overestimated if one does not consider the
strong upward bias in the OECD’s measure of “zombiness”. A more balanced analysis takes to a
richer and multi-faceted set of policy conclusions (Bugamelli and Lotti et al., 2018): especially
those aimed at fostering the development of new and innovative firms and at boosting human
capital accumulation.
Last, but not least, ultimately, a key question for policy makers is whether the presence of
zombie firms affects the performance of healthy ones, and therefore aggregate productivity and
GDP. Typically most studies, including Adalet McGowan et al. (2017a and 2017b), use difference-
in-difference specifications where the idea is to test whether and to what extent the performance of
healthy firms (in terms of sales and employment growth or investment) is negatively affected by the
share of zombies operating in the same relevant market (country-industry or similar). This empirical
approach has been recently questioned by Schivardi et al. (2017) who argue that it is highly mis-
specified leading to an overestimation of the negative impact of zombie firms on healthy ones.17
Using a different specification18 that carefully controls for aggregate shocks, Schivardi et al. (2017)
find that the presence of zombie firms has had a very limited impact on healthy firms.
Quantitatively, it can explain between 10 and 20 per cent of the GDP drop experienced by Italy
during the crisis years (2008-2013). They also estimate a small impact of zombie firms on TFP
dispersion, a popular measure of misallocation of resources. Overall, Schivardi et al. (2017) point to
a negative contribution of zombie firms on growth which is at best limited, definitely much smaller
than that estimated by the OECD.
Importantly, these findings suggest that it is not clear that killing zombie firms would be
particularly useful to boost productivity and improve the allocation of resources, during a demand-
driven recession. Forcing zombie firms out of the market (a third of which returns to non-zombie
16
See, for example, Giacomelli and Menon (2017) who shows that poor contract enforcement can importantly affect
firms’ incentives to grow, or Rodano et al. (2016) that shows that more efficient liquidation procedures reduce the ex-
ante cost of credit.
17
The intuition they provide goes as follow: negative aggregate shocks, that may likely have a differential impact on
healthy and unhealthy firms which is as such not controlled by time (or industry*time) fixed effects, mechanically
generate a negative correlation between the increasing share of zombie firms and the worsening relative performance of
healthy firms, even in the absence of true effects of the former on the latter.
18
The share of credit provided by low capital banks in a given industry-province cluster is used as a proxy for the
incidence of zombie lending.
11status the next year) may then lead to higher unemployment, unused capacity and a further
reduction in demand, potentially contributing to exacerbate the recession19.
To conclude, our analysis suggests that probably too much emphasis is being posed on the
potential negative effects of zombie firms. The idea is theoretically appealing, but it seems to matter
little to explain the depth of the recession in the Eurozone (or at least in Italy).
19
For example Bernstein et. al (2017a) show that the long-run utilization of assets of liquidated firms is lower relative
to assets of reorganized firms and that these effects are concentrated in thin markets with few potential users. Bernstein
et. al (2017b) show also that employment declines substantially in the immediate neighborhood of the liquidated
establishments, relative to reorganized establishments.
12Figure 1 13
Figure 2

Figure 3

14
Figure 4

Figure 5

15
Figure 6

  Figure 7

   16
Figure 8

17
Table 1: "Zombie" firms’ incidence
                                                (share in all active firms, percentage)
                              Number of firms                                               Total assets
   Year              all firms          excluding outliers                      all firms            excluding outliers
                 ebit        ebitda      ebit      ebitda                   ebit        ebitda        ebit      ebitda
1997             7.3           5.0        7.3        5.0                    18.7         10.1         17.8       10.0
1998             7.7           5.3        7.7        5.3                    14.1          7.9         17.2        9.7
1999             7.4           5.1        7.4        5.1                    14.8          8.2         16.1        9.0
2000             7.0           4.8        7.0        4.8                    14.4          8.3         15.5        8.6
2001             6.8           4.6        6.8        4.6                    16.1          9.0         16.5        8.5
2002             6.6           4.4        6.6        4.4                    15.8          8.1         16.8        7.9
2003             6.7           4.4        6.7        4.4                    16.9          9.2         17.5        9.2
2004             6.4           4.2        6.4        4.2                    14.3          7.2         15.5        8.0
2005             6.3           4.1        6.3        4.1                    13.5          7.0         15.1        7.7
2006             6.1           4.0        6.1        4.0                    11.3          5.8         12.8        6.5
2007             5.9           3.9        5.9        3.9                    12.0          6.8         12.8        7.0
2008             6.0           4.0        6.0        4.0                    13.1          6.7         13.9        7.4
2009             6.4           4.2        6.4        4.2                    14.5          7.2         14.9        7.5
2010             7.2           4.7        7.2        4.7                    18.3         10.1         15.9        8.3
2011             7.5           4.9        7.5        4.9                    18.3         10.4         16.7        8.4
2012             7.6           4.9        7.6        4.9                    21.0         13.0         17.0        8.8
2013             7.8           5.1        7.8        5.1                    21.7         11.8         18.1        9.5
2014             8.1           5.4        8.1        5.4                    22.7         12.7         18.5       10.1
2015             7.2           4.8        7.2        4.8                    20.4          9.3         17.2        9.6
Source: CERVED 1995-2015. We exclude from zombie and from the total of firms, both inactive firms and those firms for which the
zombie status cannot be calculated. A firm is defined as not active if we know that it has started a liquidation or a bankruptcy
proceeding or if it has disappeared from CERVED database. We define a firm as an outlier if it has total fixed assets greater than
                 th
100 times the 99 percentile of the total fixed assets distribution.

                                                               18
Table 2: The transition from zombie status in a given year
EBIT definition EBITDA definition
dead or zombie dead or zombie
year not not
zombie out of status not zombie out of status not
zombie zombie
dataset available dataset available
1997 35.5 12.6 14.3 37.6 33.2 14.1 14.9 37.8
1998 35.4 12.2 17.1 35.2 32.8 13.5 18.0 35.8
1999 36.3 12.8 18.2 32.7 33.3 14.0 18.9 33.7
2000 37.5 12.9 19.0 30.6 34.3 14.4 20.2 31.1
2001 37.1 12.4 18.0 32.5 33.8 13.8 19.1 33.4
2002 36.9 12.4 16.4 34.3 33.6 13.9 17.9 34.6
2003 36.3 13.1 14.3 36.2 33.2 14.7 15.6 36.5
2004 36.4 13.0 14.7 35.9 33.5 14.7 16.0 35.8
2005 36.5 13.6 15.8 34.2 33.6 15.5 16.9 34.1
2006 37.7 13.7 15.9 32.7 34.3 15.4 16.7 33.5
2007 39.4 14.0 15.3 31.4 35.6 15.6 16.3 32.5
2008 39.8 14.2 13.8 32.2 35.7 15.9 14.9 33.4
2009 39.0 15.0 14.3 31.7 34.8 17.2 15.7 32.3
2010 37.8 16.3 15.6 30.3 33.1 19.0 17.0 30.9
2011 36.4 17.3 16.2 30.1 31.5 20.1 17.8 30.6
2012 32.8 17.5 17.1 32.6 28.5 20.4 18.7 32.4
Source CERVED 1995-2015. For all the zombie firms in a given year the table reports the share of firms in different status three
years after: “dead or out of dataset”, means that the firm has either started a liquidation or a bankruptcy proceeding, or it has
exited the dataset; “zombie status not available” implies that the firm is in the dataset but it was not possible to construct the
zombie indicator; “zombie” implies that the zombie status is available and positive; “not zombie” imply that the zombie status is
available and negative.
19Table 3: Past investment and the ratio of EBIT over EBITDA
(1) (2)
Investment (t-3, log) -0.0104***
(0.0025)
Investment (t-3) / Total Assets (t-3) -0.1229***
(0.0358)
Total Assets (t-3, log) 0.0597*** 0.0570***
(0.0057) (0.0058)
Revenues (t-3, log) -0.0164*** -0.0198***
(0.0042) (0.0041)
Total fixed assets (t-3, log) -0.0539*** -0.0561***
(0.0034) (0.0033)
N 4318610 4318610
R2 .0002659 .0002647
Source: CERVED 2001-2015. OLS regression of the ratio of EBIT to EBITDA on investment 3 years before: in column (1) we
have investment in log; in column (2) we have the ratio of investment to total assets. In all the regressions we control for dummies
for the interaction of year, industry (8 categories, manufactory, commerce, hotel and restaurants, constructions, utilities and
transports, real estates, information and communication, other services) and geographical area (north-west, north east, center,
south and isles).
Table 4: median ratio EBIT/EBITDA
Germany 73.34%
Spain 89.83%
France 85.32%
UK 89.30%
Greece 82.39%
Ireland 77.59%
Italy 75.89%
Portugal 90.85%
Source: ORBIS 2014.
20Table 5: Incidence of zombie firms in 2013
(different measures, percentage)
OECD SCHIV 1 SCHIV2
EBITDA EBIT EBITDA EBIT EBITDA EBIT
Share of zombie firms 5.1 7.8 8.1 10.6 5.4 7.2
Share of capital sunk in zombie firms 11.8 21.7 14.1 17.8 6.8 10,7
Share of inactive firms among zombie 44.5 36.4 30.9 26.1 38.0 32.3
Source: Cerved 2010-2013. We exclude from zombie and from the total of firms, both inactive firms and those firms for which the
zombie status cannot be calculated. A firm is defined as not active if we know that it has started a liquidation or a bankruptcy
proceeding or if it has disappeared from CERVED database.
21References
Acharya, V., S. Bharath, A. Srinivasan, 2007, “Does industry-wide distress affect defaulted firms?
Evidence from creditor recoveries”, Journal of Financial Economics, 85, 787-821.
Acharya, V., T. Eisert, C. Eufinger, and C. Hirsch 2017, “Whatever it takes: The Real Effects of
Unconventional Monetary Policy”, CEPR, Discussion Papers, No 12005.
Adalet-McGowan M., D. Andrews, and V. Millot, 2017a, “The walking dead? Zombie firms and
productivity performance in OECD countries”, OECD Economics Department Working Papers, No 1372.
Adalet-McGowan M., D. Andrews, and V. Millot, 2017b, “Confronting the zombies: Insolvency and
financial reform, corporate restructuring and productivity growth”, OECD WP prepared for the WP!-
October 2017.
Andrews, D., and F. Petroulakis, 2017, "Breaking the Shackles: Zombie Firms, Weak Banks and
Depressed Restructuring in Europe", OECD Economics Department Working Papers, No 1433.
Asquith, P., R. Gertner, and D. Scharfstein, 1994, “Anatomy of financial distress: An examination of
junk-bond issuers”, Quarterly Journal of Economics, 109, 625-658.
Bernstein S., E. Colonnelli, and B. Iverson, 2017a, “Asset allocation in bankruptcy”, NBER Working
Paper, No 23305.
Bernstein S., E. Colonnelli, X. Giroud, and B. Iverson, 2017b, “Bankruptcy spillovers”, NBER
Working Paper, No 23162.
Bobbio, E., 2016. “Tax evasion, firm dynamics and growth”. Bank of Italy, Quaderni di Economia e
Finanza, No 357.
Caballero, R. J., T. Hoshi, and A. N. Kashyap, 2008, “Zombie Lending and Depressed Restructuring
in Japan”, American Economic Review, 98, 1943-1977.
Campbell, J. Y. and G. B. Taksler, 2003, “Equity Volatility and Corporate Bond Yields”, The Journal
of Finance, 58, 2321-2350.
Carey M., M. Post, and S. A. Sharpe, 1998, “Does Corporate Lending by Banks and Finance
Companies Differ? Evidence on Specialization in Private Debt Contracting”, The Journal of Finance, 53,
845-878.
Denis, D. J., and V. Sibilkov, 2010, “Financial Constraints, Investment, and the Value of Cash
Holdings”, Review of Financial Studies, 23, 247-269.
Faulkender M. and M. Petersen, 2006, “Does the Source of Capital Affect Capital Structure?”, Review
of Financial Studies, 19, 45-79.
Frank, M. and V. Goyal, 2008, “Trade-off and Pecking Order Theories of Debt”, in Espen Eckbo (ed.)
The Handbook of Empirical Corporate Finance, Elsevier Science, Chapter 12, 135-197.
Giacomelli, S. and C. Menon, 2017, “Does weak contract enforcement affect firm size? Evidence from
the neighbour’s court”, Journal of Economic Geography, 17, 1251-1282.
22Kaplan S. N., and P. Strömberg, 2009, “Leveraged Buyouts and Private Equity”, The Journal of
Economic Perspectives, 23, 121-146.
Obstfeld, M., and Duval, R. 2018, “Tight monetary policy is not the answer to weak productivity
growth”, VoxEu.
Rajan, R., and L. Zingales, 1995, “What Do We Know about Capital Structure? Some Evidence from
International Data”, Journal of Finance, 50, 1421-60.
Rodano, G., N. Serrano-Velarde, and E. Tarantino, 2016, “Bankruptcy Law and Bank Financing”,
Journal of Financial Economics, 120, 363-382.
Schivardi F., E. Sette, and G. Tabellini, 2017, “Credit Misallocation During the European Financial
Crisis”, LUISS Guido Carli/School of European Political Economy Working paper, No 3/2017.
Storz M., M. Koetter, Michael, R. Setzer, and A. Westphal, 2017. "Do we want these two to tango?
On zombie firms and stressed banks in Europe", European Central Bank Working Paper Series No 2104.
23You can also read