Emerging Evidence of a Silver Lining: A Ridge Walk to Avoid an Economic Catastrophe in Italy and Spain - Christopher Busch Alexander Ludwig Raül ...
←
→
Page content transcription
If your browser does not render page correctly, please read the page content below

Christopher Busch
Alexander Ludwig
Raül Santaeulàlia-Llopis

Emerging Evidence of a Silver Lining:
A Ridge Walk to Avoid an Economic
Catastrophe in Italy and Spain

SAFE White Paper No. 67 | April 2020

Emerging Evidence of a Silver Lining: A Ridge Walk to Avoid
an Economic Catastrophe in Italy and Spain
Christopher Busch, Universitat Autònoma de Barcelona and SAFE
Alexander Ludwig, Goethe University Frankfurt and SAFE
Raül Santaeulàlia-Llopis, Universitat Autònoma de Barcelona
April 2020
The White Paper is updated on a regular basis, please find the latest working paper version here.
Summary
1. The coronavirus has led to a human tragedy, but it need not end up in an economic catastrophe.
2. In Southern Europe there are signs of a silver lining: the growth rate of the total number of deaths
attributed to the coronavirus has been decreasing for weeks in Italy and Spain.
3. While the effect of the connement measures aim at limiting the spread of the virus is at best uncer-
tain, the economic and social costs of a prolonged lockdown are much less ambiguous and poten-
tially huge. Importantly, these costs can be very unequally distributed.
4. We argue that it is therefore time to start thinking about how to gradually unlock these countries,
and we make some suggestions along this line starting with large-scale testing and continuous re-
testing as the most useful pre-condition.
I. A Human Tragedy
The uncertainty around the impact of the coronavirus spreading around the world is huge, as we still
know little about both the actual infection rate and fatality rate of the virus. At the same time there is
little disagreement that the epidemic has led to a human tragedy almost everywhere we look. Europe
(prominently Italy and Spain) and the U.S. are unambiguously the two current global hot spots.
II. Evidence of a Silver Lining
There seems to be a silver lining for Southern Europe, however. First, for some time now, although the
number of deaths attributed to the coronavirus in Italy and Spain has been increasing, it is doing so at
a slower pace. In Figure 1, we show the growth rate of the accumulated number of deaths attributed
to the coronavirus in Spain and Italy. Currently, Italy already shows a growth rate in the stock of deaths
SAFE Policy Letters represent the authors‘ personal opinion and do not necessarily reflect the views of the Leib-
niz Institute for Financial Research SAFE or its staff. We thank Jordi Caballe, Zhao Jin, Dirk Krueger, Osman
Kücüksen, Ana Nuevo, Francesc Obiols, Ludo Visschers and Hanna Wang for very helpful comments.
1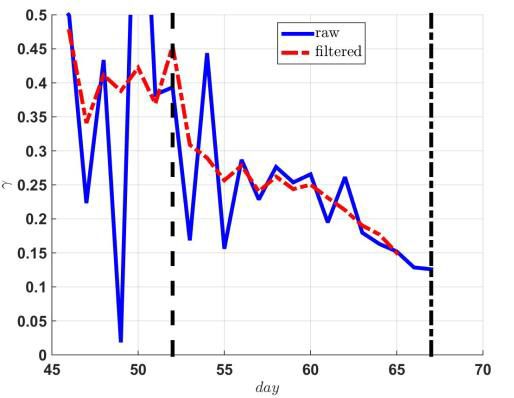
of below 10% and Spain is closely following with some lag - the growth rate of the stock of deaths in
Spain has been decreasing over the past two weeks from a peak around 60% to figures below 15% (see
panel (a)). This pattern mirrors the one in Italy (see panel (b)), and both countries show some similarity
to the Hubei region, even though the decline there happened somewhat faster (see panel (c)). South
Korea also follows the same pattern with what seems a lower peak, around 20%, and current values
below 5% (see panel (d)). We are still far from the goal of zero growth, but it all indicates we will get
there. It is then plausible to assume that the same will follow for the rest of the EU, the U.S., and the
globe. Currently, the U.S. is still at early stages of the epidemic with an increasing pattern in the growth
of accumulated corona deaths (see panel (e)), and the same pattern arises for the globe after removing
the effects of China (see panel (f)).

We take the reported death toll at face value but note that there is a big debate on its measurement
(e.g., see here or here). However, note that if the measurement error in the number of deaths is clas-
sical (e.g., in France dying at home from corona is consistently not reported as a corona death by now),
then this should bear no impact on the growth rate that we show in Figure 1. Therefore, and given the
notorious and frustrating lack of testing for the virus in the general population, we argue that the
growth rate of deaths attributed to the coronavirus is a more accurate measure to consider than the
number (or growth rates) of infections. We also find the death growth rate to be a more preferable
measure given the difficulties of estimating a mortality (or case fatality) rate during an outbreak. Note
that in order to compute mortality (or case fatality) rates for coronavirus one needs not only to correct
for incubation periods between infection and death (knowledge of which is currently imprecise), but
also control for the number of asymptomatic cases that recovered (which is currently unknown with-
out testing). Without proper widespread testing, we simply neither know corona prevalence nor new
corona infections (see the discussion here). In summary, while acknowledging caveats in this measure-
ment, we find it more reasonable to base policy on a peak in death growth rates than on a not meas-
urable peak of coronavirus infection prevalence.1 In this context, we consider Italy and Spain (also Hu-
bei and South Korea) mature in the corona epidemic in the sense of having already surpassed the peak
of cumulative deaths growth.2 In addition to the growth rate, Figure 2 directly shows the development
of the number of deaths per day. For Italy and Spain, the emerging pattern is an S-shape which further
indicates that the epidemic is at a mature stage: the typical epidemiological curve implies that we
should expect a fall of the number of deaths per day, which corresponds to the dynamics seen in Hubei.

1
  We owe our perspective on the growth rate of the number of deaths to Ritschl (2002).
2
  The term of a mature epidemic usually refers to the stability around (or the surpassing of) the epidemic preva-
lence peak (see this). Given the inaccuracy of the prevalence of the current corona outbreak and our discussion
of the cumulative corona deaths growth rate as a preferable measure, we define the maturity using this statis-
tic.
                                                                                                               2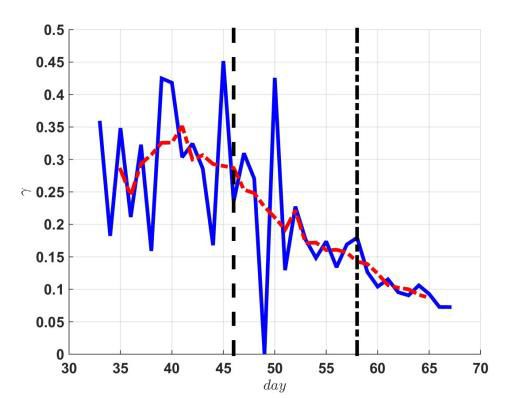
Figure 1: Growth Rate of Accumulated Number of Deaths

                  (a) Spain                                                              (b) Italy

                  (d) Hubei, China                                                     (c) South Korea

                   (e) United States                                                        (f)   Global

Notes: Growth rate in the number of deaths reported as caused by coronavirus disease 2019 (COVID-19) by day since January
22, 2020 corresponding to day 0 in the graph. Sample selection criterion: number of deaths exceeds 5. The solid line shows
the raw data, the dashed line is a smoothed series by applying a 5-day moving average filter. Vertical lines in the plots for
Spain, Italy and Hubei show the dates of confinement measures in the respective country/region. Source: Own calculations
based on data from the COVID-19 (2019-nCoV) Data Repository, Johns Hopkins University.

                                                                                                                           3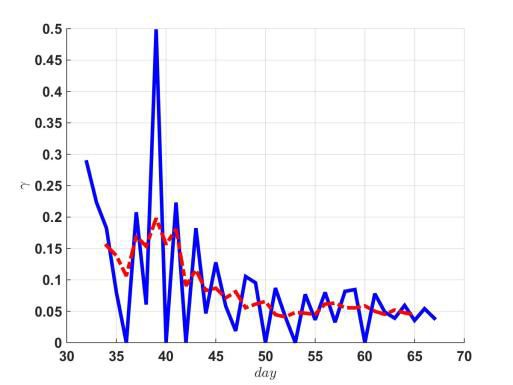
Of course, besides the development of the epidemic itself, what matters for the assessment of the
current situation is the number of active cases, calculated as the number of confirmed infected cases
minus number of dead or cured. While the number of confirmed infected cases is problematic to assess
the stage of the epidemic (given the problem of not having information for the population or a repre-
sentative sample) and while the number of cured cases is also measured with error, we view the cal-
culated number of active cases as a good proxy for the number of patients in need of hospitalization,
which is crucial to assess the implications for the capacity of the hospital system. Figure 3 shows the
log of the number of active cases, and while it is still increasing, the slope is clearly flattening out in
Italy and Spain. The number of daily confirmed cases is shown in Figure 4. Similar to the number of
deaths, it follows an S-shape pattern for Italy and Spain, which we view as a good lead indicator for the
active cases to soon start dropping, as observed in Hubei. We can thus conclude that there is a silver
lining in Italy and Spain. In summary, while acknowledging caveats in this measurement, we find it
more reasonable to base policy on a peak in death growth rates than on a not measurable peak of
coronavirus infection prevalence.

III. Public Health Policies to Contain the Spread: Very Heterogenous

Given the severe symptoms of some infected persons that necessitates treatment with ventilators in
intensive care units, a huge challenge for health systems is to avoid hitting the capacity limit during an
epidemic. The degree of public health policies to contain the spread is very heterogeneous across the
globe. A common denominator of the various policies is the introduction of policies that limit social
contact (social distancing), which are based on the understanding that the virus spreads through con-
tact with infected individuals. These policies followed the example of Hubei, China, where the govern-
ment cut-off the capital Wuhan on January 23, followed by the shutdown of all non-essential compa-
nies, including manufacturing plants on February 13, which was extended on February 20, additionally
including school closures. Importantly, China also quickly increased hospital capacity by setting up
emergency hospitals. Over the course of March, all European countries introduced school closures. In
both Spain and Italy, the two most affected European countries as of now, strict exit restrictions for
the population have been in place for the last weeks. In Spain, this lockdown has been in place since
March 15, and was extended to a complete shutdown of “non-essential” economic activity starting
March 30. Spain thereby follows the Italian lockdown policy, which enacted a nation-wide lockdown
on March 9 and the shutdown of “non-essential” economic activity on March 21, after first implement-
ing regional quarantine measures. Looking at other countries in Europe, e.g., France followed the same
route, whereas Germany has introduced strict contact restrictions without prohibiting citizens to leave
the house. In the U.S., policies vary across states, e.g. California announced a state-wide stay at home
order on March 19 and New York on March 21. Once the look turns to Asian countries, policies vary
                                                                                                          4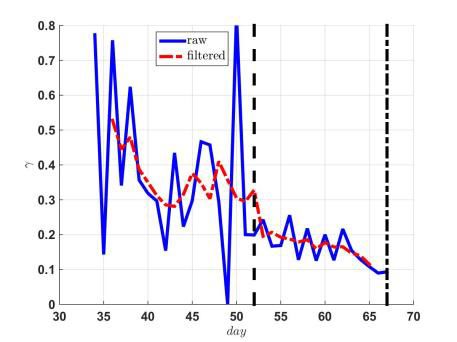
even more as measures do not only relate to exit and contact restrictions, but also include measures
that aim at precisely confining the epidemic. For example, South Korea resorted to using CCTV footage
and GPS tracking data of the population in order to identify networks of infection. 3

Figure 2: Number of Daily Deaths

                (a) Spain                                                                 (b) Italy

                                                  (c) Hubei, China
Notes: Deaths reported as attributed to coronavirus disease 2019 (COVID-19) by day since January 22, 2020 corresponding
to day 0 in the graph. Sample selection criterion: number of infected exceeds 5. The solid line shows the raw data, the dashed
line is a smoothed series by applying a 5-day moving average filter. Vertical lines in the plots for Spain, Italy, and Hubei show
the dates of confinement measures in the respective country/region. Source: Own calculations based on data from the COVID-
19 (2019-nCoV) Data Repository, Johns Hopkins University.

3
    See also this for a nice and detailed description of implemented public health policies.
                                                                                                                               5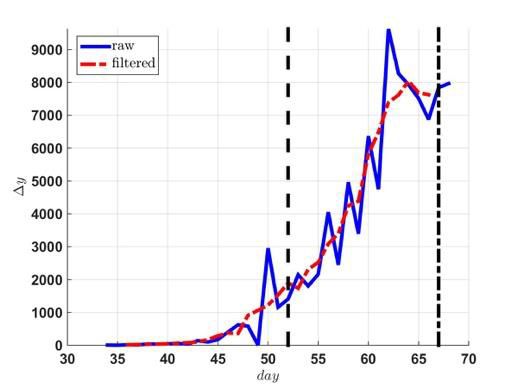
Figure 3: Number of Active Cases (in Logs)

                        (a) Spain                                                                     (b) Italy

                                                                (c) Hubei, China

Notes: Log of number of active cases infected with coronavirus disease 2019 (COVID-19) by day since January 22, 2020 cor-
responding to day 0 in the graph. Active cases is number of infected minus number of dead or cured. Sample selection crite-
rion: number of active cases exceeds 5. Vertical lines in the plots for Spain, Italy, and Hubei show the dates of confinement
measures in the respective country/region. Source: Own calculations based on data from the COVID-19 (2019-nCoV) Data
Repository, Johns Hopkins University.

                                                                                                                           6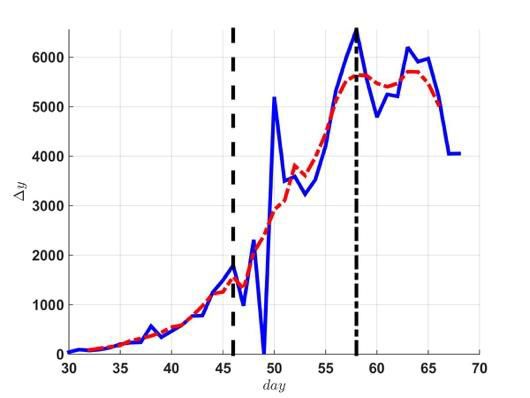
Figure 4: Number of Daily Confirmed Cases

                   (a) Spain                                                                   (b) Italy

                                                         (c) Hubei, China

Notes: Daily number of newly infected by coronavirus disease 2019 (COVID-19) by day since January 22, 2020 correspond-
ing to day 0 in the graph. Sample selection criterion: number of infected exceeds 5. The solid line shows the raw data, the
dashed line is a smoothed series by applying a 5-day moving average filter. Vertical lines in the plots for Spain, Italy, and
Hubei show the dates of confinement measures in the respective country/region. Source: Own calculations based on data
from the COVID-19 (2019-nCoV) Data Repository, Johns Hopkins University.

                                                                                                                                7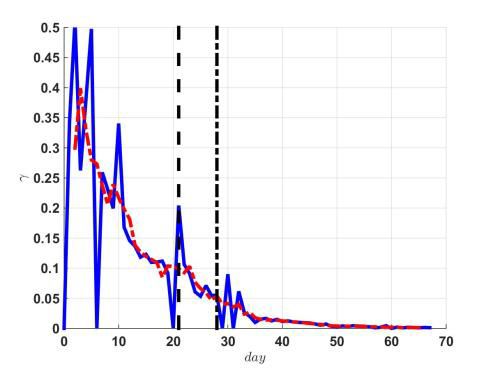
IV. Are the Currently Implemented Lockdowns Containing the Within-Country Corona
Deaths and the Spread of the Virus?

The evidence that is slowly emerging suggests that the answer to this question is a tentative no, at
least in Italy and Spain. First, putting together the dates when first measures of confinement and lock-
downs were implemented (see vertical lines in Figure 1), it is clear that this happened when the growth
rate of accumulated deaths was already declining in both Italy and Spain. Second, the primary goal of
a lockdown is the reduction of infections (flattening the curve of corona prevalence) in order to avoid
the collapse of hospitals - as already witnessed in Spain and Italy. For this reason, and despite our
concerns regarding the measurement of infections stated above, we show in Figure 2 the growth rate
of the number of confirmed COVID-19 cases in Spain, Italy and Hubei, China. Taking an incubation
period of 2 to 14 days into account, the graph of neither country/region, especially not the one of
Hubei, lead us to conclude that the measures were particularly successful: the growth rate of con-
firmed cases in Italy and Spain had been decreasing for many days before the first measures were
taken. However, in Hubei, already before enacting strict stay home orders by mid-February, the gov-
ernment called for citizens to stay home and keep social distance. Thus, the lockdown measures that
have been implemented at early stages of the epidemic may possibly show a more direct effect – other
than those in Italy and Spain, where the implementation happened only at mature stages of the epi-
demic. Compliance with the call for staying at home prior to the actual lockdown in Hubei could point
in that direction. At the same time, a large number of disease transmissions appears to take place
inside households or healthcare institutions, and a large fraction of infected individuals show few
symptoms, if at all, so that it is likely that the virus had already spread substantially before any con-
finement measures were taken and continued to spread thereafter (Mizumoto et al., 2020). Further,
general lockdown measures are a very non-targeted policy that does not help to protect those in need
- e.g., the virus has already spread to nursing homes (see, e.g., here).

We can thus conclude that (any extensions of) general confinement measures are decisions in the dark
with no (or at best very uncertain) evidence of success.4 It seems that the race for public health policies
through confinements and lockdowns to contain the spread is somewhat lost in countries like Spain
and Italy, and the important race that should have all the spotlight and efforts is that of policies that
rapidly increase ICU and hospital capacity as well as the required equipment (e.g. ventilators) to deal
with the upcoming tsunami of corona sick individuals.

4
 An alternative to the study of the empirical behavior of the epidemic that we pursue is the use of models to
contagion to see the effects of social distance policies; see Casares and Khan (2020) for the case of Spain, and
Donsimoni et al. 2020 for Germany.
                                                                                                                   8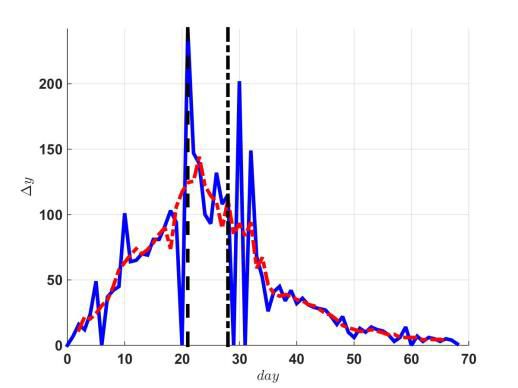
Figure 5: Growth Rate of Accumulated Number of Confirmed Cases

                 (b) Spain                                                              (a) Italy

                                                    (c) Hubei, China

Notes: Growth rate in the number of deaths reported as caused by coronavirus disease 2019 (COVID-19) by day since January
22, 2020 corresponding to day 0 in the graph. Sample selection criterion: number of deaths exceeds 5. The solid line shows
the raw data, the dashed line is a smoothed series by applying a 5-day moving average filter. Vertical lines in the plots for
Spain, Italy, and Hubei show the dates of confinement measures in the respective country/region. Source: Own calculations
based on data from the COVID-19 (2019-nCoV) Data Repository, Johns Hopkins University.

VI. Fueling an Economic Catastrophe: A Lockdown Plus its Remedy

While the success of the (well-intended) lockdown measures initiated to contain the epidemic is at
best uncertain, they can be expected to generate high cost - both direct economic costs associated
with the shutdown of economic activity and manifold indirect costs, e.g., due to foregone schooling,
detrimental effects on physical and psychological health, etc. This poses a clear and hard-to-balance
trade-off between public health policies that target reductions in infections (or deaths) and the eco-
nomic costs associated with these policies (e.g., Atkeson, 2020; Alvarez et al., 2020; or Eichenbaum et
al., 2020, Piguillem and Shi, 2020).

(a) Aggregate and distributional effects: There is a growing wealth of studies estimating the impact of
    public health policies aimed at containing the corona epidemic (i.e., lockdowns) on macroeco-
    nomic performance. For instance, a study for Germany has computed that the annual costs of a
    two-months shutdown may lead to a reduction of annual GDP growth by 7.2 to 11.2 percentage
    points (see here). The lower bound estimate is comparable to the costs of the financial market
    crisis which reduced per capita GDP in Germany by 5.1 percent in 2008. Effects in Spain and Italy
                                                                                                                           9
can be expected to be of at least the same or even larger magnitude. For example, the Spanish
economy relies more heavily on the service sectors that are particularly vulnerable, e.g., tourism
which represents 11.7% of Spanish GDP (see here), while in some regions this figure is much higher
(e.g., 44.8% in Mallorca, see IMPACTUR).
In addition to being high, the costs are not borne by everyone equally, and thus the lockdown can
be expected to have very undesirable distributional consequences. While some employees can
move their desk job to the home office, many others lose their jobs, self-employed risk losing their
businesses, small enterprises are forced to close down and some sectors, such as services, arts or
tourism, will be particularly affected. Similarly, prolonged school closures will have particularly bad
consequences for children from families with low income and less education. These children do
not receive the same time input into schooling as others, which increases social disparities. Fur-
ther, let us not forget that a lockdown also largely kills the underground economy, which is not a
trivial component of the economic activity (e.g., above 15% of GDP for France and Germany, above
20% for Spain and above 25% for Italy and Greece, see here) and used by many individuals to make
ends meet at the end of the month.
There is a similar uncertainty around the many indirect (not necessarily economic) costs of the
lockdown measures. The channels are manifold and range from psychological costs of social dis-
tancing, over adverse health consequences of financial stress, possible increases of alcoholism,
domestic violence and suicides due to factual confinement in a stress situation, to detrimental
health effects of reduced physical activity. Like the economic costs, the indirect costs are unequally
distributed as well. Some are directly triggered by the economic costs and thus hit those who also
suffer economically. Other health costs are a consequence of restrictions to leave the house. Such
a restriction is, of course, more severe for a family that lives in a small at than for one that can
enjoy the amenity of a garden and it is particularly severe for the elderly - and thus the group that
is intended to be protected the most – whose health status can be expected to deteriorate from
the lack of physical activity. At the very least the very high and unequally distributed costs should
play are more dominant role in the public debate, which is currently dominated by metaphors of
war (see, e.g., here).
(b) Insurance policies that bite you back down the road: The foreseen negative economic impact of
prolonged lockdown policies - an unprecedented negative supply shock - is making governments
enact various countermeasures which will increase government debt. In Spain, the planned direct
economic aid amounts to 100 billion euros, which is approximately 7.6% of Spanish GDP. That
would mean that the government debt-to-GDP ratio, which currently stands at about 100%, could
increase to about 120% in total: suppose that an economic lockdown of two months leads to a
reduction of GDP by 10%. This by itself will increase the government debt-to-GDP ratio to 111%.
10The additional fiscal package will further lead to an increase to about 120%. While this may be
sustainable, it will imply an increase of taxes paid by future generations of workers to reduce the
level of outstanding debt. This ratio will increase further if the government, reasonably, forgives
taxes to businesses without economic activity (in particular, small businesses and self-employed)
during the lockdown period.
VII. Unlocking the Economy: A Ridge Walk Policy
In light of the previous discussion, it appears important that policymakers do not only consider the
direct health costs associated with the corona epidemic, but also the potentially very large costs trig-
gered by the economic lockdown and the social restrictions. Given the large uncertainty around both,
all policy decisions are made in the dark and policymakers enacted policies under the impression of a
worst-case scenario. We argue that in countries like Spain and Italy, we should start to think about
ways of gradually unlocking the economy. Clearly, this needs to be done very carefully, given that there
are still infected and infectious parts of the population that could keep the outbreak alive. Our sugges-
tions for this ridge walk to unlock the economic activity are as follows:
1. Aggressive and widespread testing. Now!
To learn the source of the problem (who are the infected and infectious in the population?), wide-
spread representative testing of persons is a must and just cannot wait. As of today, we are effec-
tively clueless about corona prevalence (and infection) rates since official numbers are almost in-
variably based on non-random samples. An essential reason for widespread testing is to capture
the undocumented contagious infected individuals (see Li et al., 2020). This can be done with drive-
through stations (see this).
As a first cut at this, we should administratively test the entire medical staff, which, given their
high exposure, should provide us with an upper bound estimate of the corona prevalence (and
infection) rate for the working-age population.
E.g., Germany is on the way of conducting large-scale testing. Even if the testing cannot be done
for the entire population, large representative samples can be useful to identify subsets (occupa-
tions/industries) where economic activity can be unlocked. To learn about these dimensions the
testing should be accompanied by survey questions related to labor market activities (e.g., occu-
pations) that help infer the volume of interactions at work as well as questions on household com-
position (and family) that helps infer the volume of off-work social interactions.
Subsequent waves of representative samples should oversample groups with high prevalence. Fur-
ther, there should be re-testing to keep track of the dynamics of the infected (whether sympto-
matic or not).
112. Return to economic activity after testing (under some conditions)
Informed by the representative tests, economic activity should be unlocked. To begin with, those
from groups with low prevalence should be allowed to return. If representative tests point to large
parts of the population already being infected, then lifting of the lockdown should be considered.
3. Commuting and Public Transportation
A critical aspect of returning to economic activity is the use of public transportation for commuting.
In order to avoid high risk of contagion, we argue for the re-establishment of public transportation
at full capacity. To keep social distancing in place, firms should be demanded to spread the work
day from, say, the regular 8 hour period to 16 hours. The work schedule of employees should be
adjusted accordingly, such that, say, 1=6 of employees starts working (and thus commuting) every
30 minutes and correspondingly returns home to work every 30 minutes. Temperature check-
points (with perhaps mandatory random checks) should be stationed in the public transport.
4. Protect the elderly, the weak and the highly exposed
Since social distancing leads to high psychological costs and reduced physical activities by the el-
derly, allow for visits by tested persons. To those elderly for which visits by tested family members
is not possible, tested (volunteer) social workers must be employed as a substitute. In addition,
body temperature screening checks for those accessing these vulnerable populations should be
conducted before contact (at least, on daily basis).
5. Education
Given the potentially large aggregate and distributional consequences of closed schools, they must
reopen. Education personnel and students should be tested and show credentials of negative test-
ing. Further, body temperature screening on any person (child or adult) must be conducted before
the person is allowed to enter the premises. The same holds for kindergarten, since supervision of
young children cannot be maintained by parental households who return to work or who are facing
time constraints because of hospitalization of some of their adult members. In contrast, universi-
ties can remain closed for a longer time since the switch to online training systems is less costly in
this case.
6. Social activities
Allow non-quarantined citizens to walk and exercise outside (at least in pairs of the same house-
hold as it is done, e.g., in Germany). If necessary, this could be restricted to non-overlapping neigh-
boring public areas (or streets). The goal here is to diminish the physical and mental health costs
of confinement which can be huge for large part of the population.
12Furthermore, restaurants and bars should be allowed to reopen but require visitors to keep dis-
tance, following the current practice in China, see here.
7. Fines
Since there do likely not exist sufficient capacities to monitor business-related and leisure-related
activities after the economy starts to unlock, the violations of the above must be sanctioned with
very huge fines. In Spain, fines can legally go up to 30,000 euros, and the average fine tends to be
around 600 euros which is 1/50 the average annual income. For sure, with limited capacities for
monitoring, large fines need to be in place, in particular, for those individuals placed in quarantine.
8. Summer vacation
Unions, business owners and the government should coordinate on a partial suspension of the
August summer vacation to partially compensate the loss of economic activity.
9. Coordination and cooperation
Local authorities within countries should coordinate closely to contain the crisis. This is a time for
cooperation and support.
Literature
Alvarez, F., D. Argente, and F. Lippi (2020). A Simple Planning Problem for COVID-19 Lockdown, mimeo.
Casares, M. and H. Khan (2020). A Dynamic Model of COVID-19: Contagion and Implications of Isolation
Enforcement, Working Paper D.T. 2001 UPNA.
Donsimoni, J.R., R. Glawion, B. Plachter and K. Wälde (2020). Projecting the Spread of COVID19 for
Germany, Working Paper.
Eichenbaum, M.S., S. Rebelo, and M. Trabandt (2020). The Macroeconomics of Epidemics, Working
Paper.
Li R., S. Pei, B. Chen, Y. Song, T. Zhang, W. Yang and J. Shaman (2020). Substantial undocumented
infection facilitates the rapid dissemination of novel coronavirus (SARS-CoV2). Science, DOI:
10.1126/science.abb3221.
Mizumoto, K., K. Kagaya, and G. Chowell (2020). Early Epidemiological Assessment of the Transmission
Potential and Virulence of Coronavirus Disease 2019 (COVID-19) in Wuhan City: China, January-Febru-
ary, 2020, Working Paper.
Piguillem F. and L. Shi (2020). The Optimal COVID-19 Quarantine and Testing Policies. EIEF Working
Paper 20/04. March 2020
Ritschl, A. (2020). Visualizing Covid-19. Working Paper.
Wasmer E. (2020). The Economics of the Covid-19 Crisis, USC Panel, March 27
13You can also read