The brown bear conservation and management in Slovenia
←
→
Page content transcription
If your browser does not render page correctly, please read the page content below

REPUBLIKA SLOVENIJA
                                     Republic of Slovenia
                      MINISTRSTVO ZA OKOLJE IN PROSTOR
                     Ministry of the Environment and Spatial Planning

                       Dunajska c. 48, P.O.B 653, SI-1001 Ljubljana, Slovenija
                        Tel.: +386 (0)1 47 87 400 • Fax: +386 (0)1 47 87 422

       The brown bear conservation and management in Slovenia
                                       (Long version)

    The brown bear protection on Slovenian territory (particularly in the area of
Visoki Kras) varying in its forms depending on the historical period goes back to the
19th century. The first initiatives for the protection of brown bears came from the
private estates of large landowners mainly for hunting reasons, but nevertheless
expressing their strong tendencies toward hunting having sustainability goals. The
“Ordinance on the Protection of bears in the Kočevje, Črnomelj, Novo mesto, Logatec
and Ljubljana Districts”, dating from 1935, effected a ban on the shooting and killing,
as well as buying and selling of bears, which represented one of the first measures for
the protection and preservation of bears in Europe and the first attempt for
establishing various bear habitat zones on the territory of Slovenia.

    The protection of brown bear in Slovenia has been implemented through hunting
legislation until 2004. Although being a game species until 2004, brown bear has
always had the status of a specially protected species. The granting of permissions for
encroachment upon the brown bear population has always been planned and in line
with a top-down approach (the state – game breeding area – hunting ground),
recognising and taking into consideration the specific ecology of bears.

   In 1966, a Decision defined a special “bear region” in Slovenia, encompassing
most of the central area of the bear’s habitat. This is the core zone where brown bear
habitat is preserved.

    In 1993 brown bear was protected according to the nature conservation legislation
and the decisions about population regulation where brought in accordance between
both of the competent ministries (Ministry of Agriculture, Forest and Food for game
species and Ministry of the Environment and Spatial Planning for protected species).
In 2004 a new act on protected species was adopted (Decree on protected wild animal
species), transposing the Habitat Directive. Since then the brown bear is a protected
species, only. From 2005 the competencies for brown bear management are within the
Ministry of the Environment and Spatial Planning.

    Regarding the strategic approach, the “Brown Bear Management Strategy in
Slovenia” was adopted in 2002 by the Government. This is a strategy for the
management of free-ranging species, based on scientifically founded ecological
principles and involving considered and mutually complementary legal and
administrative measures in the fields of culture, sociology and the economy with the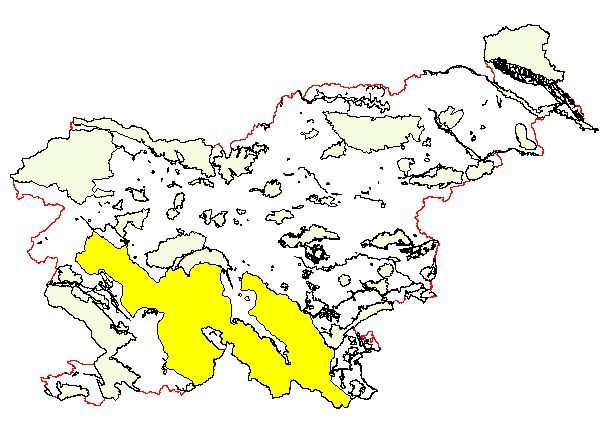
intention of preserving the bear and its natural habitat. It allows animals to live in the
way that nature intended, ensuring a sustainable use that man can expect from this
part of living nature, whilst also facilitating the bear’s coexistence with man. For the
strategy to succeed, measures based on it must be adapted to the ecological
characteristics of the environment and the historical socio-economic conditions in
Slovenia. The purpose of the management of the brown bear population in Slovenia is
to determine the aims and goals as well as the measures for the protection of this
species and its habitat, as well as measures facilitating the coexistence of man and
bear.
The Brown Bear Management Strategy in Slovenia is based on two principles:
Brown bear – a living being and biological species
The bear, like other free-living plant and animal species on the territory of
Slovenia has, for ecological and ethical reasons, a right to exist.
Large carnivores, of which the bear is one, are an important part of biotic
diversity – in their own right and because of the role they play at the top of the
food chain.
Relation between brown bear and man
The brown bear is an animal species that needs a large habitat and lives in areas
also populated by people. There is almost no place where man is not present.
The bears’ prey can include domestic animals and, potentially, bears can be
dangerous to man. The protection and preservation of bears is therefore possible
alongside coexistence with man and with the provision of measures enabling
this.
On the basis of these principles, two, equally important goals of the strategy were set:
o the long-term preservation of the brown bear species in Slovenia, including its
habitat and
o ensuring the coexistence of man and bear.
In the Strategy, the territory of Slovenia is divided into 4 basic “bear” areas:
• a central area (350.000 ha – 17,3 % of national territory);
• a marginal area (257.000 ha – 12,7 %);
• a transit (corridor) area (312.000 ha – 15,3 %);
• an area of exceptional bear presence (1,109.000 ha – 54,7 %)
So, almost half (45,3 %) of the national territory has some measures regarding brown
bear management.
2Brown bear management zones according to the
Brown bear strategy and Action plan
1a – core area, lower human presence
1b – core area, higher human presence
2 – border area
3 – corridor (transitional) area
4 – exceptional bear presence
Each of these area has different measures regarding both goals of the strategy.
These regimes are reflected through both, the protection and regulation of the
population, as well as measures for adaptation of human behaviour and activities
(local population, farming, forestry, tourism, infrastructure, etc.) in order to enhance
coexistence with bears. Presently, the greatest difficulty Slovenia has is setting up the
regimes for bear population management in the transit area, where we face on the one
hand the clearly expressed expectations of the international public, particularly in
neighbouring countries, and on the other the increasing number of conflicts between
man and bears. The main reason is, that this area is now more populated and the
habitat is not so suitable for the brown bear. Brown bears are using this corridor rather
frequently, but it is not realistic to restore the habitat in this area and establish
ecological conditions for permanent presence of the brown bear in order to restore the
Dinaric – Alpine corridor. We encourage in this case the restoration of a functional
corridor, bridging this gap with translocations in case that Alpine countries would like
to increase the numbers of their brown bear populations.
Within the strategy frame some measures are targeted to preserve the habitat of
the species. We believe that this is the most essential conservation measure. If you
lose proper habitat, all other measures are questionable. Because in Slovenia we
succeeded to manage a proper habitat we have a continuity with the brown bear
population until today. Thus the vital areas of the brown bear habitat are included into
the Natura 2000/Emerald network (2380 km2 – 12 % of the national territory). The
second pillar are measures corresponding to the species level (strict protection of the
species). The third pillar are measures to enhance coexistence (conflict and damage
prevention measures, intervention group, compensation system…). The Strategy is
taking into account the provisions of the Bern Convention with its Action plan for the
brown bear population in Europe and the Habitat Directive.
3Natura 2000/Emerald for large carnivores
In 2002, an action plan based on the Strategy was created for the Slovenian bear
population. The action plan took into consideration and included all those points
contained in the European action plan referring to Slovenia. In the same year a
workshop for the Dinaric and Pindos area on the implementation of the action plan
points for individual countries, organised by LCIE (Large Carnivore Initiative for
Europe), was held in the Risnjak National Park in Croatia. The workshop was
intended for representatives of the countries from Slovenia to Greece, which is from
the unified ecological habitat of the so-called Alps-Dinaric-Pindos brown bear
population. Slovenia presented its brown bear management strategy to nine countries
participating at the workshop and was the only country there to have a strategy that is
fully set up and officially accepted at state level. During the review of the individual
points of the European action plan for individual countries, it was established that,
with the exception of three points, Slovenia is fulfilling the action plan.
Slovenia is also paying attention to international and especially cross-border co-
operation as the following activities show:
¾ Bern Convention
– implementation of the Action plan
– Osilnica workshop on transboundary brown bear management
¾ Repopulation projects
– Italy (1999-2002 – 10 bears to NP Adamello Brenta)
– Austria (1993 – 3 bears)
– France (1996-97 – 3 bears, 2006 – 5 bears)
¾ LIFE projects
– Conservation of Large Carnivores in Slovenia – Phase 1: Ursus arctos
4–Principles for the potential formation of a bear metapopulation in the
Alps (with IT and AT)
¾ Cross-boundary co-operation with Croatia, Italy and Austria
The management of the brown bear population in Slovenia is based on an
integrated approach and it is part of the integrated planning system. Following the
strategic goals there are different measures in each of the brown bear zones, aiming to
regulate the population and to minimise the number of conflicts with men.
The principles of encroachment upon the bear population are a part of this
management. It is probably hard for other parts of Europe to imagine that with the
present number of bears in Slovenia there is simply no other alternative but to carry
out regular culls. With this in mind Slovenia, in line with the provision in paragraph 1
of Article 22 and in relation to Article 6 of the Bern Convention, negotiated a
reservation to Appendix II for the brown bear (as well as for the wolf).
Slovenia’s accession to the EU in 2004 and implementation of Council Directive
92/43/EEC on the conservation of natural habitats and of wild fauna and flora also did
not cause major changes in the sustainable management of brown bear, since the
principles of the Habitat Directive were already embraced in Slovenia’s basic
documents and legal acts. We would like to stress here that, despite strict protection,
the Habitat Directive does allow exceptions and interventions in populations of
threatened animal species (including brown bear).
Encroachments upon the brown bear population are carried out on the basis of
technical proposal submitted to a special commission within the Ministry of the
Environment and Spatial Planning responsible for brown bear populations. The
proposal is prepared by the expert services of the Slovenia Forest Service which is,
pursuant to the Decree on protected wild animal species, responsible for integral
planning (encroachments upon the population of free-ranging animal species and their
habitat). The commission consists of independent experts (from the Department of
Forestry, the Department of Biology and the Zootechnical Department at the
Biotechnical Faculty of the University of Ljubljana, from the Natural History
Museum and from the Slovenia Forest Service, representatives of various interested
parties (hunters, NGOs, livestock breeders and local communities) and state officials
(the Ministry of Agriculture, Forestry and Food and the Ministry of the Environment,
Spatial Planning and Energy). The commission is an advisory body to the responsible
minister, that is the Minister of the Environment and Spatial Planning. The minister
decides on encroachments upon the bear population (as well as other large
carnivores), and mainly relies on the commission for this, even though he has a
discretionary right to decide independently. The Department for Wildlife of the
Slovenia Forest Service draws proposal for the encroachment at the end of each
calendar year for the following year. Proposals for the necessary cull of brown bears
are based on the Brown Bear Management Strategy and results of the integral
monitoring.
Each proposal takes in consideration all available data, technical methods and is
harmonised with the responsible bodies in game breeding areas, which are the wider,
5ecologically rounded units for game management in Slovenia. It is agreed with those
carrying out the encroachments on the basis of the following parameters:
the previous trend of the brown bear mortality in the wild (harvested, captured
and lost) and the mortality analysis for the last year,
trend and analysis of the damages to crops, livestock, buildings, vehicles and
elsewhere found to be caused by brown bear,
trend of the conflict situations involving bears, as recorded by the Intervention
group for problems involving brown bears (over 200 calls for intervention in
2006),
data derived from the brown-bear monitoring (regular and other counts)
conducted by the Slovenian Forest Service and the Hunters Association of
Slovenia in 2000, 2001, 2002, 2003, 2004, 2005 and 2006 with an emphasis on
the monitoring performed at the permanent monitoring places,
daily monitoring of brown bear in the special-purpose hunting-districts Jelen
("Deer") and Medved ("Bear"),
theoretical fundamentals and practical experience gathered by animal experts
working within the scope of the activities of the Slovenia Forest Service
Based on integral monitoring the culling quota in the technical proposal (and
later in the Ministerial decision) is structured by sex, weight and spatially. That means
that the quota is divided among individual hunting grounds, taking into consideration
the criterion that those hunting grounds and areas where conflicts between man and
bear have occurred have the priority. The joint quota of bears to be culled is divided
according to weight categories (up to 100 kilograms, 100 – 150 kg, over 150 kg), with
most of the planned cull being in the first weight category, involving young, immature
animals, most often involved in conflict situations. The cull is monitored, and any
violations are controlled and dealt with by the hunting inspectors with the help of the
courts.
The planned cull includes not only bears that are to be shot – proven losses in
the bear population are also subtracted from the quota, influencing the realisation of
the Ministerial decision. This ensures that the population dynamics is controlled, as
the planning of shooting alone could lead to an uncontrolled number of accidental
losses, the occurrence of which seems to have grown in recent years.
Problems connected with the coexistence of man and bear in Slovenia have
started to increase particularly over the last decade and have escalated in the last four
to five years. There are a number of reasons for this, which cannot be completely
explained, as experts have different opinions on the reasons or their relative
importance. It is unarguable that the Slovene bear population is progressively
increasing and is spreading their range. These two reasons have led to difficulties.
Today, the number of bears in Slovenia exceeds the sustainable capacity of their
environment and problems involving bears have turned the image of the species into a
negative one. Slovenian government is trying to avoid that because it could have a
very negative impact on the brown bear population, ultimately resulting in the illegal,
uncontrolled hunting and killing of brown bears.
How do we ascertain the number of bears
6The absolute number is not the only important factor; more significant is the
population trend that is, as already mentioned, a progressive one. The absolute
number is used only when it is necessary to decide in what way and how much to
encroach upon the population by culling, starting from the assessed number of bears,
which again differs depending on the point of view. Whether the number of bears can
be simulated with various models or whether it is easier to assess it on the basis of
“hard” facts derived from the actual monitoring of the population, is left to individual
judgement. The actual monitoring of the bear population in Slovenia means that the
number of bears is ascertained by direct counts in relatively permanent places (bear
meat feeding stations, corn feeding stations for wild boar, and other counting places)
and by daily monitoring indices in the Slovenia Forest Service professional game
breeding areas in the central bear zone, encompassing an area of over 70,000 ha. All
hunting organisations in whose hunting grounds bears are permanently present
participate in this, counting bears on the same day (on a moonlit night), two to three
times a year. After the count, the collected forms are analysed and any sightings
judged on the basis of the time they were recorded to be duplicated, are excluded. Dr
Miha Adamič from Biotechnical faculty, together with the Hunters Association of
Slovenia, developed this method few years ago. With this method, it is possible to
follow the population trend, as well as determining the social structure of the
population, that is the proportion of bears sighted involving female bears with cubs.
We maintain that on the counting nights, when there are also optimum weather
conditions, it is possible to sight and count at the feeding stations up to 70 % of the
bear population. After the count, hunting organisations fill another part of the form,
where they estimate the number of bears more or less constantly present in their
hunting grounds, which were not spotted during the count. And this produces the
difference between the numbers recorded (the number of animals actually counted –
the assessed number).
Based on the Project Life Natura III and European commission requirements the net
of permanent counting spots (167) was formed. The counting at this spots is
obligatory and the results obtained are processed and kept separately. The counting
spots are located two kilometres from the nearest settlement and three kilometres from
each other. The net of permanent counting spots was formed for the purpose of long
term population’s parameters trend assessment.
The estimations of the population are based on integral monitoring which consists of:
• Regular counting on 176 permanent spots 2-3 times a year on the same
moonlit night
• Other counting spots
• Observations
• Registering contacts and intervention calls
• Captures and losses
• Telemetry
• Genetic research
The results of the counts on the permanent counting spots:
710.10.2003 28.5.2005 24.9.2004 22.10.2005 20.5.2005 19.8.2005 14.10.2005 12.5.2006 4.8.2006 6.10.2006 TOTAL
sk. % sk. % sk. % sk. % sk. % sk. % sk. % sk. % sk. % sk. % sk. %
No. of bears seen 94 100 144 100 137 100 135 100 190 100 238 100 186 100 163 100 118 100 158 100 156 100
No. of females with cubs 16 17 26 18 25 18 26 19 36 19 51 21 36 19 32 20 19 16 33 21 30 19
No. of females with cubs 0+ 12 13 11 8 18 13 20 15 16 8 37 16 29 16 12 7 13 11 21 13 19 12
No. of females with cubs 1+ 5 5 16 11 8 6 7 5 20 11 14 6 9 5 20 12 6 5 12 8 12 7
No. of cubs 0+ with female 23 24 21 15 28 20 34 25 29 15 66 28 54 29 22 13 23 19 39 25 34 21
No. of cubs 1+ with female 6 6 21 15 13 9 10 7 30 16 25 11 14 8 35 21 11 9 22 14 19 12
No. of cubs 0+ 24 26 21 15 28 20 35 26 29 15 67 28 54 29 22 13 23 19 39 25 34 22
No. of cubs 1+ 9 10 29 20 13 9 12 9 34 18 33 14 17 9 40 25 19 16 27 17 23 15
No. of all cubs 33 35 50 35 41 30 47 35 63 33 100 42 71 38 62 38 42 36 66 42 58 36
Av. No. of cubs 0+ per female 2,00 1,91 1,56 1,75 1,81 1,81 1,86 1,83 1,77 1,86 1,82 0
Brown bear population structure based on the data gained by counting at
permanent counting spots in autumn for the period 2003 - 2006
14%
6% No. of females with cubs 0+
43% No. of females with cubs 1+
No. of cubs 0+
No. of cubs 1+
Other bears
25%
12%
Brown bear population structure based on the data gained by counting at
permanent counting spots in spring for the period 2003 - 2006
8%
11% No. of females with cubs 0+
46% No. of females with cubs 1+
No. of cubs 0+
14% No. of cubs 1+
Other bears
21%
8The results of the counts on all counting spots:
Beside the counting at the permanent counting spots the counting also takes place at
other counting spots (feeding stations, places of regular bear sightings,…) which are
defined and agreed on by Slovenia Forest Service, Hunters Association of Slovenia
and Regional Association of Hunting Grounds an Special Purpose Hunting Grounds
Managers. Their number varies and also depends on the effort and interest of hunting
grounds managers to gain additional data.
The results of the counts over the last six years are shown in the following
table:
Year and No. of counting Counted in Females Cubs in their 1st and Cubs per
counting No. spots total 2nd year female
2000 – 1 206 228 51 87 1.71
2000 – 2 278 326 67 156 2.33
2000 – 3 315 432 84 156 1.86
2001 – 1 293 212 41 76 1.85
2001 – 2 290 285 57 103 1.81
2001 – 3 321 279 53 104 1.96
2002 – 1 349 344 57 105 1.84
2002 – 2 372 468 100 186 1.86
2003 – 1 378 291 52 93 1,79
2003 – 2 366 224 40 68 1,70
2004 – 1 342 271 45 88 1,96
2004 – 2 391 233 42 74 1,76
2004 – 3 394 233 45 85 1,89
2005 – 1 337 407 73 140 1,92
2005 – 2 305 434 89 176 1,98
2005 – 3 351 378 69 139 2,01
2006 – 1 283 329 65 125 1,92
2006 – 2 284 265 46 94 2,04
2006 – 3 292 312 64 120 1,88
Counted on permanent
counting spots
Average number of brown bears counted at a counting
spot for the period 2000 - 2006 Counted on all
counting spots
1,6
1,4
1,2
No. 1
0,8
0,6
0,4
0,2
0
Count 2000- 2000- 2000- 2001- 2001- 2001- 2002- 2002- 2003- 2003- 2004- 2004- 2004- 2005- 2005- 2005- 2006- 2006- 2006-
1 2 3 1 2 3 1 2 1 2 1 2 3 1 2 3 1 2 3
Comparing all the counts, the most interesting is the number in the last column
– the number of cubs per female (in their 1st and 2nd year) – which is very stable, most
often around 1.8 to 2 cubs per female, the lowest number – only 1.71 – occurring in
9April 2000, and the highest – 2.33 – in May 2000. The number of bears counted (since
2000) was highest in the last counts, as was the assessed number of bears, which
additionally confirms the thesis about the progressive growth of the population. We
estimate, that the annual increment of bears (newly born) in Slovenia is between 100
and 150. It should be mentioned here that we estimate the survival level of cubs to be
very high, the main reason being the sufficiency of both natural food and food offered
to bears by man (at feeding stations, etc.).
Brown bear population structure based on the data gained by counting at
permanent and other counting spots in year 2006
12%
No. of females with cubs 0+
7%
44% No. of females with cubs 1+
No. of cubs 0+
No. of cubs 1+
21% Other bears
16%
Cases of damage involving bears:
The assessment of the present state of affairs, based on the data collected so far
(13-year analysis), regarding damage incurred by bears (in line with the methodology
of compensation payments) and the analysis for 2006 shows the following:
Year Number of damage cases Damages paid out in SIT
1994 7 837,000.00
1995 57 2,826,562.00
1996 45 6,139,890.00
1997 81 9,724,539.00
1998 105 28,913,215.00
1999 138 23,921,963.00
2000 139 12,614,238.00
2001 123 10,601,558.00
2002 503 31.483.145,00
2003 239 15.557.848,00
2004 466 29.746.252,00
2005 814 47.329.139,00
2006*** 678 37.851.519,00
***All the damages in 2006 are not yet estimated and resolved (lawsuits,…)
1 EUR = 239,640 SIT
10900 250000
800
200000
700
600
150000
500
400 100000
300
50000
200
100
0
0
94
95
96
97
98
99
00
01
02
03
04
05
06
1994 1995 1996 1997 1998 1999 2000 2001 2002 2003 2004 2005 2006
19
19
19
19
19
19
20
20
20
20
20
20
20
Number of cases Payed compensation
The data shows that, prior to 2002, the number of damage cases settled around
just over a hundred a year. The nominal value of compensations kept increasing,
slowly at first, whereas in 1998 and 1999 it went up dramatically. But the amount
declined after 1998. In 2002, the number of cases shot up. It is highest in the Kočevje
and Notranjska areas and in the wider Alpine and sub-Alpine region (see map). In the
former, this is the result of the higher number of bears; whilst in the latter the main
cause is the utilisation of the land (free pasture in the mountains), as the number of
bears here, compared to the central area, is considerably lower, but nevertheless on
the increase.
Legend:
dots – recorded cases where damage occurred
11triangles – exceptional cull (interventions)
Bears culled so far:
An overview of bears culled in last 13 hunting years (i.e. from 1st April to 31st
March) during the period between 1994 and 2000 and the cull in the 2001 to 2006
calendar years, according to gender and weight:
No. of bears
culled BY SEX BY WEIGHT
throughout male female unknown. up to 100 101-150 kg over 150 unknown TOTAL
Slovenia kg kg
Hunt. year 94/95 19 20 2 23 11 6 1 41
Hunt. year 95/96 23 8 1 16 9 6 1 32
Hunt. year 96/97 29 17 1 28 16 3 - 47
Hunt. year 97/98 29 20 - 32 13 4 - 49
Hunt. year 98/99 37 21 4 29 20 9 4 62
Hunt. year 99/00 33 23 - 40 5 11 - 56
Hunt. year 00/01 38 21 - 37 19 3 - 59
Cal. year 2001* 34 20 2 33 16 5 1 55
Cal. year 2002 73 42 1 86 20 9 1 116
Cal. year 2003 45 26 1 53 13 6 - 72
Cal. year 2004 49 29 2 52 17 9 2 80
Cal. year 2005 50 45 - 69 22 4 - 95
Cal. year 2006 64 59 2 81 31 13 - 125
Total 94/2006 504 334 14 558 200 86 8 852
Ratio (%) 59 39 2 65 23 10 2 100
Structure of losses in 2006:
¾ Culling:
– regular culling according to the Minister’s Ordinance (76 bears, 61 %)
– interventions (part of the quota), special permit required (18 bears, 14 %)
¾ Translocations - part of the quota (5 bears, 4 %)
¾ Train and car accidents (26 bears, 21 %)
During the whole previous year, 104 bears were harvested / lost in the core
area, 19 in the marginal area, none in the transit (corridor) area and 2 in the region of
exceptional presence of bears. A large number of bears were harvested in the northern
part of the core area, where also the number of damage cases was highest, as well as
in those parts of the core region in which the human population density is the highest.
The majority of the encroachment (61%) was carried out by so called “regular
cull” by the hunting organizations in accordance with population regulation, followed
by 21% of loses (natural deaths, traffic accidents – roads, railways,…), 14% of
“exceptional cull” (serious threats to humans and their property) and 4% of live
capture and relocation (transfer of 5 bears to France).
12The share of losses is markedly high in recent years – it amounts to more than
20% of the total mortality number. In 2006, there were 20 losses due to traffic; in
addition to these, there were 13 traffic accidents involving bears that were not found
afterwards. During the last 7 years, 107 bears died in collisions with vehicles: 11 on
highways, 49 on local roads, and 47 on railways.
Among the bears harvested/lost in 2006, there is a strong preponderance of
those with a body weight of less than 100 kg (in 64,8 % cases of all known bear
deaths), while the bears weighing 101 to 150 kg accounted for 24,8 % of bear deaths,
and those weighing above 150 kg for 10,4 %. These percentages are quite close to the
orientation levels defined in the Strategy.
In 2006, among the 125 bears harvested, relocated or lost, 21 of them were
females of the age of reproductive maturity (of those 21 four females were captured
and transferred to France). 63 % of the bears harvested or lost were not sexually
mature yet (cubs of the year, yearlings, bears aged two or three years), which is less
than previous year (78%) These data show that special attention must be paid to the
structure of future encroachments upon the population.
The work of the brown bear intervention group
The intervention group for problems involving brown bears was founded on the basis
of Government resolutions and Decision No. 017 – 62/00, dated 5. 4. 2000, adopted
by the Ministry of Agriculture, Forestry and Food. The group acts on the basis of a
written operative agreement with the police and on the basis of the resolution adopted
by the director of the Slovenia Forest Service No. 16/00, dated 30.5.2000. In cases of
a conflict with bears, the group answers calls to the intervention numbers 112 and 113
– the operative communication centre and the police. In line with its legal and
professional responsibilities, the methods for solving problems with bears used by the
intervention group are the capture of bears, scaring bears with different technical
devices and rubber missiles or killing them with fire arms.
The following can be established from the analysis of the encroachments upon
brown bear population:
It is estimated that for a number of years, if not a whole decade, fewer bears
have been killed than born; bears are more common in areas where they were
once rare, and the population density in the core presence area has increased.
The cull predominantly involves bears weighing up to 100 kg (64% of all the
proven cull), however, the share of the culled bears weighing between 101 and
150 kg and above 150 kg is relatively high (33% of the total). With respect to
the correlation between weight and age, it is estimated that the natural age
composition of the population is altered and leaning towards younger and
middle aged immature bears, which are also the ones involved in conflict
situations within their environments.
According to the gender structure in the period of five years, it was males that
predominated in the cull in comparison with females (59:39%), while 2% of
bears were of unknown gender. The natural gender structure of the population
13is thus likely to be considerably altered, which is the result of the internal
documents adopted by the Hunters Association of Slovenia, protecting females
with young.
On the basis of the above the following conclusions can be made:
¾ The brown bear population in Slovenia is in a “favourable position” (stable) and
not threatened either in the short or long-term. The population size is increasing
and the area where bears can be found is widening;
¾ Special emphasis is given to habitat conservation and preventive measures, as
culling is the last option in the population control;
¾ In management process other management measures should be foreseen to
control the population, meeting the needs and concerns of local population
(higher acceptance). It is our firm belief that confidence and conviction of local
population that the situation is controlled (including transparent, operational and
quick compensation system, effective intervention group, encouraging
preventive measures, public relation activities…) is minimizing poaching and
assuring high law implementation. In Slovenia, hunting is certainly not the
driver of the political tendency (management outcomes are much higher of
incomes, no private hunting grounds and thus private interest, non-reproductive
part prevails in the culling quota, strict control). Conflicts between bears and
people are the most important driving force for political pressure regarding
higher quotas;
¾ In particular cases of conflicts in rural areas some bears were truncated and
translocated to remote areas. But as in Slovenia distances are relatively small
and an average daily range of a brown bear is up to 80 km, they returned to the
same place in a few days which indicates that this measure is quite ineffective.
We are highly interested to translocate these bears to any of the countries
concerned about the faith of population of the brown bear in Slovenia;
¾ Culling is one of the regulation methods, transparent and strictly regulated;
¾ Culling quota is based on the results of integrated monitoring and structured
regarding space, sex and weight;
¾ With different structure of the culling (to have more impact in the reproductive
part of the populations - to cull more reproductive females) we could lower
quota fundamentally, but we don’t see this acceptable from the technical and
point of view, regardless that lower culling numbers would be much more
appreciated in the public;
¾ Integrated monitoring system is well developed, there are divergences in
interpretation of the results;
¾ All losses in population (culling, illegal hunting, car and road accidents…) are
recorded in a standard way (sex, weight, place of death, reason…) and
available;
¾ The positive trend in brown bear population, increase in damage, contacts and
conflicts with human, spreading of bears presence outside the area of usual
range led to more radical population control. The results in the population are
carefully monitored and will be bases for further decisions;
¾ The number of bears in the total culling quota actually shot is falling, while the
number of animals exceptionally culled in conflict situations and the number of
bears lost, particularly in road and rail accidents, is growing;
14¾ Instances of damage incurred by bears and the number of conflicts with man are
increasing, causing the image of this species to be perceived in a progressively
negative way. In the last five years, several serious incidents involving a bear’s
attack on a person resulting in serious injures have been recorded. As a
consequence of this, there is the strong possibility of unlicensed hunting of
bears - that is completely uncontrolled encroachments upon the brown bear
population;
¾ The species is above the sustainability threshold for its environment and the
areas in which bears appear in Slovenia could not sustain a larger population.
Implementing the Brown bear Strategy we are taking into account the integrity
of the measures aimed at solving the problems, which does not involve just the culling
of bears, but also the implementation of a whole range of measures in the brown bear
habitat (habitat improvement, prevention relating to the breeding of small livestock,
illegal refuse dumps, intervention group, public relation activities, feeding, etc.)
aiming to minimize conflicts and damages with local inhabitants.
In its management of the brown bear, Slovenia is respecting international
regulations, including all the documents and plans at international level. We are open
for all scientific based suggestions and invite co-operation. We believe that countries
where the large carnivores were exterminated can learn and better understand the
problems of coexistence of men and large carnivores and share knowledge and
responsibilities in conserving these key species of European importance.
Ljubljana, April 2007
15You can also read


