Tonsley Urban Renewal Project - Assessment of retail development potential DRAFT - Renewal SA
←
→
Page content transcription
If your browser does not render page correctly, please read the page content below
Tonsley Urban Renewal Project
Assessment of retail development potential

                           September 2016

                                     DRAFT
MacroPlan Dimasi

MELBOURNE                                  SYDNEY
Level 16                                   Level 6
330 Collins Street                         39 Martin Place
Melbourne VIC 3000                         Sydney NSW 2000
(03) 9600 0500                             (02) 9221 5211
BRISBANE                                   GOLD COAST
Level 15                                   Level 2
111 Eagle Street                           89 -91 Surf Parade
Brisbane QLD 4000                          Broadbeach QLD 4218
(07) 3221 8166                             (07) 3221 8166
ADELAIDE                                   PERTH
Ground Floor                               Level 1
89 King William Street                     89 St Georges Terrace
Adelaide SA 5000                           Perth WA 6000
(08) 8221 6332                             (08) 9225 7200

Prepared for: Renewal SA

MacroPlan Dimasi staff responsible for this report:

Tony Dimasi, Managing Director – Retail
Ziggy Gelman, Consultant – Retail
Table of contents

Executive summary                                               i

Introduction                                                   iv

Section 1:     Site location and context                        1

      1.1    Site location                                      1

      1.2    Tonsley masterplan                                 4

      1.3    Surrounding urban context                          7

Section 2:     Trade area analysis                              9

      2.1    Trade area definition                              9

      2.2    Resident trade area                               10

      2.3    Resident trade area population                    13

      2.4    Socio-demographic profile                         15

      2.5    Resident trade area retail expenditure capacity   18

      2.6    On-site workforce and student numbers             22

Section 3:     Competition                                     23

Section 4:     Comparable projects                             25

Section 5:     Section title                                   32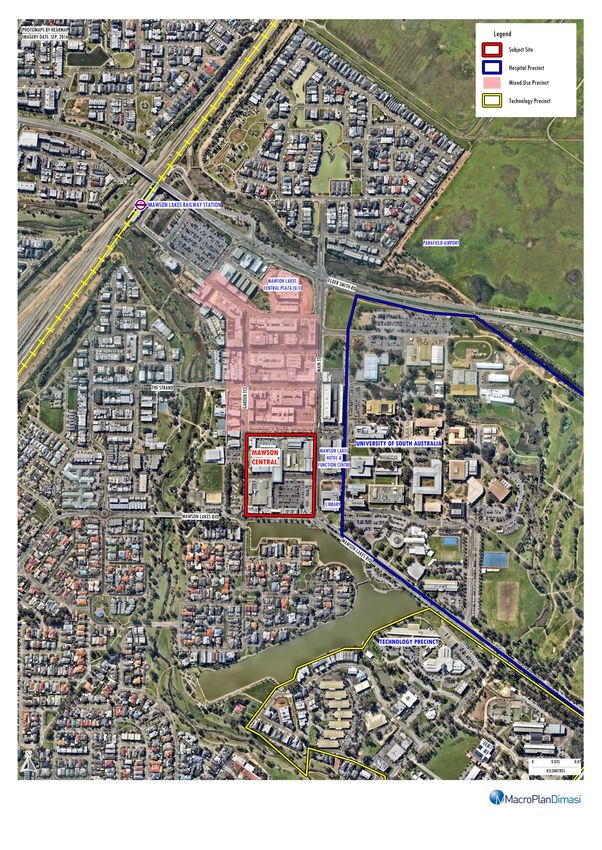
Executive summary
The Tonsley urban renewal project is the South Australian Government’s initiative to
redevelop a 61-hectare site, formerly occupied by Mitsubishi Motors as a manufacturing
plant, located at Clovelly Park in southern Adelaide. The redevelopment is both a major
economic initiative as well as a significant urban renewal project.
The Tonsley masterplan sets a vision for a sustainable development to be built around
innovation, research and high value manufacturing. Implementation of the masterplan
will deliver an integrated mixed-use employment precinct, which will contain commercial,
residential, education and retail elements.
A key objective for Tonsley is that it becomes a magnet for smart, innovative businesses,
able to take advantage of the mix of cutting edge innovation and smart manufacturing
uses planned to be provided on-site, as well as education, residential and supporting
retail uses.
The main retail component will be accommodated on the currently vacant carpark area
situated to the immediate west of the MAB. At its northern edge the site will front the
extension of Alawoona Avenue into the Tonsley site, which in turn provides direct
accessibility to the adjoining suburb of Mitchell Park to the west. In addition, a planned
north-south road will run adjacent to the site’s western boundary, in due course
providing access and linkages to the suburb of Clovelly Park to the immediate north of
Tonsley.
The retail facilities at Tonsley will be able to serve an available resident trade area, having
regard to the site on which the Tonsley retail centre will be accommodated, and the
surrounding urban area, including the locations of existing retail facilities in the
surrounding suburbs.
In addition, the retail facilities at Tonsley will also play another important role, namely
servicing the needs of the on-site population, which will include the additional resident
Tonsley Urban Renewal Project
i
Assessment of retail development potential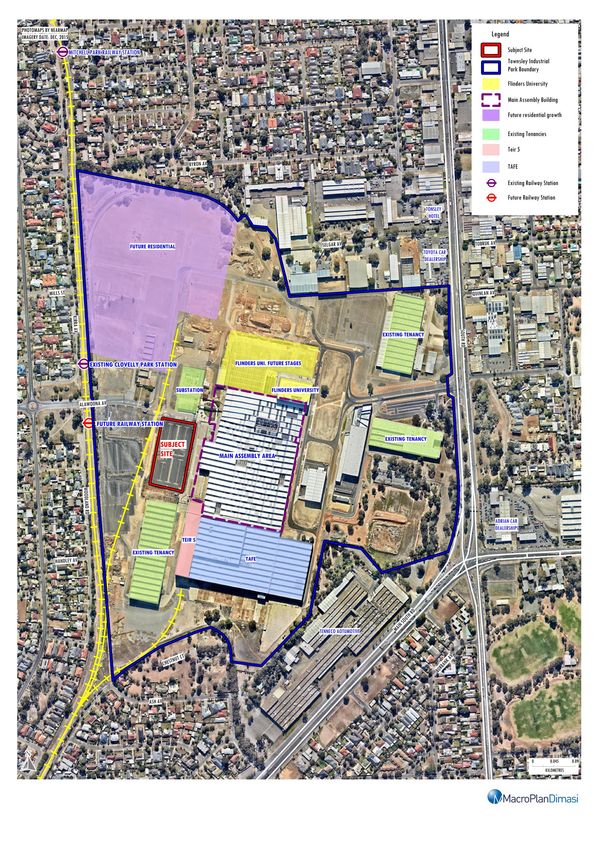
Executive summary
population to be accommodated within the Tonsley masterplan area, as well as the day
time worker, student and visitor populations on the Tonsley site.
There is at present a substantial resident population available to be served by the retail
facilities at Tonsley – over and above the daily on site population. The largest, and by far
most important, resident trade area sector is the primary sector, and that sector
accommodates the bulk of the currently available resident population within the main
trade area, with an estimated 6,400 residents at 2016. This factor alone provides very
substantial market support for delivery of a new retail centre at Tonsley, although
ensuring easy accessibility of the subject site for primary trade area residents will be an
important factor that will contribute to the trading success of that centre.
In addition to the floorspace that will be supportable by the main trade area population,
additional demand will come from the on-site daily population, which includes workers
and students.
The potential for the centre will also be augmented, to a small degree, by additional
business that will be attracted from beyond the main trade area, e.g. from residents of
other, nearby, suburbs and from visitor to Tonsley.
In regards to all the above, our recommendations as to the scale and mix for the retail
facilities at Tonsley are detailed as follows:
- First, we consider that a full scale supermarket, in the order of
3,200 sq.m – 3,500 sq.m, should be the anchor tenant.
- In addition to the supermarket, a limited number of fresh food specialty stores,
including a bakery and potentially a butcher, a seafood operator, and fresh produce
specialist, to supplement the FLG offer.
- We further recommend a provision in the range of 1,200 – 1,500 sq.m of floorspace to
be directed to food catering, comprising take-away foodstores, cafes, and a small
number of casual restaurants.
- While there will be some demand for household goods floorspace, most of that
demand would typically be met, in a centre of this scale and nature, by the
Tonsley Urban Renewal Project
ii
Assessment of retail development potential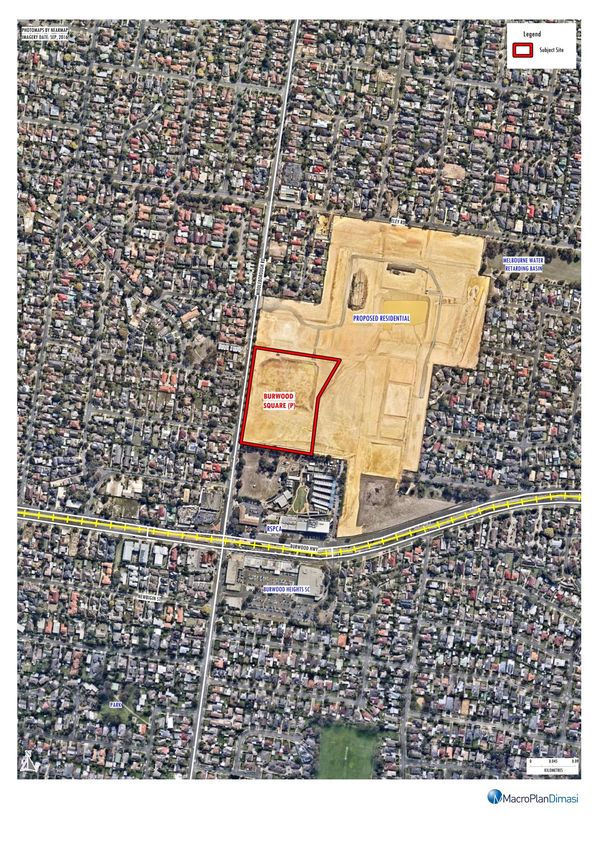
Executive summary
supermarket anchor, through its general merchandise offer including items such as
cutlery and crockery, household linen, and laundry items, etc.
- The Leisure Retail category and the General Retail category can support a number of
tenants such as newsagency, pharmacy and potentially a mobile phone outlet.
- Retail services can include hairdressers, optometrist, repair kiosk (such as Mr Minit),
and drycleaning.
- Finally, in addition to the retail facilities, various non-retail uses can add further to the
total centre floorspace. Such non-retail uses can include fitness centre, medical centre,
real estate agents, travel agencies and potentially one or two banks.
In terms of timing, we consider such a centre will be supportable once the road
infrastructure on-site has been delivered and the on-site residential development is
under way, i.e. within the next few years.
Tonsley Urban Renewal Project
iii
Assessment of retail development potential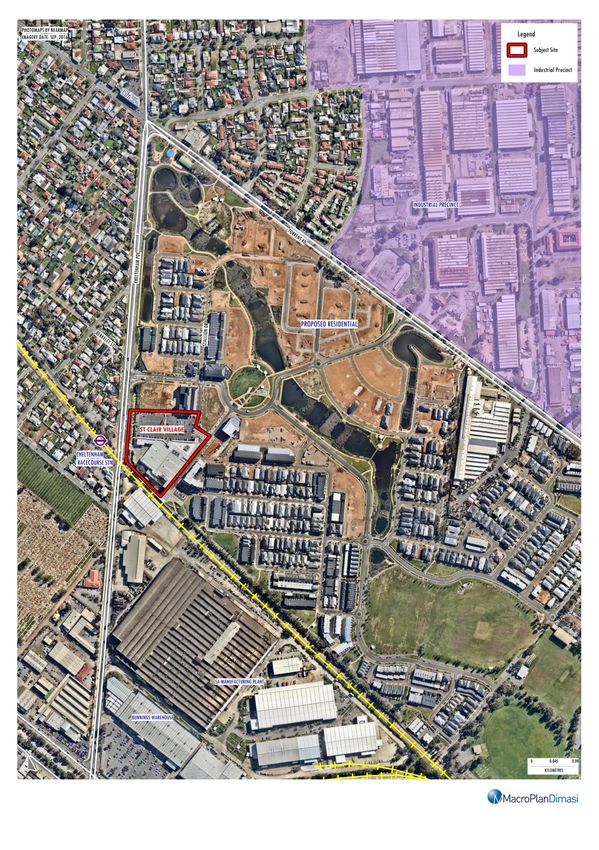
Introduction
The Tonsley urban renewal project is the South Australian Government’s initiative to
redevelop a 61-hectare site, formerly occupied by Mitsubishi Motors as a manufacturing
plant, located at Clovelly Park in southern Adelaide. The redevelopment is both a major
economic initiative as well as a significant urban renewal project.
The Tonsley masterplan sets a vision for a sustainable development to be built around
innovation, research and high value manufacturing. Implementation of the masterplan will
deliver an integrated mixed-use employment precinct, which will contain commercial,
residential, education and retail elements.
This report presents an independent assessment of the potential for retail development as
part of the Tonsley project. The report is structured as follows:
Section 1 details the location of the Tonsley site, and also the surrounding local and
regional contexts. The Tonsley masterplan is also outlined.
Section 2 presents a trade area analysis, first identifying the relevant trade area for
consideration for the retail facilities to be provided at Tonsley, and then providing
estimates of relevant trade area population levels, including residents and workers, as
well as students. The retail expenditure capacities for each of these potential customer
segments are then estimated, and projected for future years, as the Tonsley project is
implemented.
Section 3 describes the competitive environment within which the retail facilities to be
provided at Tonsley will operate. The relevance of that competitive environment, and the
extent to which it impacts on the future potential for retail development at Tonsley, are
then also considered.
Tonsley Urban Renewal Project
iv
Assessment of retail development potential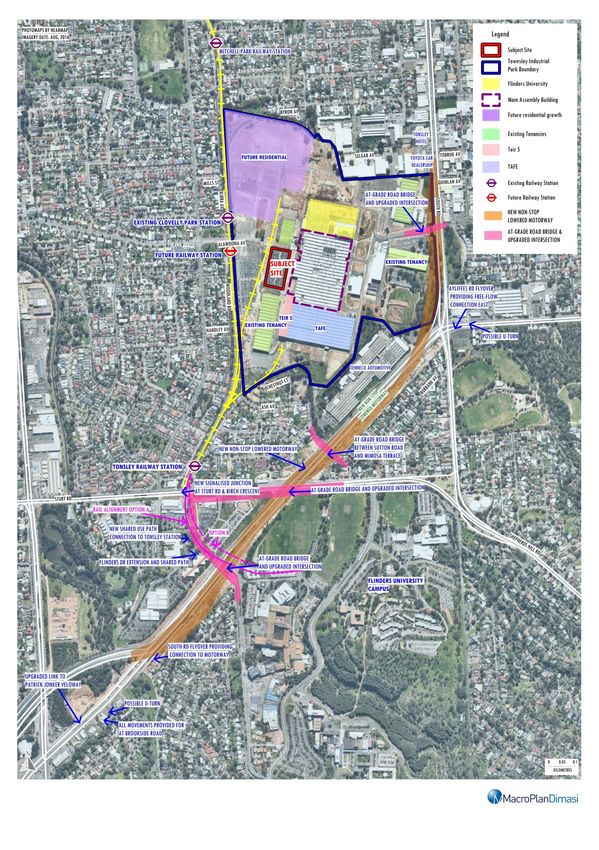
Introduction
Section 4 presents relevant information for a number of comparable projects, from which
learnings can be drawn in regard to the optimal mix of retail facilities to be provided at
Tonsley.
Section 5 sets out our recommendations as to the retail development potential for
Tonsley, having regard to all of the above. The quantum of retail floorspace, as well as its
indicative mix, recommended for Tonsley are detailed, together with estimates of sales
potential and rental potential from that mix of retail uses.
Tonsley Urban Renewal Project
v
Assessment of retail development potential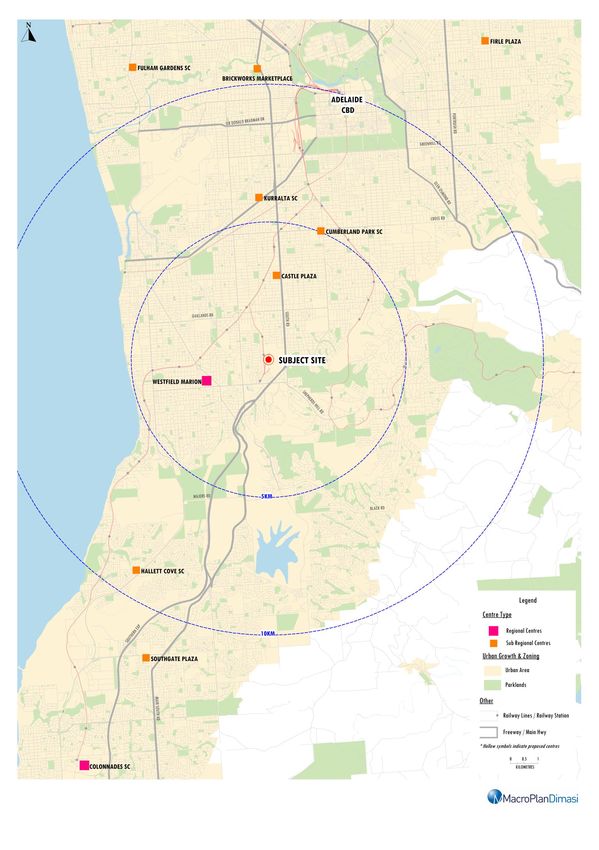
Section 1: Site location and context

1.1   Site location

The Tonsley urban renewal initiative is a partnership between two leading economic
agencies of the Government of South Australia – Renewal SA and the Department of State
Development.

Map 1.1 shows the location of the Tonsley site, and the surrounding regional context,
throughout the southern Adelaide region. Map 1.2 highlights the various elements of the
Tonsley redevelopment site, and the surrounding local context.

Consistent with the Department of State Development’s role in attracting business
investment and supporting employment growth, Tonsley is proposed to be the focal point of
the State Government’s effort to transform South Australia’s manufacturing sector and build
world-class industry capabilities. Consistent with Renewal SA’s charter to develop accessible
and connected places, where people can live, work and play, the Tonsley redevelopment will
deliver a vibrant, sustainable mixed-use precinct.

A key objective for Tonsley is that it becomes a magnet for smart, innovative businesses, able
to take advantage of the mix of cutting edge innovation and smart manufacturing uses
planned to be provided on-site, as well as education, residential and supporting retail uses.

Tonsley’s development as a ‘smart industry’ precinct is underpinned by the direct
participation of TAFE SA and Flinders University, both of which have campus representation
at Tonsley. TAFE SA has established its new Sustainable Industries Education Centre (SIEC),
where more than 6,000 students each year will be trained in sustainable building and
construction occupations. Flinders University has established its School of Computer Science,
Engineering and Mathematics (CSEM) at Tonsley, with a new facility which opened in
February 2015. Flinders University’s main campus is situated approximately 2 km to the
south of Tonsley, and the University is committed to the future development of an
integrated precinct which extends from the University’s main campus to the Tonsley site.

                                                                   Tonsley Urban Renewal Project
                                                                                                        1
                                                           Assessment of retail development potential
Map 1.1: Tonsley
Regional context
Map 1.2: Tonsley redevelopment site
Local context
Section 1: Site location and context
Tonsley is a critical link in the Government of South Australia’s activity to build the state’s
economy. The target sectors for attraction to Tonsley are:
Mining and resources;
Clean technologies and renewable energies;
Health & medical technologies; and
Sustainable construction.
These sectors form the basis of plans to develop Tonsley as a high value manufacturing and
industry hub, supported by education and innovation.
1.2 Tonsley masterplan
The Tonsley masterplan sets a vision for sustainable development built on innovation,
research and high value manufacturing. The centrepiece of the masterplan vision is the
adaptive re-use of the former Main Assembly Building (MAB) of Mitsubishi, as a
demonstration of the sustainability initiatives and collaborative environment.
The attached Figure 1.1 shows the Tonsley masterplan, while Figure 1.2 details the
development status of the various sites which make-up the masterplan, as at May 2016.
The key elements of the completed project are estimated to be as follows:
More than 6,000 high valued jobs to be accommodated on site.
More than 1,200 residents to be accommodated in the new residential precinct which will
occupy the north-western portion of the site, and which will be developed by Peet/CIC.
An estimated 8,500 students on site, in the TAFE SA and Flinders University buildings.
An estimated 110,000 sq.m of commercial land use.
An estimated 130,000 sq.m of high value manufacturing land use.
Approximately 7,500 sq.m of retail floorspace.
These various elements of Tonsley will be developed utilising best practice design and world
leading social, economic and environmental benchmarks. A network of public spaces that
promote health and wellbeing through physical recreation and outdoor living will be an
important element of the project. These public spaces will be linked through walking and
cycling paths for local residents, students and workers.
Tonsley Urban Renewal Project
4
Assessment of retail development potentialFigure 1.1: Tonsley Masterplan
Figure 1.2: Tonsley – Development Status
Section 1: Site location and context

The main retail component will be accommodated on the currently vacant carpark area
situated to the immediate west of the MAB. At its northern edge the site will front the
extension of Alawoona Avenue into the Tonsley site, which in turn provides direct
accessibility to the adjoining suburb of Mitchell Park to the west. In addition, a planned
north-south road will run adjacent to the site’s western boundary, in due course providing
access and linkages to the suburb of Clovelly Park to the immediate north of Tonsley.

1.3   Surrounding urban context

The attached Map 1.3 shows the surrounding urban context for the Tonsley site, highlighting
a number of significant transport infrastructure projects currently underway or planned, and
which have enormous implications for the accessibility and eventual integration of the
Tonsley development.

The most significant of these is the South Road Darlington upgrade, which is a $620 million
infrastructure project by the Government of South Australia to deliver a lowered non-stop
motorway that will pass underneath Flinders Drive, Sturt Road, Mimosa Terrace/Sutton
Road, Ayliffes Road and Tonsley Boulevard. Direct linkages above the lowered freeway will
be provided between the Tonsley site and its surrounding environment at Tonsley Boulevard,
Mimosa Terrace and Flinders Drive.

Construction of the Darlington project is currently well underway, and is expected to be
completed by the end of 2018. Once the project is completed the linkage between the
Flinders University main campus and Tonsley will be greatly improved, as will be the linkage
between the Tonsley site and the various residential areas to the south of the Southern
Express Way, and to the east of South Road.

In addition and as also shown on Map 1.3, the Tonsley railway line is proposed to be
extended from its current terminus at Tonsley station to Flinders University, with an
additional station to be built adjacent to the Flinders Medical Centre. That extension in turn
will also provide a much stronger public transport linkage between the Flinders University
campus and Tonsley.

                                                                   Tonsley Urban Renewal Project
                                                                                                         7
                                                           Assessment of retail development potential
Map 1.3: Tonsley redevelopment site Surrounding urban context
Section 2: Trade area analysis

This section of the report examines the trade area which the proposed retail facilities at
Tonsley will be able to serve, including estimates of population levels and retail expenditure
capacity for those populations.

2.1    Trade area definition

The extent of the trade area or catchment that is served by any shopping centre, or retail
facility, is shaped by the interplay of a number of critical factors. These factors include:

 i.    The relative attraction of the retail facility or centre, in comparison with alternative
       competitive retail facilities. The factors that determine the strength and attraction of
       any particular centre are primarily its scale and composition (in particular the major
       trader or traders that anchor the centre); its layout and ambience; and carparking,
       including access and ease of use.

ii.    The proximity and attractiveness of competitive retail tenants, or centres. The
       locations, compositions, quality and scale of competitive retail facilities all serve to
       define the extent of the trade area which a shopping centre or retail facility is
       effectively able to serve.

iii.   The available road network and public transport infrastructure, which determine the
       ease (or difficulty) with which customers are able to access a shopping centre, or retail
       facility.

iv.    Significant physical barriers which are difficult to negotiate, and can act as delineating
       boundaries to the trade area served by an individual shopping centre, or retail facility.

The retail facilities at Tonsley will be able to serve an available resident trade area, having
regard to the site on which the Tonsley retail centre will be accommodated, and the
surrounding urban area, including the locations of existing retail facilities in the surrounding
suburbs.

                                                                      Tonsley Urban Renewal Project
                                                                                                           9
                                                              Assessment of retail development potential
Section 2: Trade area analysis
In addition, the retail facilities at Tonsley will also play another important role, namely
servicing the needs of the on-site population, which will include the additional resident
population to be accommodated within the Tonsley masterplan area, as well as the day time
worker, student and visitor populations on the Tonsley site.
Each of these customer segments (i.e. resident and works/students) is detailed further
below.
2.2 Resident trade area
Map 2.1 attached shows the resident trade area which has been assessed as being available
to be served by the retail facilities to be provided at Tonsley. This resident trade area
comprises one primary sector and two tertiary sectors – north and south – which have been
defined as follows:
i. The primary sector is bounded by Sturt Road to the south, South Road to the east,
Marion to the west, and Celtic Avenue to the north. It comprises the existing suburb of
Mitchell Park to the immediate west of the Tonsley site as well as the southern portion
of Clovelly Park, i.e. south of Celtic Avenue. The residents of this primary sector would
all be able to access the retail facilities at Tonsley easily and quickly. Furthermore, on
the assumption that a supermarket will be provided at Tonsley (as discussed further
later in this report) that supermarket would be the closest and most conveniently
located for all of these residents. For that combination of reasons, this area logically
represents the primary (resident) trade area for the proposed Tonsley retail centre.
The population within this primary trade area will grow significantly coming years, due
to the residential development that will occur within the Tonsley site, as detailed
further below.
ii. The secondary north sector is defined as the area to the immediate north of the
primary sector and which is bounded by Celtic Avenue in the south, South Road in the
east, Dawes Road in the north, and Marion Road in the west. These residents will be
able to access the retail centre to be built at Tonsley quite easily, primarily, in the short
Tonsley Urban Renewal Project
10
Assessment of retail development potentialSection 2: Trade area analysis
term, via Bradley Grove, and in the longer term via the proposed new north-south road
which will run to the western side of the proposed Tonsley retail centre and link through
directly to the suburb of Clovelly Park.
iii. The secondary south sector includes the Flinders University Campus as well as the
residential population accommodated in the area generally to the south of Sturt Road,
east of Marion Road, west of Bellevue Drive, and north of Bonneyview Road. While the
population of this area is relatively small, for these residents the proposed retail
facilities at Tonsley would be easily accessible, and will also offer the closest and most
conveniently located supermarket. The key for these residents to utilise the retail
facilities at Tonsley will be the greatly improved accessibility to Tonsley which will be
provided by the Mimosa Terrace and Flinders Drive overpasses across the lowered
Southern Freeway.
The primary and secondary trade area sectors in combination form the main trade area to be
served by the proposed retail facilities at Tonsley.
Tonsley Urban Renewal Project
11
Assessment of retail development potentialMap 2.1: Tonsley Resident trade area and competition
Section 2: Trade area analysis

2.3    Resident trade area population

Table 2.1 below shows the current population levels within each of these resident trade area
sectors, as well as the projected populations over the next decade. As previously noted, the
residential development to occur on site at Tonsley will account for the majority of the
projected population growth, expected to add in excess of 1,200 residents to the primary
sector.

                                                        Table 2.1
                                    Tonsley trade area population, 2006-2026*

                                    Estimated population                        Forecast population
  Trade area sector            2006             2011           2016        2018            2021            2026

  Primary                      5,750            6,000         6,400        6,560           7,160          8,160

  Secondary sectors
  • North                      2,820            3,040         3,240        3,280           3,340          3,440
  • South                      1,690            1,670         1,720        1,740           1,770          1,820

  Total secondary              4,510            4,710         4,960        5,020           5,110          5,260

  Main trade area            10,260            10,710        11,360       11,580          12,270         13,420

                                                               Average annual growth (no.)
  Trade area sector                           2006-11       2011-16      2016-18        2018-21        2021-26

  Primary                                         50                80        80             200            200

  Secondary sectors
  • North                                         44                40        20              20             20
  • South                                          -4               10        10              10             10

  Total secondary                                 40                50        30              30             30

  Main trade area                                 90            130          110             230            230

                                                                Average annual growth (%)
  Trade area sector                           2006-11       2011-16      2016-18        2018-21        2021-26

  Primary                                       0.9%           1.3%        1.2%            3.0%            2.6%

  Secondary sectors
  • North                                       1.5%           1.3%        0.6%            0.6%            0.6%
  • South                                      -0.2%           0.6%        0.6%            0.6%            0.6%

  Total secondary                               0.9%           1.0%        0.6%            0.6%            0.6%

  Main trade area                               0.9%           1.2%        1.0%            1.9%            1.8%

  *As at June
  Source: ABS Census 2011; MacroPlan Dimasi

                                                                                   Tonsley Urban Renewal Project
                                                                                                                        13
                                                                         Assessment of retail development potential
Section 2: Trade area analysis
The residential development on the Tonsley site is to be undertaken by Peet SA (formerly
CIC) and, based on current plans which we understand are soon to be submitted for
development approval, will contain a minimum of 775 dwellings.
However, we understand that further densification of the residential precinct is also likely,
particularly in the southern portion of the residential land, opposite the existing train station.
The final number of dwellings to be delivered could therefore be well in excess of 775.
Advice from Peet SA indicates that the company plans to start selling residential lots on site
in early 2017, and to sell in the order of 100 – 120 lots per year, thereby completing the
residential development by approximately 2025.
Over the longer term, additional changes are anticipated within this trade area, and
particularly within the primary sector, as a result of a Development Plan Amendment (DPA)
which is currently in train. This ministerial initiated DPA proposes to support delivery of
zoning improvements to enable integrated land use and transport outcomes from the
government’s investment in the Darlington Upgrade Project, including providing for
increased density around Tonsley and Clovelly Park stations, and amending the existing
policy for residential areas at Tonsley.
As shown in Table 2.1, there is at present a substantial resident population available to be
served by the retail facilities at Tonsley – over and above the daily on site population, which
is considered further below.
The largest, and by far most important, resident trade area sector is the primary sector, and
that sector accommodates the bulk of the currently available resident population within the
main trade area, with an estimated 6,400 residents at 2016. This factor alone provides very
substantial market support for delivery of a new retail centre at Tonsley, although ensuring
easy accessibility of the subject site for primary trade area residents will be an important
factor that will contribute to the trading success of that centre.
Tonsley Urban Renewal Project
14
Assessment of retail development potentialSection 2: Trade area analysis
2.4 Socio-demographic profile
Table 2.2 and Chart 2.1 show the socio-demographic profiles of trade area residents,
comparing the relevant measures with benchmarks for the total Adelaide metropolitan area
and also the national average in each case. The key features of the existing resident
population can be summarised as follows:
Generally, other than for the small residential pocket contained in the secondary south
sector, households within the trade area have well below average income levels.
The trade area population is slightly younger than average compared with the Adelaide
metropolitan population overall.
The level of home ownership throughout the trade area is also below average, with a
higher representation of renters particularly in the primary sector.
Residents of Asian origin account for a noticeably higher proportion of the trade area
population than is the case generally across metropolitan Adelaide.
Traditional family households (i.e. couples with dependent children) account for lower
proportions of households throughout each trade area sector than is the case generally
throughout metropolitan Adelaide or across Australia more broadly. On the other hand,
lone person households account for a higher than average proportion of total trade area
households.
Tonsley Urban Renewal Project
15
Assessment of retail development potentialSection 2: Trade area analysis
Table 2.2
Tonsley main trade area - socio-demographic profile, 2011
Primary Secondary sectors Main Adel Metro Aust.
Census item sector North South TA avg. avg.
Per capita income $26,266 $28,785 $24,914 $26,769 $32,438 $34,467
Var. from Adel Metro benchmark -19.0% -11.3% -23.2% -17.5%
Avg. household income $58,793 $63,142 $90,709 $63,367 $77,851 $88,205
Var. from Adel Metro benchmark -24.5% -18.9% 16.5% -18.6%
Avg. household size 2.2 2.2 3.6 2.4 2.4 2.6
Age distribution (% of population)
Aged 0-14 16.8% 15.1% 9.5% 15.2% 17.7% 19.3%
Aged 15-19 5.9% 4.9% 12.7% 6.7% 6.6% 6.5%
Aged 20-29 17.2% 18.1% 31.8% 19.8% 14.1% 13.8%
Aged 30-39 13.8% 16.5% 16.3% 15.0% 13.1% 13.8%
Aged 40-49 12.9% 11.1% 8.0% 11.6% 14.2% 14.2%
Aged 50-59 11.8% 11.6% 6.5% 10.9% 13.1% 12.8%
Aged 60+ 21.5% 22.7% 15.2% 20.9% 21.3% 19.6%
Average age 38.9 39.7 33.6 38.3 39.1 37.9
Housing status (% of households)
Owner (total) 52.8% 59.0% 62.0% 56.0% 69.7% 68.7%
• Owner (outright) 26.2% 29.6% 29.8% 27.8% 32.3% 32.9%
• Owner (with mortgage) 26.5% 29.3% 32.2% 28.2% 37.4% 35.8%
Renter 45.8% 40.8% 37.3% 43.0% 28.8% 30.4%
Other 1.4% 0.2% 0.7% 1.0% 1.5% 0.9%
Birthplace (% of population)
Australian born 66.9% 67.7% 59.5% 66.0% 73.5% 74.0%
Overseas born 33.1% 32.3% 40.5% 34.0% 26.5% 26.0%
• Asia 15.9% 14.2% 23.8% 16.7% 7.4% 8.6%
• Europe 10.5% 13.5% 8.8% 11.1% 15.2% 10.5%
• Other 6.7% 4.6% 7.9% 6.3% 3.9% 7.0%
Family type (% of households)
Couple with dep't children 37.1% 35.6% 39.8% 36.9% 42.2% 45.3%
Couple with non-dep't child. 5.5% 6.2% 6.1% 5.8% 7.6% 7.7%
Couple without children 21.9% 25.1% 30.4% 23.7% 23.6% 23.0%
One parent with dep't child. 10.7% 8.1% 8.2% 9.6% 9.4% 9.2%
One parent w non-dep't child. 5.0% 5.3% 2.9% 4.9% 3.7% 3.5%
Other family 2.2% 1.5% 1.3% 1.9% 1.2% 1.1%
Lone person 17.7% 18.1% 11.4% 17.2% 12.2% 10.2%
Source: ABS Census of Population & Housing, 2011; MacroPlan Dimasi
Tonsley Urban Renewal Project
16
Assessment of retail development potentialSection 2: Trade area analysis
Chart 2.1
Tonsley main trade area - socio-demographic profile, 2011
Age distribution
25% 21%
20% 21%
19% Tonsley MTA Adel Metro Aust. Avg. 20%
20% 18%
15% 15%
14% 14% 14% 14% 14%
15% 13%
12% 13% 13%
11%
10% 7%
7% 7%
5%
0%
Aged 0-14 Aged 15-19 Aged 20-29 Aged 30-39 Aged 40-49 Aged 50-59 Aged 60+
Income levels
$100,000 $88,205
Tonsley MTA Adel Metro Aust. Avg. $77,851
$80,000
$63,367
$60,000
$34,467
$40,000 $26,769 $32,438
$20,000
$0
Per capita income Avg. household income
74%
Country of birth
80% 73%
66%
Tonsley MTA Adel Metro Aust. Avg.
60%
34%
40%
27% 26%
20%
0%
Australian Born Overseas Born
Family type
50% 45%
42%
37% Tonsley MTA Adel Metro Aust. Avg.
40%
30% 24%
24% 23%
17%
20%
10% 9% 12% 10%
6% 8% 9%
10% 8% 5% 4%
4%
0%
Couple with Couple with non- Couple without One parent with One parent with Lone person
dependent children dependent children children dependent children non-dependent
children
Source: ABS Census of Population & Housing, 2011; MacroPlan Dimasi
Tonsley Urban Renewal Project
17
Assessment of retail development potentialSection 2: Trade area analysis
2.5 Resident trade area retail expenditure capacity
The socio-demographic profiles of the populations within each trade area sector naturally
impact on the retail expenditure capacity of those populations. Chart 2.2 below shows the
estimated retail expenditure levels per person, by category, for the populations of the
various trade area sectors (primary and secondary) as compared with the averages for the
Adelaide metropolitan area and for Australia overall. This chart highlights the below average
retail expenditure level per person within the Tonsley trade area generally, which is to be
expected having regard to the income levels of trade area residents and the other socio-
demographic features of the population.
Chart 2.2
Tonsley main trade area - retail expenditure per person, 2015/16*
Total retail
$16,000
Tonsley MTA Adel Metro Aust. Avg. 13,955
$14,000 13,032
11,880
$12,000
$10,000
7,929
$8,000 6,963 7,403
6,026
4,917 5,629
$6,000
$4,000
$2,000
$0
Total Food Total Non-food Total Retail
Food
$3,500 3,035 3,212
3,072 Tonsley MTA Adel Metro Aust. Avg.
$3,000
$2,500 2,188
1,996 2,094
$2,000 1,740
1,436 1,549
$1,500
$1,000 788
496 688
$500
$0
Fresh Food Other Food & Groceries Packaged Liquor Food Catering
Non-food
$3,000
2,498 Tonsley MTA Adel Metro Aust. Avg.
$2,500 2,316
2,024
$2,000
1,393
$1,500 1,108 1,255
872 1,038 1,072
$1,000 657
575 641
338 378 406
$500
$0
Apparel Household Goods Leisure General Retail Retail Services
*Including GST
Source: MarketInfo; MacroPlan Dimasi
Tonsley Urban Renewal Project
18
Assessment of retail development potentialSection 2: Trade area analysis
Tables 2.3 – 2.5 below detail the current and projected future retail expenditure volumes, by
category, for the respective populations of the primary, secondary north and secondary
south trade area sectors. Spending forecasts are presented in constant 2015/16 dollars (i.e.
excluding retail inflation). This information in turn forms the basis for the estimation of retail
floorspace potential at the Tonsley site, to be drawn from the existing trade area population.
Additional potential will come from the on-site daily population of workers and students,
which are discussed further below.
Table 2.3 below details the total retail expenditure by category for the primary sector
population, while Tables 2.4 and 2.5 show similar data for the secondary north and
secondary south sectors respectively. The retail expenditure categories, as shown in the
tables, are detailed further below.
Retail expenditure category definitions:
FLG: take-home food and groceries, as well as packaged liquor.
Food catering: expenditure at cafes, take-away food outlets and restaurants.
Apparel: clothing, footwear, fashion accessories and jewellery.
Household goods: giftware, electrical, computers, furniture, homewares and hardware goods.
Leisure: sporting goods, music, DVDs, computer games, books, newspapers & magazines, stationery and
photography equipment.
General retail: pharmaceutical goods, cosmetics, toys, florists, mobile phones and pets.
Retail services: hair & beauty, optical goods, dry cleaning, key cutting and shoe repairs.
Tonsley Urban Renewal Project
19
Assessment of retail development potentialSection 2: Trade area analysis
Table 2.3
Tonsley primary sector - retail expenditure by category ($M), 2016-2026*
Year ending FLG Food Apparel Household Leisure General Retail Total
June catering goods retail services retail
2016 35.7 8.8 6.8 12.4 3.6 5.4 2.1 74.8
2017 36.4 9.0 6.9 12.6 3.7 5.5 2.1 76.3
2018 37.2 9.2 7.0 12.9 3.7 5.6 2.2 77.8
2019 38.3 9.5 7.2 13.2 3.8 5.7 2.2 80.0
2020 39.7 10.0 7.4 13.7 3.9 5.9 2.3 83.0
2021 41.2 10.4 7.7 14.2 4.1 6.1 2.4 86.1
2022 42.7 10.8 7.9 14.7 4.2 6.3 2.5 89.1
2023 44.2 11.2 8.2 15.2 4.3 6.5 2.6 92.2
2024 45.7 11.6 8.4 15.7 4.5 6.7 2.7 95.3
2025 47.3 12.1 8.7 16.2 4.6 6.9 2.7 98.6
2026 49.0 12.6 9.0 16.7 4.7 7.1 2.8 101.9
Average annual growth ($M)
2016-2026 1.3 0.4 0.2 0.4 0.1 0.2 0.1 2.7
Average annual growth (%)
2016-2026 3.2% 3.6% 2.8% 3.0% 2.8% 2.8% 3.2% 3.1%
*Constant 2015/16 dollars & including GST
Source: MarketInfo; MacroPlan Dimasi
Table 2.4
Tonsley secondary north sector - retail expenditure by category ($M), 2016-2026*
Year ending FLG Food Apparel Household Leisure General Retail Total
June catering goods retail services retail
2016 18.1 4.6 3.5 6.7 1.8 2.9 1.1 38.8
2017 18.4 4.7 3.6 6.8 1.9 3.0 1.1 39.5
2018 18.7 4.8 3.6 6.9 1.9 3.0 1.1 40.0
2019 18.9 4.9 3.7 7.0 1.9 3.0 1.1 40.5
2020 19.2 5.0 3.7 7.1 1.9 3.1 1.1 41.1
2021 19.5 5.1 3.7 7.1 1.9 3.1 1.2 41.6
2022 19.7 5.2 3.8 7.2 2.0 3.1 1.2 42.2
2023 20.0 5.3 3.8 7.3 2.0 3.2 1.2 42.8
2024 20.3 5.4 3.9 7.4 2.0 3.2 1.2 43.3
2025 20.6 5.5 3.9 7.5 2.0 3.2 1.2 43.9
2026 20.9 5.6 3.9 7.6 2.0 3.3 1.2 44.5
Average annual growth ($M)
2016-2026 0.3 0.1 0.0 0.1 0.0 0.0 0.0 0.6
Average annual growth (%)
2016-2026 1.4% 1.8% 1.0% 1.2% 1.0% 1.0% 1.4% 1.4%
*Constant 2015/16 dollars & including GST
Source: MarketInfo; MacroPlan Dimasi
Tonsley Urban Renewal Project
20
Assessment of retail development potentialSection 2: Trade area analysis
Table 2.5
Tonsley secondary south sector - retail expenditure by category ($M), 2016-2026*
Year ending FLG Food Apparel Household Leisure General Retail Total
June catering goods retail services retail
2016 9.4 2.8 2.2 3.7 1.1 1.5 0.7 21.3
2017 9.6 2.8 2.2 3.8 1.1 1.5 0.7 21.6
2018 9.7 2.9 2.2 3.8 1.1 1.5 0.7 21.9
2019 9.8 2.9 2.2 3.9 1.1 1.5 0.7 22.2
2020 10.0 3.0 2.3 3.9 1.1 1.5 0.7 22.5
2021 10.1 3.0 2.3 4.0 1.1 1.6 0.7 22.8
2022 10.3 3.1 2.3 4.0 1.1 1.6 0.7 23.1
2023 10.4 3.1 2.3 4.1 1.1 1.6 0.7 23.4
2024 10.5 3.2 2.3 4.1 1.1 1.6 0.7 23.7
2025 10.7 3.3 2.4 4.1 1.2 1.6 0.7 24.0
2026 10.8 3.3 2.4 4.2 1.2 1.6 0.8 24.3
Average annual growth ($M)
2016-2026 0.1 0.1 0.0 0.0 0.0 0.0 0.0 0.3
Average annual growth (%)
2016-2026 1.4% 1.8% 1.0% 1.2% 1.0% 1.0% 1.4% 1.3%
*Constant 2015/16 dollars & including GST
Source: MarketInfo; MacroPlan Dimasi
The primary sector population generates annual retail expenditure of $74.8 million at
2015/16. Because of the residential development to be delivered on the Tonsley site, this
retail expenditure volume will increase strongly over coming years, estimated to grow at an
average annual rate of 3.1% over the next decade, to reach $101.9 million at 2026, in
constant 2015/16 dollars.
For each of the secondary sectors the rate of growth in available retail expenditure over the
next decade is expected to be more modest, in the order of 1.3% – 1.4% annually. The two
secondary sectors in combination generate approximately $60 million of retail expenditure
as at 2016, and this figure is projected to increase to some $69 million by 2026.
Tonsley Urban Renewal Project
21
Assessment of retail development potentialSection 2: Trade area analysis
2.6 On-site workforce and student numbers
In addition to the surrounding resident population within the main trade area, the daily on-
site population at the Tonsley site will clearly provide support for the retail facilities to be
provided on site.
At present there are approximately 6,000 students on-site, the majority of them attending
TAFE SA, and approximately 1,400 are accommodated in the Flinders University CSEM
Building. In addition, the estimated workforce accommodated on the Tonsley site at present
is 1,000.
Discussions with Flinders University have revealed that the University plans to construct
another building, adjacent to its existing building at Tonsley, to accommodate a new
business school, which is to be focused on innovation and entrepreneurship, potentially
targeting employees of SMEs in particular. This building is expected to be in the order of
20,000 sq.m in size (the current CSEM Building being approximately 16,000 sq.m) and while
its delivery will be dependent on available funding, there is some likelihood that it could
occur by approximately 2019/20.
Flinders University also plans to significantly increase its total student numbers on its main
campus (which are currently approximately 22,000) to around 30,000 by 2021. As part of this
growth, the University expects to also increase the share of its total student population
accounted for by international students, and to provide additional student accommodation
in order to meet that growth. In the order of 5,000 additional student beds are estimated to
be required, and these additional student beds are expected to be provided in part on the
main Flinders University Campus and in part potentially on the Tonsley site.
The number of workers accommodated on the Tonsley site is also planned to increase
substantially, from its current level of approximately 1,000 to around 6,000 at full
development. Therefore, the contribution to need and demand for retail facilities at Tonsley
to be made by the daytime populations of workers and students will be substantial as the
Tonsley Vision is progressively delivered.
Tonsley Urban Renewal Project
22
Assessment of retail development potentialSection 3: Competition
Map 2.1 previously showed the locations of the various surrounding retail facilities in
proximity to Tonsley, which would be the key competitive facilities to the Tonsley retail
centre. Table 3.1 below summarises each of these relevant competitors.
Table 3.1
Tonsley - schedule of competing retail facilities
Retail Dist. by road from
Centre GLA Major traders Tonsley
(sq.m) (km)
Foodland Marion 2,000 Foodland 1.3
Parkholme SC 5,100 Coles 2.7
Westfield Marion 118,000 Myer, David Jones, Big W, Kmart, Target, 2.8
Harris Scarfe, Coles, Woolworths, Aldi
Pasadena Green 8,000 Target, Foodland 2.9
Castle Plaza 21,400 Target, Foodland, Coles 4.2
Source: Property Council of Australia; MacroPlan Dimasi
The key features of the competitive environment within which the new retail centre at
Tonsley will operate are summarised as follows:
Within the defined primary sector, there are no retail facilities, although immediately to
the west of the primary sector, on the western side of Marion Road, is the Marion
Foodland IGA store, which sits adjacent to a Terry White Chemist and opposite a small
number of local shops, including a pizza shop, a take-away chicken shop, as well as a
SipnSave drive-thru bottleshop. The Romeo’s Foodland IGA is only some 700 sq.m in size,
however, and the total facility is very small in terms of effectively meeting the food and
grocery needs of the primary sector residents.
The nearest other centre is Park Holme SC, which is situated at the north-western edge of
the secondary north sector, at the intersection of Marion Road and Daws Road. The
centre is anchored by a Coles supermarket of approximately 2,100 sq.m, and includes
Tonsley Urban Renewal Project
23
Assessment of retail development potentialSection 3: Competition
approximately 10 supporting specialty stores, with tenants such as Australia Post, Bakers
Delight, The Cheesecake Shop, Chemplus Pharmacy, and various take-away foodstores.
Apart from these two relatively small facilities, the nearest other centres are the much
larger and higher order Westfield Marion, Castle Plaza and Pasadena Green. However,
none of these centres can offer the convenience, particularly for weekly food and grocery
shopping and for other even more frequent shopping needs, to trade area residents,
which will be offered by the proposed Tonsley retail centre.
Tonsley Urban Renewal Project
24
Assessment of retail development potentialSection 4: Comparable projects
While there are no projects which are exactly the same as Tonsley, there are nonetheless a
number of infill/brownfield redevelopment projects undertaken both in Adelaide and in
other major urban areas of Australia, from which some learnings can be drawn and can be
applied to the Tonsley situation.
Table 4.1
Comparable centres - composition
Retail No. of specialty stores
Centre GLA FLG Food Retail Other* Total Majors
(sq.m) catering services
Mawson Central, SA 14,800
• Current 12,000 5 10 2 13 30 Target, Woolworths
• Proposed 2,800 n.a n.a n.a n.a n.a Aldi
St. Clair Village, SA 6,500 3 6 2 4 15 Coles
Subiaco Square, WA 6,500 2 8 3 6 19 Woolworths
Coburg North Village, VIC 6,300 1 6 1 7 15 Coles
Burwood Square, VIC** 10,500 n.a n.a n.a n.a n.a Supermarket, large format liquor
*Including non-retail specialty tenants such as medical centres, fitness centres, real estate agents, banks, etc.
**Proposed centre
Source: Property Council of Australia; MacroPlan Dimasi
Table 4.1 below shows a number of these examples, including Mawson Central and St Clair
Village in Adelaide; Subiaco Square in Perth; together with Coburg North Village and
Burwood Brickworks in Melbourne. Four of the above projects have been completed, while
Burwood Brickworks is currently in the final stages of planning, and expected to commence
construction soon.
The attached Maps 4.1 – 4.5 show the locations of these various projects, and the
surrounding context in each case. All of them are redevelopments of formerly industrial
areas, and generally they have some comparable relationships to existing employment areas
nearby, train stations within relatively short distances, and in some cases, education facilities
also nearby.
A number of the projects, however, have immediate proximity to more densely populated
residential land, in particular Coburg North Village in the northern suburbs of Melbourne and
Burwood Square in the eastern suburbs of Melbourne.
Tonsley Urban Renewal Project
25
Assessment of retail development potentialMap 4.1: Mawson Central Site location
Map 4.2: St Clair Village
Site location
Map 4.3: Subiaco Square
Site location
Map 4.4: Coburg North Village
Site location
Map 4.5: Burwood Square
Site location
Section 4: Comparable projects
The key learnings from these various examples, in terms of retail floorspace provision, can be
summarised as follows:
All of them contain at least one supermarket (at Burwood Brickworks, the anchor tenant
will be a large format supermarket, expected to be Woolworths).
The provision of retail facilities ranges from 6,300 sq.m to 14,800 sq.m (at Mawson
Central, after various stages of developments, and many years after the first stage was
built).
The specialty mix is heavily focused around food catering stores (i.e. take-away food
stores and casual cafes/restaurants) and retail services.
Tonsley Urban Renewal Project
31
Assessment of retail development potentialSection 5: Retail potential at Tonsley
Having regard to all of the information and analysis set out in the previous sections of this
report, this final section now details the estimates of retail floorspace potential at Tonsley,
and provides recommendations as to the suggested mix of tenants to occupy that retail
space.
5.1 Estimated supportable floorspace attributable to resident population
As a first step, Table 5.1 below sets out the estimated retail floorspace (in total) that is
required to meet the needs of the main trade area resident population. The estimates of
floorspace are derived by commencing with the total retail expenditure potential generated
by the main trade area population (detailed, by category, in Tables 2.3 – 2.5 previously in this
report) and applying an average turnover level or Required Turnover Density (RTD) to the
available expenditure. The RTD reflects the reasonable turnover level required to support
sustainable, successful retailing across each of the categories. RTD levels range from $8,500
per sq.m for the take-home food, liquor and groceries category which is primarily serviced by
supermarkets, to $4,000 per sq.m for the household goods category.
Table 5.1
Tonsley resident main trade area - indicative floorspace demand (sq.m), 2016-2026
Year ending FLG Food Apparel Household Leisure General Retail Total
June catering goods retail services retail
RTD ($/sq.m)* 8,500 6,000 4,500 4,000 6,000 7,000 5,500 6,190
2016 7,438 2,703 2,781 5,713 1,083 1,407 694 21,819
2017 7,578 2,765 2,821 5,809 1,099 1,428 707 22,206
2018 7,712 2,824 2,860 5,899 1,114 1,447 719 22,576
2019 7,887 2,899 2,912 6,019 1,134 1,474 735 23,059
2020 8,104 2,989 2,979 6,170 1,160 1,508 755 23,665
2021 8,329 3,083 3,048 6,325 1,188 1,543 776 24,291
2022 8,553 3,177 3,116 6,479 1,214 1,578 796 24,914
2023 8,777 3,271 3,183 6,633 1,241 1,612 817 25,533
2024 9,007 3,369 3,252 6,790 1,268 1,647 838 26,171
2025 9,244 3,469 3,323 6,952 1,296 1,683 860 26,827
2026 9,488 3,574 3,396 7,118 1,325 1,721 882 27,503
*Constant 2015/16 dollars & including GST
Source: MacroPlan Dimasi
Tonsley Urban Renewal Project
32
Assessment of retail development potentialSection 5: Retail potential at Tonsley
Tables 5.2 – 5.4 set out the estimates of retail floorspace potential that can be retained, from
each trade area sector and then in total across the main trade area, at Tonsley. These
estimates are based on our assessment of the proportions of available retail expenditure in
each category, across each trade area sector, that can be retained by a neighbourhood level
retail centre at the Tonsley site. The key features of these estimated retention rates are the
following:
Unsurprisingly, the estimated rates of retention of available expenditures from the
primary sector are much higher than is the case from the two secondary sectors.
The expected rates of retention of food and grocery spending (primarily attributable to a
supermarket, which is expected to be the anchor store for the retail facilities at Tonsley)
are much higher than is the case for expenditure across other categories.
The retention rates generally of convenience type retail expenditure (e.g. general
retailing, retail services) are significantly higher than retention rates of comparison retail
expenditure (on categories such as apparel, household and household goods). Indeed, for
a category such as apparel, it is unlikely that any of the available trade area expenditure
can reasonably be retained at Tonsley, because the type of retail centre which can be
delivered at Tonsley will not be able to offer any critical mass in apparel retailing, and
realistically is unlikely to attract any apparel retailers.
Tonsley Urban Renewal Project
33
Assessment of retail development potentialSection 5: Retail potential at Tonsley
Table 5.2
Tonsley resident primary sector - potential floorspace retained (sq.m), 2016-2026
Year ending FLG Food Apparel Household Leisure General Retail Total
June catering goods retail services retail
Pot. retained 60% 30% 0% 10% 10% 25% 40% 31%
2016 2,520 440 0 310 60 194 151 3,675
2017 2,572 451 0 316 61 197 154 3,751
2018 2,625 462 0 322 62 200 157 3,828
2019 2,701 477 0 331 64 205 162 3,940
2020 2,804 498 0 343 66 212 168 4,089
2021 2,910 518 0 355 68 219 174 4,244
2022 3,015 539 0 367 70 226 181 4,399
2023 3,120 560 0 379 72 233 187 4,551
2024 3,228 582 0 391 75 240 193 4,710
2025 3,340 605 0 404 77 248 200 4,873
2026 3,456 628 0 417 79 255 207 5,043
Source: MacroPlan Dimasi
Table 5.3
Tonsley resident secondary north sector - potential floorspace retained (sq.m), 2016-2026
Year ending FLG Food Apparel Household Leisure General Retail Total
June catering goods retail services retail
Pot. retained 25% 10% 0% 0% 0% 10% 15% 11%
2016 532 77 0 0 0 42 29 681
2017 541 79 0 0 0 43 30 693
2018 549 80 0 0 0 43 30 703
2019 557 82 0 0 0 43 31 713
2020 564 83 0 0 0 44 31 723
2021 572 85 0 0 0 44 32 733
2022 580 86 0 0 0 45 32 744
2023 589 88 0 0 0 45 33 754
2024 597 90 0 0 0 46 33 765
2025 605 91 0 0 0 46 34 776
2026 614 93 0 0 0 47 34 787
Source: MacroPlan Dimasi
Tonsley Urban Renewal Project
34
Assessment of retail development potentialSection 5: Retail potential at Tonsley
Table 5.4
Tonsley resident secondary south sector - potential floorspace retained (sq.m), 2016-2026
Year ending FLG Food Apparel Household Leisure General Retail Total
June catering goods retail services retail
Pot. retained 25% 10% 0% 0% 0% 10% 15% 10%
2016 278 46 0 0 0 21 18 363
2017 282 47 0 0 0 21 18 369
2018 285 48 0 0 0 22 19 374
2019 289 49 0 0 0 22 19 379
2020 293 50 0 0 0 22 19 384
2021 297 51 0 0 0 22 19 390
2022 302 52 0 0 0 23 20 395
2023 306 52 0 0 0 23 20 401
2024 310 53 0 0 0 23 20 406
2025 314 54 0 0 0 23 20 412
2026 318 55 0 0 0 23 21 418
Source: MacroPlan Dimasi
Table 5.5
Tonsley resident main trade area - potential floorspace retained (sq.m), 2016-2026
Year ending FLG Food Apparel Household Leisure General Retail Total
June catering goods retail services retail
Pot. retained 45% 21% 0% 5% 6% 18% 29% 22%
2016 3,329 564 0 310 60 257 198 4,719
2017 3,395 577 0 316 61 261 202 4,812
2018 3,459 591 0 322 62 265 206 4,905
2019 3,547 608 0 331 64 270 211 5,032
2020 3,662 631 0 343 66 278 218 5,197
2021 3,780 654 0 355 68 286 225 5,367
2022 3,897 677 0 367 70 294 232 5,537
2023 4,014 701 0 379 72 301 239 5,706
2024 4,135 725 0 391 75 309 246 5,881
2025 4,259 750 0 404 77 317 254 6,061
2026 4,388 776 0 417 79 325 262 6,247
Source: MacroPlan Dimasi
Tonsley Urban Renewal Project
35
Assessment of retail development potentialSection 5: Retail potential at Tonsley
As detailed in Table 5.5 above, the main trade area resident population is estimated to
support a retail floorspace provision, at 2016, of approximately 4,700 per sq.m at the
Tonsley site. Over the next decade, the amount of supportable floorspace, attributable to
the main trade area resident population, is estimated to increase to 6,250 sq.m.
A key feature of the estimates set out in Table 5.5 is the quantum of estimated supportable
FLG floorspace, i.e. floorspace selling, take-home food, packaged liquor and groceries. The
amount of such floorspace estimated to be supportable at the Tonsley site, attributable
solely to the main trade area resident population, is 3,329 sq.m at 2016, and is projected to
increase to 4,388 sq.m by 2026, with the growth largely attributable to the additional
resident population to be accommodated at the Tonsley site.
The first conclusion which can be drawn, therefore, is that there is sound demand, from the
existing resident population, to support a full size supermarket at Tonsley and that demand
will increase noticeably over the next decade.
5.2 Additional supportable floorspace attributable to on-site daily population
In addition to the floorspace that will be supportable by the main trade area population,
additional demand, as previously detailed, will come from the on-site daily population, which
includes workers and students.
Table 5.6 below details the total retail floorspace estimated to be supportable at the Tonsley
site after allowing for the additional demand from on-site workers and students. That
additional demand has been estimated having regard to the current numbers of both
workers and students, as discussed previously in Section 2 of the report, and the expected
steady growth in on-site worker numbers in particular, which is assumed to occur at a similar
rate to the growth in on-site resident population.
The contributions to retail floorspace demand from workers and students on the Tonsley site
are estimated at 2016 by having regard to the numbers of workers and students; their
estimated retail expenditure level per person; the total retail floorspace demand which that
Tonsley Urban Renewal Project
36
Assessment of retail development potentialSection 5: Retail potential at Tonsley
expenditure will support; and the proportions of that total retail floorspace demand which
these workers and students are likely to direct to a neighbourhood level retail facility that is
provide at their place of work/study.
The additional demand from workers and students, based on the above methodology, is
calculated to account for the following additions to the previously established levels of
demand attributable to the trade area resident population:
An increase of 10% on the demand for FLG floorspace.
An increase of 75% to the floorspace demand for food catering floorspace (due to the fact
that much of the demand from both workers and students will be directed to this retail
category, which is expected to experience a much higher rate of retention on site than
any of the other categories).
A 40% in demand for leisure retail floorspace.
A 20% increase in demand for general retail floorspace
A 20% increase in demand for retail services floorspace.
Overall, a 16% increase in demand for total retail floorspace, once all of the categories are
taken into account.
Tonsley Urban Renewal Project
37
Assessment of retail development potentialSection 5: Retail potential at Tonsley
Table 5.6
Tonsley - potential floorspace retained (sq.m), 2016-2026
Year ending FLG Food Apparel Household Leisure General Retail Total
June catering goods retail services retail
Pot. resident spend retained 45% 21% 0% 5% 6% 18% 29% 22%
2016 3,662 987 0 310 84 308 238 5,589
2017 3,734 1,010 0 316 85 313 243 5,702
2018 3,805 1,033 0 322 87 318 247 5,813
2019 3,902 1,064 0 331 89 325 254 5,965
2020 4,028 1,104 0 343 92 334 262 6,161
2021 4,158 1,144 0 355 95 343 270 6,365
2022 4,287 1,185 0 367 98 352 279 6,568
2023 4,416 1,226 0 379 101 361 287 6,770
2024 4,548 1,269 0 391 104 371 296 6,979
2025 4,685 1,313 0 404 108 380 305 7,195
2026 4,827 1,358 0 417 111 390 314 7,417
% from workers/students 10% 75% 0% 0% 40% 20% 20% 16%
*Constant 2015/16 dollars & including GST
Source: MacroPlan Dimasi
Once allowance is made for the additional demand from on-site workers and students, the
total estimated retail floorspace demand at Tonsley increases to some 5,600 sq.m at 2016.
By 2026, the level of retail floorspace demand is estimated to have grown to approximately
7,400 sq.m.
The recommendations for centre scale, mix and timing, set out below, are based on the
above analysis. However, the potential for the centre will also be augmented, to a small
degree, by additional business that will be attracted from beyond the main trade area, e.g.
from residents of other, nearby, suburbs and from visitor to Tonsley.
Tonsley Urban Renewal Project
38
Assessment of retail development potentialSection 5: Retail potential at Tonsley
5.3 Recommended centre scale and mix
Table 5.7 below details the recommended scale and mix for the retail facilities at Tonsley.
The key features are the following:
First, we consider that a full scale supermarket, in the order of 3,200 sq.m – 3,500 sq.m,
should be the anchor tenant.
In addition to the supermarket, a limited number of fresh food specialty stores, including
a bakery and potentially a butcher, a seafood operator, and fresh produce specialist, to
supplement the FLG offer.
We further recommend a provision in the range of 1,200 – 1,500 sq.m of floorspace to be
directed to food catering, comprising take-away foodstores, cafes, and a small number of
casual restaurants.
While there will be some demand for household goods floorspace, most of that demand
would typically be met, in a centre of this scale and nature, by the supermarket anchor,
through its general merchandise offer including items such as cutlery and crockery,
household linen, and laundry items, etc.
The Leisure Retail category and the General Retail category can support a number of
tenants such as newsagency, pharmacy and potentially a mobile phone outlet.
Retail services can include hairdressers, optometrist, repair kiosk (such as Mr Minit), and
drycleaning.
Finally, in addition to the retail facilities, various non-retail uses can add further to the
total centre floorspace. Such non-retail uses can include fitness centre, medical centre,
real estate agents, travel agencies and potentially one or two banks.
In terms of timing, we consider such a centre will be supportable once the road
infrastructure on-site has been delivered and the on-site residential development is under
way, i.e. within the next few years.
Tonsley Urban Renewal Project
39
Assessment of retail development potentialSection 5: Retail potential at Tonsley
Table 5.7
Tonsley - Indicative centre scale and mix
Category GLA
(sq.m)
Supermarket 3,500
Retail specialties
Food & liquor 500
Food catering 1,200
Leisure 100
General 400
Retail services 300
Total retail spec. 2,500
Total centre - retail 6,000
Non-retail
Real estate/travel agent 100
Bank 100
Fitness centre 400
Medical centre 400
Total non-retail 1,000
Total centre 7,000
Source: MacroPlan Dimasi
Table 5.8 below provides more detail as to the type of specialty tenancy mix which could be
supported at the proposed centre.
Table 5.8
Tonsley - Suggested tenants
Category Suggested tenants
Food & liquor Bakery, butcher, seafood, fresh food produce
Nandos, Subway, Roll'd, Grill'd, Guzman y Gomez, Schnitz, Boost, Noodle Hut,
Food catering
Sumo Salad, Muffin Break, Cibo, fish and chips, casual Italian restaurant
Leisure/general Newsagency, pharmacy, florist, Optus, Telstra, Vodaphone
Retail services Hairhouse Warehouse, Specsavers, barber, repairs, dry cleaning
Non-retail Fitness centre, bank, travel agent, real estate agent, medical centre
Source: MacroPlan Dimasi
Tonsley Urban Renewal Project
40
Assessment of retail development potentialYou can also read