Ground Motion in Anchorage, Alaska, from the 2002 Denali Fault Earthquake: Site Response and Displacement Pulses
←
→
Page content transcription
If your browser does not render page correctly, please read the page content below
Bulletin of the Seismological Society of America, Vol. 94, No. 6B, pp. S72–S84, December 2004

        Ground Motion in Anchorage, Alaska, from the 2002 Denali Fault
              Earthquake: Site Response and Displacement Pulses
                                                          by David M. Boore

                Abstract Data from the 2002 Denali fault earthquake recorded at 26 sites in and
                near Anchorage, Alaska, show a number of systematic features important in studies
                of site response and in constructing long-period spectra for use in earthquake engi-
                neering. The data demonstrate that National Earthquake Hazards Reduction Program
                (NEHRP) site classes are a useful way of grouping stations according to site ampli-
                fication. In general, the sites underlain by lower shear-wave velocities have higher
                amplification. The amplification on NEHRP class D sites exceeds a factor of 2 relative
                to an average of motions on class C sites. The amplifications are period dependent.
                They are in rough agreement with those from previous studies, but the new data show
                that the amplifications extend to at least 10 sec, periods longer than considered in
                previous studies. At periods longer than about 14 sec, all sites have motion of similar
                amplitude, and the ground displacements are similar in shape, polarization, and am-
                plitude for all stations.
                   The displacement ground motion is dominated by a series of four pulses, which
                are associated with the three subevents identified in inversion studies (the first pulse
                is composed of P waves from the first subevent). Most of the high-frequency ground
                motion is associated with the S waves from subevent 1. The pulses from subevents
                1 and 2, with moment releases corresponding to M 7.1 and 7.0, are similar to the
                pulse of displacement radiated by the M 7.1 Hector Mine earthquake. The signature
                from the largest subevent (M 7.6) is more subdued than those from the first two
                subevents. The two largest pulses produce response spectra with peaks at a period
                of about 15 sec. The spectral shape at long periods is in good agreement with the
                recent 2003 NEHRP code spectra but is in poor agreement with the shape obtained
                from Eurocode 8.

                        Introduction
     Anchorage, Alaska, is built on the edge of a deep sed-                  velocity sediments and the metamorphic bedrock is ideal for
imentary basin at the foot of the Chugach Mountains. The                     the amplification of seismic waves, and a number of empir-
maximum thickness of the Quaternary and early middle Ter-                    ical site-amplification studies have been published for the
tiary basin sediments is more than 7 km at a point about                     Anchorage area. These studies include generalized inversion
150 km southwest of Anchorage, and the basin thickness                       (Dutta et al., 2001) and horizontal-to-vertical spectral ratios
exceeds 1 km in the western part of the city (Hartman et al.,                (Nath et al., 2002) of weak-motion data from a temporary
1974). The Quaternary deposits under Anchorage include                       network of stations. A permanent network of strong- and
Pleistocene glacial deposits and the silt and clay of the Boot-              weak-motion stations was installed after the success of the
legger Cove formation (Dutta et al., 2001). Shear-wave ve-                   temporary network. Several studies of site response using
locities, measured at 36 sites in the basin (Nath et al., 1997;              weak- and strong-motion recordings from the new network
Dutta et al., 2000), show that most of the city is built on                  have been published, including the use of spectral ratios
deposits that fall within National Earthquake Hazards Re-                    (Martirosyan et al., 2002) and generalized inversion (Dutta
duction Program (NEHRP) site classes C and D (Fig. 1)                        et al., 2003). These last two studies computed site response
(NEHRP site classes are defined in terms of the time-                        at the basin stations relative to a reference site in the nearby
averaged velocities of shear waves to 30 m, as follows: A,                   Chugach Mountains. All of the studies focused on site re-
greater than 1500 m/sec; B, between 1500 and 760 m/sec;                      sponse within the 0.5 to 11 Hz frequency range, and not
C, between 760 and 360 m/sec; D, between 360 and 180                         surprisingly, all of the studies found significant frequency-
m/sec; E, less than 180 m/sec). The combination of the low-                  dependent site amplifications on the sediments beneath the

                                                                       S72
Ground Motion in Anchorage, Alaska, from the 2002 Denali Fault Earthquake S73
from 0 to 50 Hz. The sensor output was recorded on data-
K2-01 loggers with 114 db dynamic range at 200 samples per sec-
K2-02 ond. The data were provided by the U.S. Geological Survey
1737 K2-03
(USGS) and the University of Alaska and are available from
61.2 K2-05
K2-19 1736 K2-06 nsmp.wr.usgs.gov. The stations are plotted in Figure 1. Al-
K2-09
K2-04
1751
1741 most all data had drifts in displacement derived from double
1731 K2-08 integration of the acceleration trace. To eliminate these
Latitude (oN)
K2-07 1744
K2-12 drifts, the data were processed using simple baseline correc-
ts.
K2-21
K2-20 1397 K2-11
hM
1734 tions and low-cut filtering with a second-order acausal 0.02
gac
Hz butterworth filter; similar results were obtained using
Chu
K2-14
D
K2-13 longer-period filters.
C/D
61.1 C K2-16 The three components of ground displacement at two
K2-22 sites underlain by very different materials are shown in Fig-
ure 2. The station K2-20 has a strong broadband site re-
sponse centered at about 0.2 Hz, which leads to the increased
-150 -149.8
chatter as compared to the recordings at K2-16 (see gray
Longitude (oE) curves in Fig. 2). By filtering out high frequencies to elim-
inate this chatter, it is clear that the longer-period motions
Figure 1. Location of stations and NEHRP site
classes (site classes and base map from Fig. 12 by at these two dissimilar sites are comparable (see black curves
Martirosyan et al., 2002). The C/D class is interme- in Fig. 2). The displacements are composed of four bursts
diate between NEHRP classes C and D and is defined of energy at times near 35, 70, 100, and 170 sec, labeled in
by Martirosyan et al. (2002) by the average shear- Figure 2 as pulses 1, 2, 3, and 4, respectively. The wave-
wave velocity to 30 m being between 320 and 410 m/ forms do not have the dispersed character associated with
sec.
waves traveling across thick sedimentary basins (e.g., Boore,
1999). Pulses 1 and 2 correspond to the P- and S-wave ar-
city. Although the detailed site-specific findings differ rivals from what has been termed by Frankel (2004) as “sub-
amongst the studies, they all find on average that the largest event 1,” interpreted as the thrust fault initiating the earth-
site amplifications are on the lower-velocity class D sites, quake (the Susitna Glacier fault). Pulses 3 and 4 correspond
with average amplifications around 3 at low frequencies (0.5– to S waves from the strike-slip subevents 2 and 3 (Eberhart-
2.5 Hz) and around 1.5 at higher frequencies (3.0–7.0 Hz). Phillips et al., 2003; Frankel, 2004). Subevent 2 was a con-
The 2002 M 7.9 Denali fault earthquake was well re- centrated zone of moment release on the portion of the
corded on digital strong-motion instruments deployed in the Denali fault near the crossing of the Trans-Alaska Pipeline;
Anchorage metropolitan area. These recordings provide an subevent 3 occurred farther east. The moment releases on
opportunity to compare site amplifications with those from the three subevents corresponded to moment magnitudes
the earlier studies, which used data from many events, and 7.1, 7.0, and 7.6, respectively (Frankel, 2004).
more importantly, are rich enough in low-frequency content Hodograms of the high-cut-filtered horizontal displace-
that the site amplifications can be computed at lower fre- ments at the two stations K2-20 and K2-16 are shown in
quencies than in the previous studies. I find that site ampli- Figures 3a and b for the four pulses identified in Figure 2.
fication extends to periods of about 14 sec. The polarizations are very similar for the same pulses on the
In addition to studies of site amplification, I discuss the two stations (and for the other stations, although not shown
individual pulses of ground displacement on the records. The here), and the polarizations show a systematic clockwise ro-
displacement pulses are similar to those from the much tation from pulse 2 through pulse 4. Frankel (2004) identifies
smaller M 7.1 Hector Mine, California, earthquake. The pulses 1 and 2 as coming from subevent 1. The polarization
pulses are of long-enough period to be relatively insensitive for pulse 1 is consistent with P waves from that subevent,
to local variations in site geology, and they produce a local but pulse 2 is almost pure transverse motion, which at first
increase in response spectra at periods between 10 and 20 seems inconsistent with radiation from an almost pure thrust
sec. In addition, the pulses show site-independent but pulse- fault (as found by Frankel, 2004). The S-wave radiation pat-
dependent polarizations. Interestingly, most of the high- tern for Frankel’s fault orientation for the subevent 1-to-
frequency content in the ground motion is carried by the S- Anchorage azimuth (about 205⬚), however, is pure SH for
wave pulse produced by subevent 1. These observations are takeoff angles of 15⬚ and 105⬚. Because the actual waves
consistent with the results of Frankel (2004). composing the motion at Anchorage are probably made up
of a series of arrivals corresponding to different takeoff an-
Data Processing and Characteristics gles, I am not sure if the values of the radiation pattern for
a specific ray can be used to predict the polarization of the
The data analyzed in this article were obtained on force- relatively long-period ground displacements. A more con-
balance accelerometers whose response is flat to acceleration vincing argument for the consistency of the subevent 1S74 D. M. Boore
Displacement (cm)
K2-20, UP K2-16, UP
1 1
0 0
-1 -1
-2 -2
4 K2-20, NS 4 K2-16, NS
Displacement (cm)
2 2
0 0
-2 -2
1 2 3 4
-4 -4
4 4
K2-20, EW K2-16, EW
Displacement (cm)
2 2
0 0
-2 -2
-4 -4
0 50 100 150 200 250 0 50 100 150 200 250
Time (s) Time (s)
Figure 2. Displacements at stations K2-16 and K2-20, showing the strong (and
differing) polarization of the four dominant displacement pulses. The vertical gray lines
indicate the windows used in constructing hodograms (they are not at the same times
for the two stations because the amount of pre-event motion was slightly different at
the two stations; the record at K2-16 started 1 sec after that at K2-20, and I did not
shift the records to align arrivals). Station K2-20 is on lower velocity materials and has
more high frequency motion than does station K2-16. The numbers below the K2-16,
NS trace label the pulses referred to in the text. Gray curves have been low-cut filtered
at 0.02 Hz; black curves have been low-cut filtered at 0.02 Hz and high-cut filtered at
0.08 Hz.
mechanism and the observed polarization of pulse 2 is Fran- tion from subevent 3. This suggests that lateral refraction
kel’s waveform modeling, which produces a good fit to pulse due to lateral changes in crustal structure may be producing
2 on both horizontal components in Anchorage, using the small rotations in the observed polarization for certain travel
nearly-pure-thrust mechanism for subevent 1. The clockwise paths.
rotation of the polarization from pulse 3 to pulse 4 is con-
sistent with SH waves being radiated from portions of the Site Response
Denali fault at points progressively to the east and the south-
east of the hypocenter (subevent 1). If composed of SH body As indicated in the introduction, a number of previous
and surface waves, pulse 4 seems to be coming from an studies have found significant and systematic site response
azimuth of about 60⬚ to 70⬚ clockwise from north, which in the Anchorage area, and therefore it will be no surprise
puts its source southeast of Frankel’s subevent 3, possible to find the same for records of the Denali fault earthquake.
along the Totschunda fault. Because his interpretations are The first indication of site response is in differences of peak
based on careful study of a number of records obtained from acceleration, velocity, and displacements for the various sta-
various locations in Alaska, it is unlikely that subevent 3 has tions. The corresponding time series are shown in Figure 4
been mislocated by Frankel (2004). His waveform modeling for the same two stations used in the previous figures—K2-
underestimates the peak motions on the north–south com- 20 and K2-16 (the station in the Chugach Mountains). As
ponent at Anchorage by about 20%, and thus the polarization noted before, these two stations are underlain by dissimilar
for his model is counterclockwise relative to the observed near-surface materials. Note the increase of all three mea-
polarization in Figure 3 and is consistent with SH polariza- sures of ground shaking at K2-20 compared to K2-16, withGround Motion in Anchorage, Alaska, from the 2002 Denali Fault Earthquake S75
(a)
2 4
24--54 s to s.e. 1 54--84 s to s.e. 1
1 2
North
North
0 0
-1 -2
-2 -4
-2 -1 0 1 2 -4 -2 0 2 4
4 4
94--124 s 154--194 s
to s.e. 2 to s.e. 3
2 2
North
North
0 0
-2 -2
-4 -4
-4 -2 0 2 4 -4 -2 0 2 4
East East
Figure 3. Hodograms of horizontal displacements in centimeters (bandpass filtered
as in Figure 2) at (a) station K2-20 and (b) at station K2-16 for the four time windows
indicated on Figure 2, showing the strong (and differing) polarization of the dominant
displacement pulses. The azimuth from the station to the point of maximum moment
release per km of faulting for each indicated subevent (s.e.) is shown, as well as the
transverse direction to this azimuth. A 42.6⬚ correction (U. Dutta, oral comm., 2003)
has been applied to the orientation of the horizontal components. Note that the scale
for the graph showing the displacements in the first time window is half that of the
other graphs. (continued)
the greatest difference being for the higher-frequency mo- symbol used in the plot. An average of class C motions was
tions. Also seen is something not obvious from plots of peak used as the reference rather than the motions at station K2-
motions alone: the highest accelerations are associated with 16, on bedrock in the Chugach Mountains, because the K2-
pulse 2, with little or no increase of accelerations at the ar- 16 site seems to have its own amplification at frequencies
rival times of pulses 3 and 4 (I show later the influence of above 7 to 8 Hz (Martirosyan and Biswas, 2002; Martirosyan
this difference on response spectra). This was noted by Fran- et al., 2002). As measured by the ratios of peak motion
kel (2004) in his interpretation of envelopes of high- shown in Figure 5, the site amplification exists for all three
frequency ground motions. measures of ground motion, but the amplification is clearly
more sensitive to site class for peak acceleration than for
Variation by NEHRP Site Class peak displacement. There are consistent differences in the
Figure 5 shows plots of ratios of peak acceleration, peak mean amplifications within each site class, with larger am-
velocity, and peak displacement relative to the average of plifications for sites underlain by lower-velocity materials.
motions recorded at class C sites. The amplifications for in- Much scatter, however, remains for the amplifications within
dividual stations on different site classes are indicated by the each class, particularly for peak acceleration. The largeS76 D. M. Boore
(b)
2 4
23--53 s to s.e. 1 53--83 s to s.e. 1
1 2
North
North
0 0
-1 -2
-2 -4
-2 -1 0 1 2 -4 -2 0 2 4
4 4
93--123 s 153--193 s
to s.e. 2 to s.e. 3
2 2
North
North
0 0
-2 -2
-4 -4
-4 -2 0 2 4 -4 -2 0 2 4
East East
Figure 3. Continued.
station-to-station variability of ground motions within a periods of about 14 sec and are observable because of the
given site class is a common finding in many studies. relatively large radiation at long periods for the Denali fault
NEHRP classes are also an effective way of grouping earthquake. Comparisons are given in Figure 6 of the ob-
the amplifications given both by response spectra (Fig. 6) served amplification with those in the 2000 NEHRP building
and by Fourier spectra (Fig. 7), and more information about code. Although the increase or decrease relative to unity is
the periods corresponding to the site amplifications are given the same for the observed and the NEHRP amplifications, the
by such amplifications than in amplifications corresponding values of the amplifications are in poor agreement with the
to peak ground acceleration, velocity, and displacement. As longer-period motions at both class D and class B sites, be-
with the ratios of peak motions, the amplifications shown in ing underpredicted by the NEHRP code relative to motions
Figures 6 and 7 are clearly separated by site class. At fre- on class C sites (class D relative to class C at short periods
quencies less than about 2 Hz the amplification is largest for being an exception).
site class D, and the deamplification at higher frequencies is Although engineers often characterize site response as
also largest for site class D. This is qualitatively expected as ratios of response spectra, caution is needed in the interpre-
the result of the trade-off between increased amplification tation of response spectral amplifications, particularly at
and increased attenuation for the lower-velocity materials short oscillator periods where the actual ground motion may
characterizing class D sites. Of particular interest are the be devoid of energy. Because the short-period asymptote of
large site amplifications at periods much longer than used in a response spectrum is controlled by the peak ground accel-
previous studies of site amplification in Anchorage (the eration, the ratios of response spectra at short periods will
range of the previous studies is shown by the double-sided equal the ratios of the peak accelerations, and the apparent
arrows in Figures 6 and 7); these amplifications persist to amplification may not represent true high-frequency ground-Ground Motion in Anchorage, Alaska, from the 2002 Denali Fault Earthquake S77
Figure 4. Accelerations, velocities, and displacements at stations K2-20 and K2-16
for the east–west component.
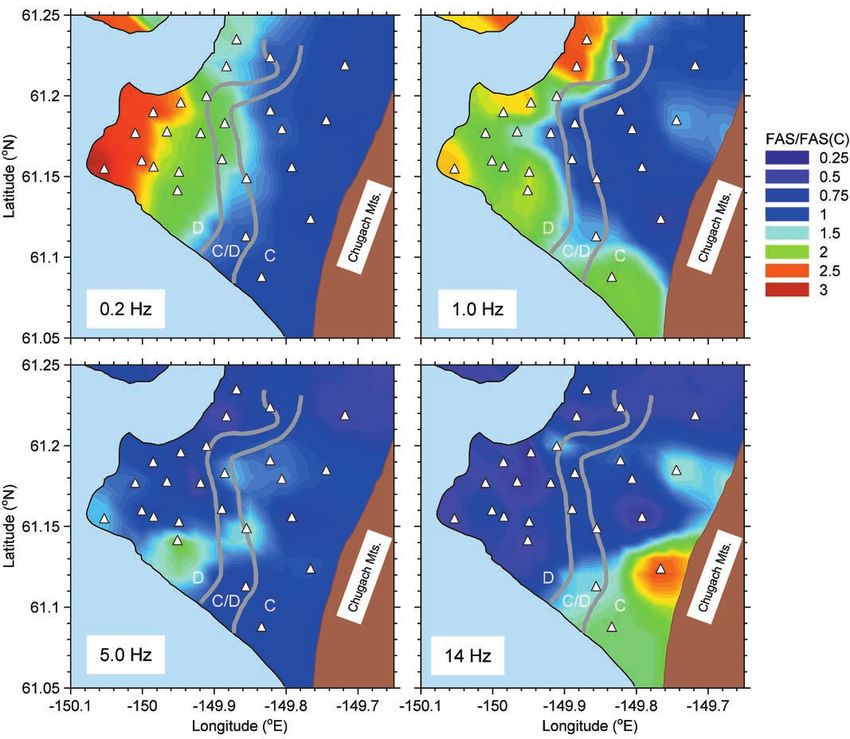
motion amplification if the peak accelerations are controlled bution of site classes, it is possible to construct a map of site
by frequencies less than the oscillator frequencies. In the amplifications. This has been done for amplifications of mo-
present results this is clearly seen by comparing the response tions at four frequencies, ranging from 0.2 to 14 Hz; the
spectral and Fourier spectral amplifications at frequencies results are shown in Figure 8. Although some of the variation
above about 8 Hz (Figs. 6, 7). The class C/D and class D is clearly controlled by a single station, these maps show
response spectra show an apparent amplification at higher systematic trends not captured by simply looking at ampli-
frequencies, consistent with the peak acceleration ratios fications in a site class. In particular, note the increase of
shown in Figure 5. But they should not be interpreted as amplification toward the west for low-frequency motions.
indicating greater site amplification at high frequencies for The trend for the 0.2 Hz motions roughly corresponds to
lower-velocity sites. In fact, as Figure 7 shows, the opposite increasing depth to bedrock. The spatial variations at higher
is true: there is a deamplification at frequencies greater than frequencies may be due to local variations in near-surface
8 Hz for class D sites. geology, as discussed in some detail by Dutta et al. (2001),
Martirosyan et al. (2002, 2004), Nath et al. (2002), and Dutta
Spatial Variation et al. (2003).
The previous figures showing site amplifications have
largely dealt with amplifications within site classes. But what Comparison with Previous Studies
of spatial variation? Given the relatively large number of For periods common both to previous studies and to this
stations in the Anchorage area, and the nonrandom distri- study I made quantitative comparisons of the site amplifi-S78 D. M. Boore
2.5 Displacement Pulses
PGA(station)/PGA(C) class B
class C Comparison with Pulses from 1999 Hector Mine,
2 class C/D California, Earthquake
class D
One of the interesting features of the recordings in An-
1.5 chorage is the displacement pulses. This section discusses a
few things associated with these pulses: the differing fre-
1 quency content of the pulses, the similarity to pulses from a
smaller earthquake occurring in California, and the contri-
bution of the pulses to the long-period response spectral
0.5
shape.
2.5 As noted before, the maximum accelerations are asso-
class B ciated with pulse 2. The consequence of this is clearly seen
PGV(station)/PGV(C)
class C
2 class C/D
by comparing response spectra for the whole record with
class D those computed for the portions of the records corresponding
to the two largest displacement pulses (pulses 2 and 3). The
1.5
results are shown in Figure 11 for stations K2-20 and K2-
16. Nearly all of the response at periods shorter than 1 sec
1 and 4 sec is contributed by pulse 2 for stations K2-20 and
K2-16, respectively, but both pulses contribute essentially
0.5 equally to the peak in the spectra between 10 and 20 sec.
The richness of high-frequency radiation of subevent 1 (cor-
2.5
responding to pulse 2) relative to subevents 2 and 3 was
class B
noted by Frankel (2004); my results illustrate the same con-
PGD(station)/PGD(C)
class C
2 class C/D clusion using a different measure of ground motion.
class D I was struck with the similarity of the displacement
1.5 pulses in Anchorage from the M 7.9 Denali fault earthquake
with the pulse radiated by the M 7.1 1999 Hector Mine,
California, earthquake (see Boore et al., 2002). To make a
1 quantitative comparison of the pulses, two copies of a rep-
resentative pulse from the Hector Mine earthquake are su-
0.5 perposed on the K2-03 record of the Denali fault earthquake
in Figure 12. The Hector Mine motion is the transverse dis-
Figure 5. Peak accelerations, velocities, and dis- placement from a station at an azimuth approximately nor-
placements, relative to the geometric mean of motions
on class C sites, grouped by site class. All motions mal to the strike-slip faulting in the Hector Mine earthquake
are oriented east–west. (see Fig. 1 by Boore et al., 2002); the displacement pulse
was shifted to match the arrival times of the Denali earth-
quake pulses, and its amplitude was multiplied by 0.38 to
cations. Figure 9 shows a comparison of site amplification correct for differences in propagation distances. The factor
from Martirosyan et al. (2002) at two stations, relative to of 0.38 was obtained by evaluating the ground-motion pre-
K2-16. The amplification has been computed both from Fou- diction equations of Sadigh et al. (1997) for magnitude 7.1
rier spectra and response spectra. Focusing only on the Fou- and for the closest source-to-station distances for the 1999
rier spectra amplification, the comparison is relatively good and 2002 earthquakes. The Sadigh et al. (1997) equations
for station K2-01 in that the frequencies of amplification were chosen because they were used by Wesson et al. (1999)
peaks coincide, as does the general level of amplification. in constructing probabilistic hazard maps for Alaska. The
The comparison for K2-02 is not as good, particularly above acceleration times series leading to the displacements were
2 Hz. Figure 10 shows another comparison, in this case of processed in identical ways for both earthquakes (note that
averages of Fourier spectra over two frequency bands. The the results of Boore et al., 2002, used a causal low-cut filter
amplifications are more compatible for the lower-frequency rather than the acausal low-cut filter used here; the displace-
band (0.5–2.5 Hz) than for the higher-frequency band (3.0– ment waveforms can be quite different for the two types of
7.0 Hz), although there is much scatter within each band. It filters). The waveforms and amplitudes for the two events
is not surprising to see this scatter, as many studies find are similar, consistent with the finding of Frankel (2004) that
significant event-to-event variation for a single station pair pulses 2 and 3 correspond to subevents of moment magni-
and station-to-station variation for a single event (see, e.g., tude similar to that of the 1999 earthquake (7.1 and 7.0,
the review by Boore, 2004). compared to 7.1 for the Hector Mine earthquake). AlthoughGround Motion in Anchorage, Alaska, from the 2002 Denali Fault Earthquake S79
EW Component
class D
10 class C/D
Ratio (relative to geometric mean of class CC)
class C
freq. range of previous site response studies 3 class B (one site)
NEHRP class B/class C
NEHRP class D/class C
8
PSV (cm/s) (5% damping)
source 2
effect
6
4 1
2
range of previous site response studies
0 0.4
0.1 1 10 0.1 1 10
Frequency (Hz) Frequency (Hz)
Figure 6. Range of standard error of the geometric means of 5%-damped pseudo
relative velocity (PSV) response spectra of the east–west motion for recordings on the
same NEHRP site class, and ratio of the range of standard error of the geometric means
relative to the geometric mean of the spectra on class C sites. The short, wide bars are
the site amplifications from the 2000 NEHRP building code (BSSC, 2001). For purposes
of comparing with a subsequent plot of Fourier amplitude spectra, frequency rather
than period is used for the abscissa.
EW Component
25 class D
Ratio (relative to geometric mean of class CC)
range of previous site response studies 3 class C/D
class C
class B (one site)
20
Fourier Acceleration (cm/sec)
2
15
10 1
5
range of previous site response studies
0 0.4
0.1 1 10 0.1 1 10
Frequency (Hz) Frequency (Hz)
Figure 7. Range of standard error of the geometric means of smoothed Fourier
amplitude spectra of the east–west component accelerations recorded on the same
NEHRP site class, and ratio of the range of standard error of the geometric means relative
to the geometric mean of the spectra on class C sites. The individual spectra were
smoothed with a triangular smoothing operator with a base width of 1 Hz.S80 D. M. Boore
Figure 8. Maps of site amplifications in the sediments to the west of the Chugach
Mountains, relative to the geometric mean of motions on class C sites (the brown area
shows the location of the Chugach Mountains; it is not site response). The amplifica-
tions were smoothed over short frequency intervals surrounding the center frequencies
of 0.2, 1.0, 5.0, and 14.0 Hz. The stations used in constructing the map are shown by
triangles; they are included to help in judging if amplification patterns are controlled
by a single station (as is the case for the high amplifications near the Chugach Moun-
tains for 14 Hz).
the displacement pulses are similar, close inspection shows ture propagation. For this reason I cannot assess the relative
that the pulses from the Denali fault earthquake have a some- importance of directivity for displacement pulse 2.
what longer duration. This leads to relatively more long-
period content in the response spectra for the Denali fault Pulses, Displacement Spectra, and Code Spectra
motions (Fig. 13), although for both earthquakes the dis-
placement response spectra are peaked for periods longer The relatively broad peaks in the displacement response
than 10 sec. It is important to note that the peaks are most spectra from about 8 to 15 sec is a feature not included in
likely due to the source and not to local site response. Are most spectra used for engineering design (e.g., Bommer and
the large, long-period motions affected by source directivity Elnashai, 1999). Many code spectra assume an increase
(e.g., Somerville et al., 1997)? Probably not, at least for the without limit at long periods, whereas others impose a con-
Hector Mine recording and pulses 2 and 3 for the Anchorage stant level for periods longer than about 2 to 4 sec. As shown
recordings from the Denali fault earthquake. In these cases by the comparisons in Figure 14, neither assumption is in
the angle between the direction of fault rupture and the di- agreement with the spectra in Anchorage from the Denali
rection from the fault to the station is close to 90⬚, a fault earthquake (and with reference to Fig. 13, the Hector
directivity-neutral direction (the angle from the rupture di- Mine earthquake). Of course the observation of enhanced
rection to station K2-16 is 96⬚ and 121⬚ from subevents 2 source-related long-period peaks in response spectra from
and 3, respectively). The azimuth to Anchorage from sub- only two earthquakes is not enough to produce a change in
event 1 is 66⬚ from the strike of the subevent, but Frankel schemes for constructing engineering design spectra. Recent
(2004) modeled the subevent as a point source, with no rup- studies of data from the increasing number of modern broad-Ground Motion in Anchorage, Alaska, from the 2002 Denali Fault Earthquake S81
Martirosyan et al., from RS Martirosyan et al., from RS
Martirosyan et al., from FS Martirosyan et al., from FS
Denali, from RS Denali, from RS
Denali, from FS Denali, from FS
4 K2-01/K2-16 4 K2-02/K2-16
3 3
Amplification
2 2
1 1
0.1 0.2 1 2 10 0.1 0.2 1 2 10
Frequency (Hz) Frequency (Hz)
Figure 9. Site response at nearby stations K2-01 and K2-02, relative to K2-16,
computed from Fourier amplitude spectra (FS) and response spectrum (RS). (K2-01 is
site class D, whereas K2-02 is site class C/D). Shown are the site responses from the
Denali fault earthquake ground motion and from the averages of 46 events, as deter-
mined by Martirosyan et al. (2002) (rms of the two horizontal components). The east–
west component of motion was used for the Denali fault earthquake recordings. The
Fourier spectra were smoothed before computing the ratios.
band digital recorders, as well as simulations of ground mo-
tion, have led to the introduction of a transition period in the
2003 NEHRP code that determines where the design spectral
displacement becomes flat. This transition period is a
Site response, relative to K2-16
mapped quantity and varies spatially in a way that roughly
From Denali Fault earthquake, recorded in Anchorage
avg FAS: 0.5--2.5 Hz (0.4--2.0 s)
3 depends on the magnitude of the dominant earthquake for a
avg FAS: 3.0--7.0 Hz (0.14--0.33 s)
given location determined from disaggregation of a proba-
bilistic seismic hazard map. The transition period is 16 sec
2.5 for recordings in Anchorage and 8 sec for the Hector Mine
recording. Using the new code to construct the design mo-
tions for Anchorage results in a spectrum remarkably similar
2 to the observed spectrum (Fig. 14), and the agreement with
the Hector Mine spectrum, although not shown, would be
equally good (the Anchorage recordings of the Denali fault
1.5 earthquake were not used in constructing the transition-
period maps (C. B. Crouse, personal comm., 2004)).
1 Summary
This purely observational study of digital strong-motion
0.5 data from the 2002 Denali fault earthquake recorded in and
0.5 1 1.5 2 2.5 3 near Anchorage, Alaska, finds a number of systematic fea-
From Martirosyan et al. (2002) tures in the ground motion. In agreement with previous stud-
ies, the data show significant ground-motion amplification.
Figure 10. Comparison of site responses (relative The amplifications are well differentiated by NEHRP site
to station K2-16) from smoothed Fourier amplitude class, with the class D amplification exceeding a factor of 2
spectra (FAS), as determined from the Denali fault
earthquake data (east–west component) and from relative to an average of motions on class C sites. New to
Martirosyan et al. (2002) (rms of the two horizontal this study is the finding that the site amplification extends to
components). periods of at least 10 sec.S82 D. M. Boore
12 K2-20: EW Comp. 6 K2-16: EW Comp.
whole record whole record
pulse 2 pulse 2
pulse 3 pulse 3
10 5
PSV (cm/s) (5% damping)
8 4
6 3
4 2
2 1
0 0
0.1 1 10 100 0.1 1 10 100
Period (s) Period (s)
Figure 11. 5%-damped pseudo relative velocity (PSV) response spectrum for the
east–west component at stations K2-20 and K2-16, from the whole record and from
windows that include separately the two large displacement pulses (pulses 2 and 3 in
Fig. 2). The portions of the accelerograms have different influences on the response
spectra. From the acceleration trace (Fig. 4), it is clear that most of the energy at high
frequencies is carried in pulse 2, so the response spectra from that pulse is essentially
equal to the whole record response spectrum at shorter periods. Conversely, for this
record pulses 2 and 3 contribute about equally to the longer-period response.
10 20
Denali Fault eq (M 7.9), sta. K2-03, EW comp.
Hector Mine eq (M 7.1), sta. 596, trans. comp. 10
As above, repeated with time shift
Displacement (cm)
5
SD (cm) (5% damping)
2
0 1
-5
0.2 Denali: class C/D
Denali: class C
50 100 150 0.1 Hector Mine, station 596
Time (s)
Figure 12. East–West displacements from station 1 10 100
K2-03 from the Denali fault earthquake. Super- Period (s)
imposed are two copies, shifted in time, of the trans-
verse displacements from the instrument 596 record- Figure 13. Displacement response spectrum (SD)
ing of the Hector Mine (HM) earthquake. The HM for the Denali fault earthquake recordings and for the
motions have been divided by 2.6 to correct for the transverse component of the 1999 Hector Mine, Cali-
different distances to the earthquakes. The factor of fornia, earthquake (after dividing the Hector Mine
2.6 came from the ground-motion prediction equa- spectrum by 2.6 to correct for the different distances
tions of Sadigh et al. (1997). All records were low- to the earthquakes). All records were low-cut filtered
cut filtered with a low-order acausal butterworth filter with a low-order acausal butterworth filter with a cor-
with a corner at 0.02 Hz (the filter response goes as ner at 0.02 Hz (the filter response goes as f 4 for low
f 4 for low frequencies). frequencies).Ground Motion in Anchorage, Alaska, from the 2002 Denali Fault Earthquake S83
without limit, whereas the Eurocode 8 displacement spec-
trum is constant or decreases for periods longer than 2 sec;
10 the observed spectra for the two earthquakes studied here
flatten at periods slightly in excess of 10 sec. The Denali
PGD
fault spectrum is, however, in good agreement with the re-
SD (cm) (5% damping)
1 cently adopted 2003 NEHRP building code.
Acknowledgments
0.1 I am greatly indebted to Chris Stephens for providing data and in-
sightful conversations and to Rod Combellick, Utpal Dutta, and Artak Mar-
tirosyan for sending me important information about stations and geology.
Denali: class C/D I also thank Art Frankel for some of his results in advance of publication
0.01 Denali: class C and Julian Bommer and E. V. Leyendecker for information regarding the
NEHRP: 2000 (fit to SD at 1.0 sec) Eurocode 8 and 2003 NEHRP codes, respectively. Reviews by Art Frankel,
NEHRP: 2003 (fit to SD at 1.0 sec)
Eurocode 8 (fit to SD at 1.0 sec)
Artak Martirosyan, Charlotte Rowe, Chris Stephens, and two anonymous
reviewers were very helpful.
0.001
0.1 1 10 100
Period (s) References
Figure 14. Comparison of observed displacement Bommer, J. J., and A. S. Elnashai (1999). Displacement spectra for seismic
response spectrum (SD) for class C/D and C sites in design, J. Earthquake Eng. 3, 1–32.
Anchorage to the spectra constructed following the Boore, D. M. (1999). Basin waves on a seafloor recording of the 1990
procedures for the following building codes: 2000 Upland, California, earthquake: implications for ground motions from
NEHRP (BSSC, 2001), 2003 NEHRP (BSSC, 2004), a larger earthquake, Bull. Seism. Soc. Am. 89, 317–324.
and Eurocode 8 (CEN, 1998). Also shown is the peak Boore, D. M. (2004). Can site response be predicted? J. Earthquake Eng.
ground displacement (PGD) for the Anchorage mo- 8, Special Issue 1, 1–41.
tions; the displacement response spectrum will by Boore, D. M., C. D. Stephens, and W. B. Joyner (2002). Comments on
asymptotic to this value at suffciently long periods. baseline correction of digital strong-motion data: examples from the
For NEHRP, the mapped values of spectral response 1999 Hector Mine, California, earthquake, Bull. Seism. Soc. Am. 92,
at 0.2 and 1.0 sec were used, but to emphasize the 1543–1560.
shape, the spectra for the three codes have been nor- Building Seismic Safety Council (BSSC) (2001). NEHRP Recommended
malized to a representative value of the data at 1.0 sec. Provisions for Seismic Regulations for New Buildings and Other
Structures, 2000 Edition, Part 1: Provisions, report prepared by the
Building Seismic Safety Council for the Federal Emergency Man-
agement Agency (Report No. FEMA 368), Washington, D.C. Avail-
able from www.bssconline.org/NEHRP2000/comments/provisions/
The long-period ground displacements are characterized
(last accessed December 2004).
by a series of distinct pulses, corresponding to the subevents Building Seismic Safety Council (BSSC) (2004). NEHRP Recommended
along the fault identified in source inversion studies (e.g., Provisions for Seismic Regulations for New Buildings and other
Frankel, 2004). The two largest pulses are similar in shape Structures, 2003 Edition, Part 1: Provisions; Part 2: Commentary,
and amplitude to the pulse radiated by the 1999 Hector Mine, report prepared by the Building Seismic Safety Council for the Fed-
California, earthquake. The moment magnitude of that earth- eral Emergency Management Agency (Report No. FEMA 450),
Washington, D.C. Available from www.bssconline.org/ (last accessed
quake (7.1) is similar to the moment magnitudes inferred for December 2004).
subevents 1 and 2 of the Denali fault earthquake (7.1 and Dutta, U., N. Biswas, A. Martirosyan, S. Nath, M. Dravinski, A. Papa-
7.0, respectively [Frankel, 2004]). These pulses produce a georgiou, and R. Combellick (2000). Delineation of spatial variation
localized long-period peak in response spectra, with the peak of shear-wave velocity with high frequency Rayleigh wave, Geophys.
for the Denali recordings being at a somewhat longer period J. Int. 143, 365–376.
Dutta, U., N. Biswas, A. Martirosyan, A. Papageorgiou, and S. Kinoshita
than for the Hector Mine earthquake recordings. The pulses (2003). Estimation of earthquake source parameters and site response
have polarizations that are similar for all stations and show in Anchorage, Alaska, from strong-motion network data using gen-
a systematic clockwise rotation from pulse 2 to pulse 4, con- eralized inversion method, Phys. Earth Planet. Interiors 137, 13–29.
sistent with SH waves radiated from localized sources along Dutta, U., A. Martirosyan, N. Biswas, A. Papageorgiou, and R. Combellick
the fault progressively to the east of the hypocenter. As noted (2001). Estimation of S-wave site response in Anchorage, Alaska,
from weak-motion data using generalized inversion method, Bull.
by Frankel (2004), most of the high-frequency motion is Seism. Soc. Am. 91, 335–346.
carried by the S-wave pulse from subevent 1; the other sub- Eberhart-Phillips, D., P. J. Haeussler, J. T. Haeussler, J. T. Freymueller,
events apparently radiated relatively little high-frequency A. D. Frankel, C. M. Rubin, P. Craw, N. A. Ratchkovski, G. Ander-
energy. The design spectra from the well-known 2000 son, G. A. Carver, A. J. Crone, T. E. Dawson, H. Fletcher, R. Hansen,
E. L. Harp, R. A. Harris, D. P. Hill, S. Hreinsdóttir, R. W. Jibson,
NEHRP and the Eurocode 8 building codes disagree with the
L. M. Jones, R. Kayen, D. K. Keefer, C. F. Larsen, S. C. Moran, S. F.
displacement response spectrum from both the Hector Mine Personius, G. Plafker, B. Sherrod, K. Sieh, N. Sitar, and W. K. Wal-
and the Denali fault earthquakes in completely different lace (2003). The 2002 Denali fault earthquake, Alaska: a large mag-
ways: the 2000 NEHRP displacement spectrum increases nitude, slip-partitioned event, Science 300, 1113–1118.S84 D. M. Boore
European Committee for Standardization (CEN) (2002). Eurocode 8: De- Nath, S. K., N. N. Biswas, M. Dravinski, and A. S. Papageorgiou (2002).
sign of structures for earthquake resistance, Draft No. 5, CEN Doc Determination of S-wave site response in Anchorage, Alaska, in the
CEN/TC250/SC8/N317 (prEN 1998-1:200X), Brussels. 1–9 Hz frequency band, Pure Appl. Geophys. 159, 2673–2698.
Frankel, A. (2004). Rupture process of the M 7.9 Denali fault, Alaska, Sadigh, K., C.-Y. Chang, J. A. Egan, F. Makdisi, and R. R. Youngs (1997).
earthquake: Subevents, directivity, and scaling of high-frequency Attenuation relationships for shallow crustal earthquakes based on
ground motions, Bull. Seism. Soc. Am. 94, no. 6B, S234–S255. California strong motion data, Seism. Res. Lett. 68, 180–189.
Hartman, D. C., G. H. Pessel, and D. L. McGee (1974). Stratigraphy of the Somerville, P. G., N. F. Smith, R. W. Graves, and N. A. Abrahamson
Kenai group, Cook Inlet, Alaska Div. Geol. Geophys. Surv. Open-File (1997). Modification of empirical strong ground motion attenuation
Rept. 49. Available at www.dggs.dnr.state.ak.us/pubs/pubs?reqtype relations to include the amplitude and duration effects of rupture di-
⳱citation&ID⳱149 (last accessed December 2004). rectivity, Seism. Res. Lett. 68, 199–222.
Martirosyan, A., and N. Biswas (2002). Site response at a rock site in Wesson, R. L., A. D. Frankel, C. S. Mueller, and S. C. Harmsen (1999).
Anchorage, Alaska from borehole strong-motion records (abstract), Probabilistic seismic hazard maps of Alaska, U.S. Geol. Surv. Open-
Seism. Res. Lett. 73, 267. File Rept. 99-36, 20 pp.
Martirosyan, A., N. Biswas, U. Dutta, D. Cole, and A. Papageorgiou (2004).
Ground motion analysis in the Anchorage basin: 1-D approach, J.
Earthquake Eng. 7, 251–274. U.S. Geological Survey, MS 977
Martirosyan, A., U. Dutta, N. Biswas, A. Papageorgiou, and R. Combellick 345 Middlefield Road
(2002). Determination of site response in Anchorage, Alaska, on the Menlo Park, California 94025
basis of spectral ratio methods, Earthquake Spectra 18, 85–104. boore@usgs.gov
Nath, S. K., D. Chatterjee, N. N. Biswas, M. Dravinski, D. A. Cole, A.
Papageorgiou, J. A. Rodriguez, and C. J. Poran (1997). Correlation
study of shear-wave velocity in near-surface geological formations in
Anchorage, Alaska, Earthquake Spectra 13, 55–75. Manuscript received 7 January 2004.You can also read